HAL Id: hal-02510696
https://hal.archives-ouvertes.fr/hal-02510696
Submitted on 18 Mar 2020
HAL is a multi-disciplinary open access archive for the deposit and dissemination of sci-entific research documents, whether they are pub-lished or not. The documents may come from teaching and research institutions in France or abroad, or from public or private research centers.
L’archive ouverte pluridisciplinaire HAL, est destinée au dépôt et à la diffusion de documents scientifiques de niveau recherche, publiés ou non, émanant des établissements d’enseignement et de recherche français ou étrangers, des laboratoires publics ou privés.
Protease Inhibitor-Based Second-Line Regimens in
HIV-Infected Patients in West and Central Africa.
S. Boyer, M. L. Nishimwe, Luis Sagaon-Teyssier, L. March, S. Koulla-Shiro,
Marwân-Al-Qays Bousmah, R. Toby, Mireille Mpoudi-Etame, Ndeye Fatou
Ngom Gueye, A. Sawadogo, et al.
To cite this version:
S. Boyer, M. L. Nishimwe, Luis Sagaon-Teyssier, L. March, S. Koulla-Shiro, et al.. Cost-Effectiveness of Three Alternative Boosted Protease Inhibitor-Based Second-Line Regimens in HIV-Infected Patients in West and Central Africa.. PharmacoEconomics - open / Pharmacoecon Open, [Cham, Switzerland] : Springer International Publishing AG, [2017]-, 2020, 4 (1), pp.45-60. �10.1007/s41669-019-0157-9�. �hal-02510696�
Vol.:(0123456789)
https://doi.org/10.1007/s41669-019-0157-9
ORIGINAL RESEARCH ARTICLE
Cost‑Effectiveness of Three Alternative Boosted Protease
Inhibitor‑Based Second‑Line Regimens in HIV‑Infected Patients
in West and Central Africa
S. Boyer1 · M. L. Nishimwe1 · L. Sagaon‑Teyssier1,2 · L. March3 · S. Koulla‑Shiro4 · M.‑Q. Bousmah1,2 · R. Toby5 ·
M. P. Mpoudi‑Etame6 · N. F. Ngom Gueye7 · A. Sawadogo8 · C. Kouanfack9,10 · L. Ciaffi3 · B. Spire1 · E. Delaporte3,11 · for
the 2‑Lady Group
Published online: 4 July 2019 © The Author(s) 2019
Abstract
Background While dolutegravir has been added by WHO as a preferred second-line option for the treatment of HIV infec-tion, boosted protease inhibitor (bPI)-based regimens are still needed as alternative second-line options. Identifying optimal bPI-based second-line combinations is essential, given associated high costs and funding constraints in low- and middle-income countries. We assessed the cost-effectiveness of three alternative bPI-based second-line regimens in Burkina Faso, Cameroon and Senegal.
Methods We used data collected over 2010–2015 in the 2LADY trial/post-trial cohort. Patients with first-line antiretroviral therapy (ART) failure were randomly assigned to tenofovir/emtricitabine + lopinavir/ritonavir (TDF/FTC LPV/r; arm A), abacavir + didanosine + lopinavir/ritonavir (arm B), or tenofovir/emtricitabine + darunavir/ritonavir (arm C). Costs (US dol-lars, 2016), quality-adjusted life-years (QALYs) and incremental cost-effectiveness ratios were computed for each country over 24 months of follow-up and extrapolated to 5 years using a simulated patient-level Markov model. We assessed uncer-tainty using cost-effectiveness acceptability curves, scenarios and prices threshold analysis.
Results In each country, over 24 months, arm A was significantly less costly than arms B and C (incremental costs ranging from US$410–$US721 and US$468–US$546 for B and C vs A, respectively) and offered similar health benefits (incremental QALY: − 0.138 to 0.023 and − 0.179 to 0.028, respectively). Over 5 years, arm A remained the least costly, health benefits not being significantly different between arms. Compared with arms B and C, in each study country, Arm A had a ≥ 95% probability of being cost-effective for a large range of cost-effectiveness thresholds, irrespective of the scenario considered.
Conclusions Using TDF/FTC LPV/r as a bPI-based second-line regimen provided the best economic value in the three study countries.
Trial Registration ClinicalTrials.gov Identifier: NCT00928187.
S. Boyer and M. L. Nishimwe contributed equally.
Members of the ANRS 12169 2LADY Study Group are listed in “Acknowledgements”.
Electronic supplementary material The online version of this article (https ://doi.org/10.1007/s4166 9-019-0157-9) contains supplementary material, which is available to authorized users. * M. L. Nishimwe
marie.nishimwe@inserm.fr
Key Points for Decision Makers
The second-line regimen tenofovir/emtricitabine + lopi-navir/ritonavir (TDF/FTC LPV/r) saved costs and had similar health benefits to abacavir + didanosine + lopi-navir/ritonavir (ABC ddI LPV/r) and tenofovir/emtricit-abine + darunavir/ritonavir (TDF/FTC DRV/r) in HIV-positive patients with first-line ART failure in Burkina Faso, Cameroon and Senegal.
Cost savings were driven by the lower monthly prices of the two nucleoside reverse transcriptase inhibitor (NRTI) drugs (TDF/FTC vs ABC ddI) and the boosted protease inhibitor (LPV/r vs DRV/r), even when the most recent antiretroviral drug prices (reported for the year 2018) were taken into consideration.
Using TDF/FTC LPV/r as alternative boosted protease inhibitor-based second-line therapy to dolutegravir, which was added as a WHO preferred second-line option in July 2018, may be the most efficient use of resources in low- and middle-income countries.
1 Introduction
At the end of 2017, the number of people living with HIV (PLHIV) accessing antiretroviral therapy (ART) reached 21.7 million people worldwide, with 13.5 million in Sub-Saharan Africa [1]. Second-line ART only concerned a minority of patients, estimated at approximately 5.3% of all patients on ART in low- and middle-income countries (LMIC) in 2014 [2]. However, the need for second-line ART is forecast to grow in the coming years because of high first-line treatment failure rates, estimated at between 8 and 23% after 5 years [3]. This trend is expected to be reinforced by the growing demand for first-line ART following recent international guidelines recommending ART initiation irre-spective of CD4 count [4]. Furthermore, PLHIV in LMIC with first-line ART failure generally show accumulation of drug resistance due to late diagnosis of treatment failure in the absence of HIV RNA monitoring [5]. Given that the risk of first-line treatment failure increases over time—with the possible associated emergence of a variety of resistance pat-terns—how best to provide second-line therapy is a crucial issue in LMIC [6].
The World Health Organization’s (WHO) 2016 guide-lines suggested using second-line regimens based on boosted protease inhibitors (bPI) with two nucleoside
reverse transcriptase inhibitors (NRTIs) after the failure of non-nucleoside reverse transcriptase inhibitor (NNRTI)-based first-line regimens [4]. The preferred WHO options for adults were ritonavir-boosted lopinavir (LPV/r) or atazanavir (ATV/r). Alternative options for bPI included ritonavir-boosted darunavir (DRV/r). The WHO’s updated 2018 guidelines added a recent integrase inhibitor, dolute-gravir (DTG), in combination with a two-NRTI backbone among the preferred second-line options [7].
The recent clinical trial ANRS 12169 2LADY, con-ducted in Burkina Faso, Cameroon and Senegal, provided evidence for the short-term efficacy and safety of the fol-lowing three bPI-based second-line regimens: (1) tenofo-vir/emtricitabine + lopinavir/ritonavir (TDF/FTC LPV/r), (2) tenofovir/emtricitabine + darunavir/ritonavir (TDF/ FTC DRV/r)—both recommended in WHO 2016 and 2018 guidelines—and (3) abacavir + didanosine + lopinavir/rito-navir (ABC ddI LPV/r), which was recommended until 2010 but had never been evaluated [8]. Clinical outcomes assessed at 1 year showed that all three obtained similar and satisfactory virologic control as well as good immune recovery, safety and tolerance.
Beyond the clinical challenges, the choice of the sec-ond-line combinations to use in LMIC raises important economic questions. The yearly cost of bPI-based second-line ART is, on average, twice that of first-second-line ART [9]. Moreover, the growing number of PLHIV requiring more expensive second-line ART, together with the increased demand for first-line as a consequence of the international guidelines highlighted above, is stretching already strained budgets [10]. Despite these challenges, literature on the economic value of second-line ART in LMIC is scarce. Several studies have evaluated the cost-effectiveness of switching to second-line after first-line failure [11–13], but we identified only one which assessed alternative second-line combinations [14]. In this study, the authors compared a simplified second-line therapy based on lopinavir/ritona-vir + raltegralopinavir/ritona-vir with lopinalopinavir/ritona-vir/ritonalopinavir/ritona-vir + 2NRTI in South Africa and Nigeria. Furthermore, no economic evaluation of the alternative bPI-based second-line regimens recom-mended by the WHO has yet been published.
Identifying the optimal bPI-based second-line combi-nations to use in LMIC, by jointly assessing their respec-tive benefits and costs, is essential to optimize available resources, especially given the sometimes small differ-ences in health benefits provided by antiretroviral drugs (ARV) whose costs vary significantly. This study com-pared, over the short and medium terms, the health ben-efits, costs and cost-effectiveness of three alternative bPI-based second-line regimens assessed within the ANRS 12169 2LADY trial in three LMIC: Burkina Faso, Cam-eroon and Senegal.
2 Methods
2.1 Data and Study Population
We used data collected over the 2010–2015 period in the randomized, 48-week (48 W) 2LADY trial and subsequent post-trial follow-up. Full details of the trial design, analy-sis and results are described elsewhere [8].
Briefly, the trial was conducted between January 2010 and September 2013 in four Day-Care Centres for HIV infection located in the national reference hospitals of Burkina Faso, Cameroon and Senegal. It enrolled 454 HIV-1 positive adults (aged > 18 years) with NNRTI-based first-line ART failure after a minimum 6 months of treatment and without recent (3 months) ART switch-ing. Participants were randomly assigned (1:1:1) to tenofovir/emtricitabine + lopinavir/ritonavir (arm A); abacavir + didanosine + lopinavir/ritonavir (arm B); or tenofovir/emtricitabine + darunavir/ritonavir (arm C). Clinical evaluation and laboratory monitoring (includ-ing renal and liver function tests, total blood count and plasma viral load) were performed at 4 weeks, then every 3 months during the first year and every 6 months there-after. At the end of the trial (i.e. 48 W visit of the last patient enrolled), participant follow-up was continued in a cohort study using the same procedures until December 2015 (date of the last visit).
The base-case analysis was conducted using a modi-fied intention-to-treat analysis (mITT), which included 451 participants (i.e. 152, 145 and 154 in arms A, B and C, respectively) who received at least one dose of the assigned treatment. Three participants with major protocol violations were excluded. Overall, median (interquartile range [IQR]) age of participants was 38 [32; 46] years and 72% were women. Ninety participants were followed in Burkina Faso, 302 in Cameroon and 59 in Senegal. At baseline, median [IQR] of CD4 cells/mm3 and viral load
(VL) (log10) was 183 [87; 290] and 4.5 [4.0; 5.1], respec-tively, and 27% of patients had a VL ≥ 100,000 copies/mL. The longest follow-up duration was 60 months (n = 15) and median [IQR] follow-up was 3.0 [2.5; 4.0] years.
2.2 Outcomes
The main outcomes considered in the cost-effective-ness analysis included costs, quality-adjusted life-years (QALYs) and incremental cost-effectiveness ratios (ICERs). Outcomes were first computed over the first 24 months (24 M) of follow-up based on both the trial data and its subsequent cohort and then extrapolated to 5 years using a simulated patient-level Markov model.
Health benefits and costs were estimated overall (i.e. for the whole study population in the three study countries) and for each country. Beyond the first year, they were dis-counted at an annual rate of 3.5% [15].
2.2.1 Health Benefits and Cost Measurement over 24 M of Follow‑Up
2.2.1.1 Health Benefits In the base-case analysis, for each country and for each arm we assessed the mean number of QALYs per patient with their respective 95% confidence intervals (CI) over 24 M of follow-up. QALYs were com-puted as the time spent in a specific health state (defined according to CD4 count ranges as described in Sect. 2.2.2.1) weighted by the utility score corresponding to that health state. Utility estimates associated with CD4 count range were obtained from the DART trial in Uganda using the time trade-off method (Table 1) [16]. For each country and for each arm, we also assessed life-years saved (LYS) using the Kaplan–Meier (KM) estimator. Data were censored at the 24 M visit or, if follow-up was shorter, at the time of the last visit. In addition, we assessed the following outcomes at the same timepoint: virological success (proportions of patients with VL < 50 copies/mL and < 1000 copies/mL), increase in CD4 cell count and proportion of patients who switched to third-line therapy.
2.2.1.2 Costs Costs were measured from enrolment to the 24 M visit or, if follow-up was shorter, to the last visit. Cen-soring costs were not accounted for as the attrition rate over the first 24 M was low (17/451, i.e. 3.3%) [17]. Costs were assessed from the health system perspective and included the following cost items: ARV, concomitant drugs, labora-tory tests, outpatient consultations and inpatient stays. Total costs were estimated for each arm, overall and by country, as the sum of all individual healthcare resources used by participants multiplied by their corresponding unit cost in the study country. Data on healthcare resources consumed by participants over the study period (2010–2015) were obtained through standardized case report forms. Their respective unit costs were obtained for the years 2015 and
Table 1 Utility weights used in the model
HS Health State, WHO World Health Organization
CD4 count range WHO stage match Utility weights HS4 (> 500 cells/mm3) Symptomatic HIV 0.75
HS3 (350–500 cells/
mm3) Symptomatic HIV 0.75
HS2 (200–349 cells/
mm3) Minor AIDS-defining illness 0.49 HS1 (< 200 cells/mm3) Mean of minor and major
2016 in each study site using trial accounting information and data collection, except for ARV costs, which were val-ued using the WHO Global Price Reporting Mechanism database [Supplemental Table 1, see Electronic Supple-mentary Material (ESM)] [18]. In the base-case analysis, the range of yearly prices of ARV according to the study country was as follows: US$283–313 for TDF/FTC LPV/r, US$474–701 for ABC ddI LPV/r and US$544–629 for TDF/ FTC DRV/r. For each resource category and for each arm, we calculated the mean healthcare use and the mean cost per patient-year. Costs in Franc de la Communauté
Finan-cière Africaine (FCFA) were first converted to US dollars
using the year-specific exchange rates. These nominal costs were then deflated in real value expressed in 2016 US dol-lars [19]. Data on exchange rates and inflation were obtained from the World Bank [20].
2.2.2 Extrapolation of Health Benefits and Costs over 5 Years
2.2.2.1 Model Description As HIV infection is a chronic disease, a simulated patient-level Markov model was also developed based on trial and post-trial data to assess partici-pants’ disease progression and outcomes over the medium term (i.e. 5 years) [21, 22]. The structure of the model used to capture the treatment-modified disease progression of participants switching to bPI-based second-line ART regi-mens is depicted in Supplemental Fig. 1 (see ESM). The model has four transitional health states defined accord-ing to CD4 count ranges [< 200 cells/mm3 (health state
1, HS1); 200–350 cells/mm3 (HS2); 350–500 cells/mm3
(HS3); ≥ 500 cells/mm3 (HS4)], and one absorbing health
state corresponding to death, whether related or not to HIV infection (HS5). This structure is a simplification of a previ-ous model used in high-income countries that included VL levels in the definition of health states [23] and that has been applied to HIV-positive patients in LMIC [12, 24].
At enrolment, patients were categorized into one of the first four health states (55.4% were in HS1, 28.4% in HS2, 12.9% in HS3 and 3.3% in HS4). Depending on the disease progression, they either remained in the same health state or moved to another health state (including death). Exact dates of death and CD4 count measurements observed in the study population were specified in the Markov model to define transitions between health states. To fit data avail-ability (quarterly follow-up during the first year and bian-nually thereafter), cycle durations were set up to 3 months for the first year of follow-up and 6 months after week 48. Transition probabilities between health states were estimated from the intensity transition matrix, which indicated the rate at which patients moved from state r to state s in the period
t to t + u [21, 22]. The intensity transition matrix was com-puted using transitions between states that were observed in
the study population during 20 trimesters of follow-up (cor-responding to 4 trimesters in the first year and 8 semesters after week 48). Effects of participants’ individual character-istics on transition probabilities between health states were also taken into account in the model using an exponential specification under the proportional hazards [22]. The final model was selected using the forward stepwise method and included the following covariates: gender, CD4 cells/mm3 at
ART initiation, treatment arm and country of residence (all fixed), having experienced virological failure after switch-ing to second-line ART and age (both time varyswitch-ing) (see Appendix 2 in the ESM).
2.2.2.2 Health Benefits Using the Markov model estimates (i.e. transition probabilities adjusted for individual charac-teristics), we predicted health states after 24 M and until 5 years (i.e. 12 cycles of 3 months) for participants not observed over that period in each study country. To guar-antee stable results, we ran 15,000 replications per patient. Life tables were used to update probability matrices to account for the probability of death conditional on country, age and gender. The arm-specific number of QALYs was estimated at each simulated cycle by multiplying the num-ber of patients by the time spent in the different health states (except death) weighted by the utility score corresponding to each health state. The total number of QALYs per arm and per country at 5 years was then computed by adding the cumulated number of QALYs over the 12 simulated cycles and the number of QALYs accrued over the first 24 M of follow-up.
2.2.2.3 Costs The previous simulations of participants’ health states from 24 M to 5 years were used to estimate costs beyond 24 M. For each arm and each country, a mean cost per 3-month cycle was assigned to each health state (see Appendix 3 in the ESM). The arm- and country-spe-cific costs were also estimated first at each simulated cycle by multiplying the number of patients in a given health state by the corresponding health state mean cost and second, over 3 years as the total (cumulative) costs accrued over the 12 cycles. Costs estimations obtained previously over the first 24 M were then added to this estimation to compute the total cost per arm and per country at 5 years.
2.3 Economic and Sensitivity Analysis
Methods employed in the economic analysis are in line with those recommended in international guidelines and, in particular, follow standards for economic evaluation in clinical trials [15, 17]. In each study country, ICERs were computed for each strategy, compared with the next most costly, non-dominated strategy, as the differential mean costs divided by the differential health benefits [25]. As
suggested by WHO [26], we considered an intervention to be very cost-effective if its ICER was lower than one times the per-capita gross domestic product (GDP) (i.e. US$584 in Burkina Faso, US$1392 in Cameroon and US$1231 in Senegal, corresponding to the yearly 2016 per-capita GDP at nominal values [27]). As this approach may be criticized because of the uncertainty of the value of λ corresponding to the maximum cost-effectiveness threshold [28], we varied λ from US$0 to US$10,000 in each study country.
Uncertainty surrounding the estimation of the cost-effec-tiveness outcomes was addressed using the cost-effective-ness acceptability curve (CEAC) methods [29]. Employing a non-parametric technique based on bootstrapping, we simulated 50,000 pairs of incremental costs and QALYs and represented them in the cost-effectiveness plan (CEP). Based on the simulations, we calculated the 95% CI for both incre-mental costs and QALYs as well as the probability of TDF/ FTC LPV/r being cost-effective compared with both other arms at different thresholds (i.e. the proportion of the incre-mental cost-effect pairs that fall below the cost-effectiveness threshold represented in the CEP by the line with slope λ drawn through the origin).
In addition, we conducted a deterministic one-way sensi-tivity analysis both for the base-case analysis conducted over 24 M and for the extrapolation of the results to 5 years. First, we considered the most recent information on ARV prices reported for LMIC by Médecins Sans Frontières (MSF) for the year 2018 (Scenario 1) [30]. We also examined the effect on the ICERs when considering (1) LYS to measure health benefits (Scenario 2) and (2) an alternative source for utility estimates to compute QALYs (Scenario 3) [31]. We then varied the discount rate from 0 to 6% (Scenario 4a and 4b).
Finally, for each study country, we calculated the price thresholds that made DRV/r-based regimens as cost-effective as arm A (i.e. to be cost-effective with a probability of 50% for a cost-effectiveness threshold of one times the country’s per-capita GDP). Price thresholds were not computed for the comparison with arm B considering results of the clinical trial, which argue for the elimination of this combination from WHO recommendations [8].
Analyses were performed using SAS version 9.4 and R
version 3.5.0 (packages msm and markovchain).
3 Results
3.1 Base‑Case Analysis
At 24 M, 12 participants had died (3, 4 and 5 in arm A, B and C, respectively, p = 0.82), 17 were lost to follow-up (9, 4 and 4 in arms A, B and C, respectively, p = 0.26), and 422 were still in care including 84 in Burkina Faso, 285 in Came-roon and 52 in Senegal. In each country, health benefits were
very similar between the three arms. Discounted mean (95% CI) QALYs over 24 M ranged from 1.037 to 1.201 in arm A, 1.060–1.119 in arm B and 0.964–1.126 in arm C according to country. In addition, the mean increase (95% CI) in CD4 cell count from baseline to 24 M was 208 (131–308) cells/ mm3 without significant differences between arms (either
overall, or according to country) (Table 2). In all three study countries, the proportion of virological success was also not significantly different in the three arms, irrespective of VL threshold.
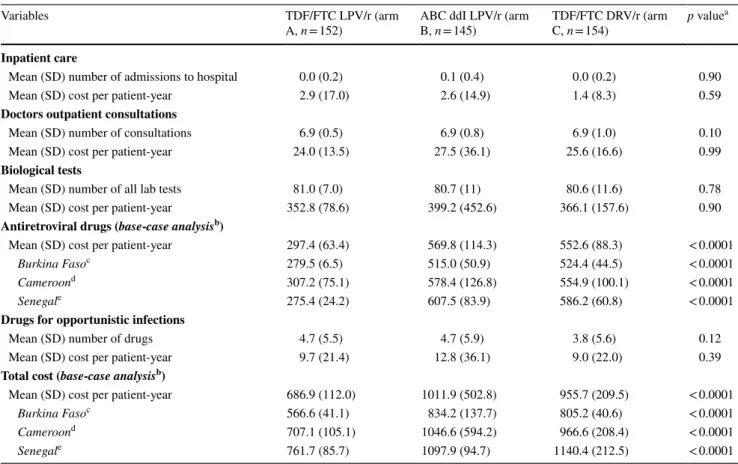
Table 3 describes healthcare use and corresponding mean costs per patient-year estimated over 24 M, overall (i.e. for the whole study population) and per study country. Total mean costs (SD) per patient-year were US$686.9 (112.0), US$1011.9 (502.8) and US$955.7 (209.5) in arms A, B and C, respectively. Overall, total mean costs per patient-year ranged from US$567 to US$762 in arm A, US$834–1098 in arm B and US$805–1140 in arm C according to country. In all three arms for all three countries, the main cost item was ARV, representing 36–49% of total costs in arm A, 55–62% in arm B and 51–65% in arm C. All cost items were broadly similar across arms except ARV.
In the three study countries, arm A was significantly less costly than the other two arms and offered similar health benefits (Table 4). Indeed, mean cost (95% CI) differences were estimated at US$410 (280–505) in Burkina Faso, US$532 (441–621) in Cameroon and US$721 (626–819) in Senegal for B vs A, and US$488 (439–532), US$468 (395–538) and US$546 (283–764), respectively, for C vs A. Health benefits were not significantly different between the three arms with mean (95% CI) incremental QALYs of − 0.021 (− 0.140 to 0.169) in Burkina Faso, 0.023 (− 0.060 to 0.106) in Cameroon and − 0.138 (− 0.319 to 0.049) in Senegal for arm B vs A, and 0.028 (− 0.107 to 0.162), − 0.073 (− 0.153 to 0.008) and − 0179 (− 0.381 to 0.018), respectively, for C vs A.
Arm A had a 100% probability of being cost-effective for both comparisons in the three study countries. Figure 1
represents the CEAC for arm A (compared with B and C, respectively) for each study country. The corresponding cost-effects pairs are presented in Supplemental Fig. 2 (see ESM). The CEAC showed that in the three study countries, the probability of arm A being cost-effective was ≥ 95% for a large range of cost-effectiveness thresholds (i.e. US$0–3063 in Burkina Faso, US$0–5938 in Cameroon and US$0–10,000 in Senegal compared with arm B; US$0–3559 in Burkina Faso and US$0–10,000 in Cameroon and Senegal compared with arm C).
3.2 Simulated Patient‑Level Markov Model
Estimated transition probabilities used to predict patients’ health states at 5 years, and the effect of individual
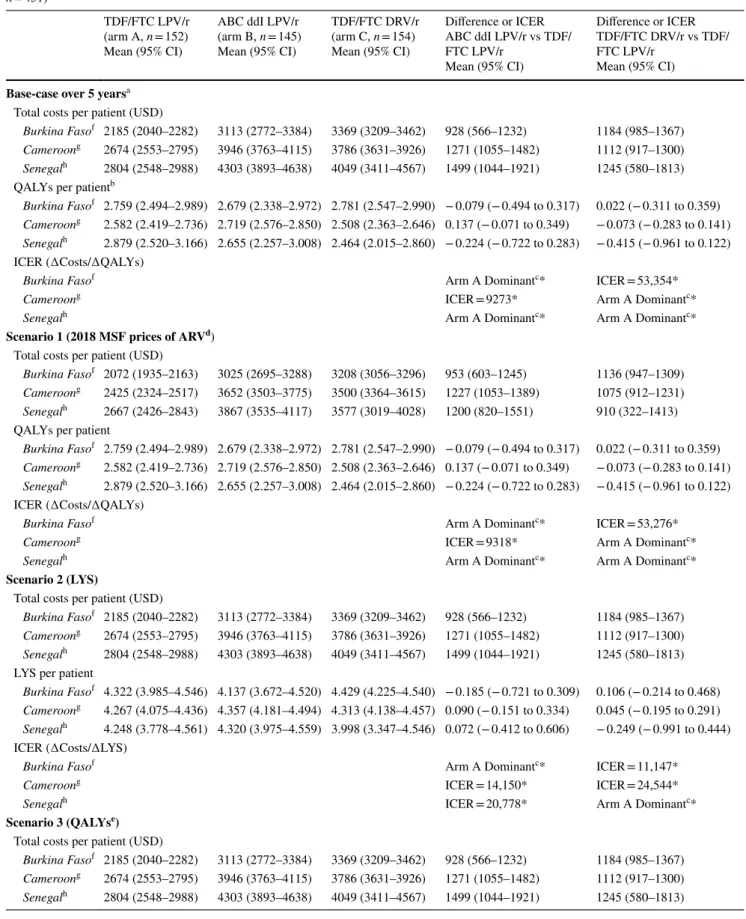
covariates on the estimation of these probabilities are pre-sented in Appendix 2 and Supplemental Table 4, respec-tively (see ESM). Similar findings to those in the base-case analysis were obtained when extrapolating outcomes to 5 years (Table 5). Cost estimations at 5 years showed that arm A remained the least costly, with mean (95% CI) cost differences of US$928 (566–1232) in Burkina Faso, US$1271 (1055–1482) in Cameroon and US$1499 (1044–1921) in Senegal for arm B vs A and US$1184 (985–1367) in Burkina Faso, US$1112 (917–1300) in Cameroon and US$1245 (580–1813) in Senegal for arm C vs A. Health benefits were still non-significantly differ-ent between the three arms (incremdiffer-ental QALYs [95% CI]: − 0.079 [− 0.494 to 0.317] in Burkina Faso, 0.137 [− 0.071 to 0.349] in Cameroon and − 0.224 [− 0.722 to 0.283] in Senegal for arm B vs A and 0.022 [− 0.311; 0.359] in Burkina Faso, − 0.073 [− 0.283 to 0.141] in Cameroon and − 0.415 [− 0.961 to 0.122] in Senegal for arm C vs A). In the three study countries, arm A had a 100% probability of being cost-effective compared with arms B and C.
3.3 Scenarios and Prices Threshold Analysis
The results of one-way sensitivity analysis for the base-case analysis over 24 M and for the simulation at 5 years showed that results were robust. Irrespective of the scenario and the temporal horizon, arm A remained the preferred strategy with a probability of 100% (Tables 4, 5). Indeed, when taking into account ARV prices observed in 2018, cost differences between arms were similar except in Senegal where they dropped for both comparisons with arms B and C, both in 24 M and 5-year analyses. However, the prob-ability of arm A being cost-effective was still 100% com-pared with arms B and C as its cost remained significantly lower (incremental costs [95% CI] were US$607 [542–683] and US$1248 [858–1608] for arm B vs A over 24 M and 5 years, respectively, and US$419 [180–622] and US$948 [345–1463] for arm C vs A over the same periods, respec-tively). When considering LYS to measure health benefits (Scenario 2) and when using an alternative sources of data for utility estimates (Scenario 3), health outcomes remained
Table 2 Clinical outcomes at 24 months of follow-up (ANRS 12169 2LADY, n = 451)
ABC ddI LPV/r abacavir + didanosine + lopinavir/ritonavir, ART antiretroviral treatment, CI confidence interval, TDF/FTC DRV/r tenofovir/ emtricitabine + darunavir/ritonavir, TDF/FTC LPV/r tenofovir/emtricitabine + lopinavir/ritonavir
*One missing value
a Chi square test for categorical variables and Mann–Whitney test for continuous variables b n = 90 (30 in Arm A, 28 in Arm B and 32 in Arm C)
c n = 302 (101 in Arm A, 99 in Arm B and 102 in Arm C) d n = 59 (21 in Arm A, 18 in Arm B and 20 in Arm C)
TDF/FTC LPV/r
(arm A, n = 152) ABC ddI LPV/r (arm B, n = 145) TDF/FTC DRV/r (arm C, n = 154) Total (n = 451) p value a
Death, n (%) 3 (2.0) 4 (2.8) 5 (3.3) 12 (2.7) 0.82
Lost to follow-up, n (%) 9 (5.9) 4 (2.8) 4 (2.6) 17 (3.3) 0.26
In care, n (%) 140 (92.1) 137 (94.5) 145 (94.2) 422 (93.6) 0.68
Switched to third-line ART, n (%) 1 (0.7) 3 (2.1) 3 (2.0) 7 (1.6) 0.64
Immunological and virological outcomes among patients in care at 24 months (n = 421)*
Mean increase (95% CI) in CD4 count
from baseline 214 (122–307) 223 (139–361) 187 (131–274) 208 (131–308) 0.12
Burkina Fasob 234 (190–279) 278 (201–355) 192 (148–235) 232 (200–263) 0.08
Cameroonc 224 (189–258) 246 (213–280) 207 (185–230) 226 (208–243) 0.32
Senegald 238 (155–322) 216 (146–286) 240 (158–323) 232 (189–275) 0.74
HIV viral load < 50 copies/mL, n (%) 84 (60.4) 79 (57.7) 89 (61.4) 252 (59.9) 0.81
Burkina Fasob 16 (57.1) 11 (44.0) 19 (61.3) 46 (54.8) 0.42
Cameroonc 68 (73.9) 68 (71.6) 70 (72.2) 206 (72.5) 0.94
Senegald 14 (73.7) 10 (58.8) 11 (64.7) 35 (66.0) 0.67
HIV viral load < 200 copies/mL, n (%) 116 (83.5) 119 (86.9) 130 (89.7) 365 (86.7) 0.31
Burkina Fasob 23 (82.1) 19 (76.0) 28 (90.3) 70 (83.3) 0.36
Cameroonc 76 (82.6) 86 (90.5) 88 (90.7) 250 (88.0) 0.17
non-significantly different between arms in any of the three study countries, both in the 24 M and 5-year analyses. Con-sequently, arm A remained cost-effective with a 100% prob-ability. Furthermore, increasing (or decreasing) the discount rate to 6% (0%) had little impact on the incremental costs and the LYS per patient.
Finally, the price threshold analysis showed that the price of DRV/r would have to decrease by 58% in Burkina Faso, 70% in Cameroon and 100% in Senegal to be as cost-effec-tive as arm A; that is, to be cost-effeccost-effec-tive with a probability of 50% (considering an unchanged 2016 LPV/r price).
4 Discussion
This study provides information on the economic value of bPI-based second-line ART in LMIC using data from the 2LADY trial and the post-trial cohort implemented in three
countries in West and Central Africa. Besides the economic evaluation conducted alongside the trial over 2 years, we developed a simulated patient-level Markov model to assess the medium term (5-year) joint effects of ART benefits as well as factors that may affect HIV disease evolution and treatment success, together with economic factors including ARV prices.
Compared with ABC ddI LPV/r and TDF/FTC DRV/r, our findings showed that, in each study country, TDF/FTC LPV/r was the optimal second-line treatment with a prob-ability ≥ 95% for a large range of cost-effectiveness thresh-olds, irrespective of the scenarios considered. Comparisons of clinical outcomes in the short term (1 and 2 years) showed small differences in efficacy in terms of virological success, immune recovery, safety and tolerance [8]. Modelling and scenario analysis also suggested similar health benefits at 5 years with no significant differences observed in survival or in QALYs. However, the poorer toxic profile (especially
Table 3 Healthcare use and cost of care per patient-year (US dollars, 2016) estimated over 24 months of follow-up (ANRS 12169 2LADY, n = 451)
ABC ddI LPV/r abacavir + didanosine + lopinavir/ritonavir, SD standard deviation, TDF/FTC DRV/r tenofovir/emtricitabine + darunavir/ritonavir, TDF/FTC LPV/r tenofovir/emtricitabine + lopinavir/ritonavir
a Chi square test for categorical variables, and Wilcoxon rank-sum test for continuous variables
b Unit prices of antiretroviral drugs were obtained for the year 2016 from the WHO Global Price Reporting Mechanism database c n = 90 (30 in arm A, 28 in arm B and 32 in arm C)
d n = 302 (101 in arm A, 99 in arm B and 102 in arm C) e n = 59 (21 in arm A, 18 in arm B and 20 in arm C)
Variables TDF/FTC LPV/r (arm
A, n = 152) ABC ddI LPV/r (arm B, n = 145) TDF/FTC DRV/r (arm C, n = 154) p value a
Inpatient care
Mean (SD) number of admissions to hospital 0.0 (0.2) 0.1 (0.4) 0.0 (0.2) 0.90
Mean (SD) cost per patient-year 2.9 (17.0) 2.6 (14.9) 1.4 (8.3) 0.59
Doctors outpatient consultations
Mean (SD) number of consultations 6.9 (0.5) 6.9 (0.8) 6.9 (1.0) 0.10
Mean (SD) cost per patient-year 24.0 (13.5) 27.5 (36.1) 25.6 (16.6) 0.99
Biological tests
Mean (SD) number of all lab tests 81.0 (7.0) 80.7 (11) 80.6 (11.6) 0.78
Mean (SD) cost per patient-year 352.8 (78.6) 399.2 (452.6) 366.1 (157.6) 0.90
Antiretroviral drugs (base-case analysisb)
Mean (SD) cost per patient-year 297.4 (63.4) 569.8 (114.3) 552.6 (88.3) < 0.0001
Burkina Fasoc 279.5 (6.5) 515.0 (50.9) 524.4 (44.5) < 0.0001
Cameroond 307.2 (75.1) 578.4 (126.8) 554.9 (100.1) < 0.0001
Senegale 275.4 (24.2) 607.5 (83.9) 586.2 (60.8) < 0.0001
Drugs for opportunistic infections
Mean (SD) number of drugs 4.7 (5.5) 4.7 (5.9) 3.8 (5.6) 0.12
Mean (SD) cost per patient-year 9.7 (21.4) 12.8 (36.1) 9.0 (22.0) 0.39
Total cost (base-case analysisb)
Mean (SD) cost per patient-year 686.9 (112.0) 1011.9 (502.8) 955.7 (209.5) < 0.0001
Burkina Fasoc 566.6 (41.1) 834.2 (137.7) 805.2 (40.6) < 0.0001
Cameroond 707.1 (105.1) 1046.6 (594.2) 966.6 (208.4) < 0.0001
Table 4 Quality-adjusted life-years (QALYs), costs (US dollars, 2016) and cost-effectiveness estimated over 24 months of follow-up (ANRS 12169 2LADY, n = 451) TDF/FTC LPV/r (arm A, n = 152) Mean (95% CI) ABC ddI LPV/r (arm B, n = 145) Mean (95% CI) TDF/FTC DRV/r (arm C, n = 154) Mean (95% CI) Difference or ICER ABC ddI LPV/r vs TDF/ FTC LPV/r Mean (95% CI) Difference or ICER TDF/FTC DRV/r vs TDF/ FTC LPV/r Mean (95% CI) Base-case analysis
ARV drugs prices observed during 2016a Total costs per patient (USD)
Burkina Fasof 1085 (1056–1104) 1496 (1367–1584) 1573 (1529–1604) 410 (280–505) 488 (439–532) Cameroong 1352 (1308–1396) 1884 (1804–1961) 1820 (1760–1873) 532 (441–621) 468 (395–538) Senegalh 1461 (1396–1511) 2183 (2103–2258) 2008 (1751–2216) 721 (626–819) 546 (283–764) QALYs per patientb
Burkina Fasof 1.098 (1.003–1.192) 1.119 (0.989–1.232) 1.126 (1.030–1.218) 0.021 (− 0.140 to 0.169) 0.028 (− 0.107 to 0.162) Cameroong 1.037 (0.978–1.095) 1.060 (1.000–1.117) 0.964 (0.909–1.020) 0.023 (− 0.060 to 0.106) − 0.073 (− 0.153 to 0.008) Senegalh 1.201 (1.078–1.309) 1.063 (0.920–1.207) 1.022 (0.853–1.177) − 0.138 (− 0.319 to 0.049) − 0.179 (− 0.381 to 0.018) ICER (∆Costs/∆QALYs)
Burkina Fasof ICER = 19,674* ICER = 17,693*
Cameroong ICER = 23,470* Arm A Dominantc*
Senegalh Arm A Dominantc* Arm A Dominantc*
Scenario 1 (2018 MSF prices of ARVd) Total costs per patient (USD)
Burkina Fasof 1036 (1008–1053) 1457 (1333–1542) 1503 (1462–1533) 421 (294–512) 468 (422–509) Cameroong 1247 (1209–1282) 1752 (1686–1807) 1698 (1645–1741) 505 (431–573) 451 (388–509) Senegalh 1403 (1338–1453) 1988 (1949–2026) 1806 (1576–1993) 585 (520–659) 402 (168–602) QALYs per patient
Burkina Fasof 1.098 (1.003–1.192) 1.119 (0.989–1.232) 1.126 (1.030–1.218) 0.021 (− 0.140 to 0.169) 0.028 (− 0.107 to 0.162) Cameroong 1.037 (0.978–1.095) 1.060 (1.000–1.117) 0.964 (0.909–1.020) 0.023 (− 0.060 to 0.106) − 0.073 (− 0.153 to 0.008) Senegalh 1.201 (1.078–1.309) 1.063 (0.920–1.207) 1.022 (0.853–1.177) − 0.138 (− 0.319 to 0.049) − 0.179 (− 0.381 to 0.018) ICER (∆Costs/∆QALYs)
Burkina Fasof ICER = 21,050* ICER = 17,682*
Cameroong ICER = 23,198* Arm A Dominantc*
Senegalh Arm A Dominantc* Arm A Dominantc*
Scenario 2 (LYS)
Total costs per patient (USD)
Burkina Fasof 1085 (1056–1104) 1496 (1367–1584) 1573 (1529–1604) 410 (280–504) 488 (439–532) Cameroong 1352 (1308–1396) 1884 (1804–1961) 1820 (1760–1873) 532 (441–621) 468 (395–538) Senegalh 1461 (1396–1511) 2183 (2103–2258) 2008 (1751–2216) 721 (626–819) 546 (283–764) LYS per patient
Burkina Fasof 1.898 (1.820–1.944) 1.823 (1.657–1.930) 1.921 (1.888–1.939) − 0.075 (− 0.249 to 0.064) 0.023 (− 0.038 to 0.107) Cameroong 1.882 (1.825–1.928) 1.892 (1.823–1.946) 1.901 (1.842–1.945) 0.009 (− 0.073 to 0.088) 0.018 (− 0.058 to 0.093) Senegalh 1.908 (1.802–1.968) 1.956 (1.935–1.971) 1.791 (1.551–1.959) 0.048 (− 0.020 to 0.159) − 0.117 (− 0.361 to 0.092) ICER (∆Costs/∆LYS)
Burkina Fasof Arm A Dominantc* ICER = 21,048*
Cameroong ICER = 56,450* ICER = 25,729*
Senegalh ICER = 15,018* Arm A Dominantc*
Scenario 3 (QALYse) Total costs per patient (USD)
Burkina Fasof 1085 (1056–1104) 1496 (1367–1584) 1573 (1529–1604) 410 (280–505) 488 (439–532) Cameroong 1352 (1308–1396) 1884 (1804–1961) 1820 (1760–1873) 532 (441–621) 468 (395–538) Senegalh 1461 (1396–1511) 2183 (2103–2258) 2008 (1751–2216) 721 (626–819) 546 (283–764)
ABC ddI LPV/r abacavir + didanosine + lopinavir/ritonavir, ARV antiretroviral drugs, CI confidence interval, ICER incremental cost-effectiveness ratio, LYS life-year saved, MSF Médecins Sans Frontières, QALYs quality-adjusted life-years, TDF/FTC DRV/r tenofovir/emtricitabine + daruna-vir/ritonavir, TDF/FTC LPV/r tenofovir/emtricitabine + lopinadaruna-vir/ritonavir, USD United States dollars, ∆ difference
*The probability of arm A being cost-effective at one times the country’s per capita gross domestic product is 100% a Unit prices of antiretroviral drugs for the year 2016 (obtained from the WHO Global Price Reporting Mechanism database) b Estimates of utilities were obtained from the DART trial [16]
c Dominance means significant lower costs and higher QALYs
d Unit prices of antiretroviral drugs for the year 2018 (obtained from the Médecins Sans Frontières report [30] e Estimates of utilities were obtained from Tengs and Lin [31]
f n = 90 (30 in arm A, 28 in arm B and 32 in arm C) g n = 302 (101 in arm A, 99 in arm B and 102 in arm C) h n = 59 (21 in arm A, 18 in arm B and 20 in arm C)
Table 4 (continued) TDF/FTC LPV/r (arm A, n = 152) Mean (95% CI) ABC ddI LPV/r (arm B, n = 145) Mean (95% CI) TDF/FTC DRV/r (arm C, n = 154) Mean (95% CI) Difference or ICER ABC ddI LPV/r vs TDF/ FTC LPV/r Mean (95% CI) Difference or ICER TDF/FTC DRV/r vs TDF/ FTC LPV/r Mean (95% CI) QALYs per patient
Burkina Fasof 1.611 (1.534–1.678) 1.581 (1.428–1.692) 1.632 (1.571–1.688) − 0.030 (− 0.196 to 0.108) 0.021 (− 0.070 to 0.117) Cameroong 1.564 (1.508–1.613) 1.584 (1.521–1636) 1.534 (1.480–1.582) 0.020 (− 0.059 to 0.097) − 0.030 (− 0.103 to 0.044) Senegalh 1.670 (1.556–1.753) 1.613 (1.525–1.699) 1.511 (1.301–1.675) − 0.057 (− 0.182 to 0.084) − 0.159 (− 0.386 to 0.041) ICER (∆Costs/∆QALYs)
Burkina Fasof Arm A Dominantc* ICER = 23,358*
Cameroong ICER = 26,716* Arm A Dominantc*
Senegalh Arm A Dominantc* Arm A Dominantc*
Scenario 4a (discount rate of 0%)
Total costs per patient (USD)
Burkina Fasof 1100 (1069–1119) 1516 (1386–1607) 1596 (1551–1628) 417 (284–513) 496 (447–541) Cameroong 1369 (1324–1415) 1911 (1829–1989) 1846 (1785–1900) 542 (449–632) 477 (402–548) Senegalh 1479 (1412–1531) 2214 (2131–2290) 2035 (1773–2248) 735 (636–834) 556 (288–781) QALYs per patient
Burkina Fasof 1.118 (1.020–1.214) 1.139 (1.005–1.254) 1.146 (1.048–1.239) 0.0214 (− 0.143 to 0.174) 0.0282 (− 0.110 to 0.164) Cameroong 1.056 (0.995–1.115) 1.079 (1.019–1.138) 0.981 (0.925–1.038) 0.0236 (− 0.061 to 0.109) − 0.0743 (− 0.156 to 0.008) Senegalh 1.223 (1.098–1.333) 1.082 (0.937–1.227) 1.040 (0.867–1.198) − 0.1409 (− 0.324 to 0.051) − 0.1826 (− 0.390 to 0.020) ICER (∆Costs/∆QALYs)
Burkina Fasof ICER = 19,465* ICER = 17,615*
Cameroong ICER = 22,963* Arm A Dominantc*
Senegalh Arm A Dominantc* Arm A Dominantc*
Scenario 4b (discount rate of 6%)
Total costs per patient (USD)
Burkina Fasof 1076 (1047–1094) 1482 (1354–1569) 1558 (1515–1589) 406 (275–499) 482 (434–526) Cameroong 1340 (1297–1384) 1866 (1787–1942) 1803 (1744–1855) 526 (436–613) 463 (390–531) Senegalh 1449 (1386–1498) 2162 (2082–2236) 1989 (1735–2197) 713 (617–809) 540 (278–755) QALYs per patient
Burkina Fasof 1.085 (0.991–1.178) 1.106 (0.976–1.217) 1.113 (1.018–1.203) 0.0205 (− 0.139 to 0.168) 0.0272 (− 0.105 to 0.157) Cameroong 1.025 (0.966–1.082) 1.047 (0.988–1.104) 0.952 (0.898–1.007) 0.0221 (− 0.059 to 0.105) − 0.0723 (− 0.151 to 0.008) Senegalh 1.186 (1.066–1.294) 1.050 (0.910–1.193) 1.009 (0.843–1.164) − 0.1364 (− 0.317 to 0.050) − 0.1767 (− 0.376 to 0.018) ICER (∆Costs/∆QALYs)
Burkina Fasof ICER = 19,823* ICER = 17,750*
Cameroong ICER = 23,834* Arm A Dominantc*
in terms of neuropathy), more complicated schedule and lack of advantages in terms of efficacy of the combination with ABC ddI, argue for its elimination from WHO recom-mendations [8]. With regard to costs, TDF/FTC LPV/r was significantly less costly than the other two strategies. When considering ARV prices observed during 2015–2016, TDF/ FTC LPV/r saved between US$410 (in Burkina Faso) and US$721 (in Senegal) per patient over 24 M, compared with the ABC ddI LPV/r regimen, and US$468 (in Cameroon)
to US$546 (in Senegal) over the same period compared with the DRV/r-based regimen. These cost differences were driven by the lower cost of ARV in the TDF/FTC LPV/r regimen compared with the two other regimens, due to lower monthly prices both of the two NRTI drugs (TDF/FTC vs ABC ddI) and of the bPI (LPV/r vs DRV/r). The largest cost differences were in Senegal as ARV prices were rela-tively higher there than in the two other countries, especially for ABC ddI and DRV/r. When considering ARV prices in
Fig. 1 Cost-effectiveness acceptability curves of TDF/FTC LPV/r compared with ABC ddI LPV/r (a) and compared with TDF/FTC DRV/r (b) in the ANRS 12169 2LADY trial. The coloured vertical lines indicate the cost-effectiveness thresholds of 1 times the GDP/ capita in 2016 for each of the three study countries (i.e. US$584 in Burkina Faso, US$1392 in Cameroon and US$1231 in Senegal). The cost-effectiveness acceptability curves show the probability that TDF/ FTC LPV/r is cost-effective compared with ABC ddI LPV/r (a) and with TDF/FTC DRV/r (b) in each of the three study countries over a
range of values for the cost-effectiveness threshold λ (i.e. the maxi-mum amount that the decision maker is willing to pay for one unit of health). ABC ddI LPV/r abacavir + didanosine + lopinavir/ritona-vir, Prob(TDF/FTC LPV/r CE) probability of TDF/FTC LPV/r being cost-effective at one times the country’s per-capita gross domestic product, QALYs quality-adjusted life-years, TDF/FTC DRV/r teno-fovir/emtricitabine + darunavir/ritonavir, TDF/FTC LPV/r tenofovir/ emtricitabine + lopinavir/ritonavir
Table 5 Extrapolation to 5 years of quality-adjusted life-years (QALYs), costs (US dollars, 2016) and cost-effectiveness (ANRS 12169 2LADY, n = 451) TDF/FTC LPV/r (arm A, n = 152) Mean (95% CI) ABC ddI LPV/r (arm B, n = 145) Mean (95% CI) TDF/FTC DRV/r (arm C, n = 154) Mean (95% CI) Difference or ICER ABC ddI LPV/r vs TDF/ FTC LPV/r Mean (95% CI) Difference or ICER TDF/FTC DRV/r vs TDF/ FTC LPV/r Mean (95% CI)
Base-case over 5 yearsa Total costs per patient (USD)
Burkina Fasof 2185 (2040–2282) 3113 (2772–3384) 3369 (3209–3462) 928 (566–1232) 1184 (985–1367) Cameroong 2674 (2553–2795) 3946 (3763–4115) 3786 (3631–3926) 1271 (1055–1482) 1112 (917–1300) Senegalh 2804 (2548–2988) 4303 (3893–4638) 4049 (3411–4567) 1499 (1044–1921) 1245 (580–1813) QALYs per patientb
Burkina Fasof 2.759 (2.494–2.989) 2.679 (2.338–2.972) 2.781 (2.547–2.990) − 0.079 (− 0.494 to 0.317) 0.022 (− 0.311 to 0.359) Cameroong 2.582 (2.419–2.736) 2.719 (2.576–2.850) 2.508 (2.363–2.646) 0.137 (− 0.071 to 0.349) − 0.073 (− 0.283 to 0.141) Senegalh 2.879 (2.520–3.166) 2.655 (2.257–3.008) 2.464 (2.015–2.860) − 0.224 (− 0.722 to 0.283) − 0.415 (− 0.961 to 0.122) ICER (∆Costs/∆QALYs)
Burkina Fasof Arm A Dominantc* ICER = 53,354*
Cameroong ICER = 9273* Arm A Dominantc*
Senegalh Arm A Dominantc* Arm A Dominantc*
Scenario 1 (2018 MSF prices of ARVd) Total costs per patient (USD)
Burkina Fasof 2072 (1935–2163) 3025 (2695–3288) 3208 (3056–3296) 953 (603–1245) 1136 (947–1309) Cameroong 2425 (2324–2517) 3652 (3503–3775) 3500 (3364–3615) 1227 (1053–1389) 1075 (912–1231) Senegalh 2667 (2426–2843) 3867 (3535–4117) 3577 (3019–4028) 1200 (820–1551) 910 (322–1413) QALYs per patient
Burkina Fasof 2.759 (2.494–2.989) 2.679 (2.338–2.972) 2.781 (2.547–2.990) − 0.079 (− 0.494 to 0.317) 0.022 (− 0.311 to 0.359) Cameroong 2.582 (2.419–2.736) 2.719 (2.576–2.850) 2.508 (2.363–2.646) 0.137 (− 0.071 to 0.349) − 0.073 (− 0.283 to 0.141) Senegalh 2.879 (2.520–3.166) 2.655 (2.257–3.008) 2.464 (2.015–2.860) − 0.224 (− 0.722 to 0.283) − 0.415 (− 0.961 to 0.122) ICER (∆Costs/∆QALYs)
Burkina Fasof Arm A Dominantc* ICER = 53,276*
Cameroong ICER = 9318* Arm A Dominantc*
Senegalh Arm A Dominantc* Arm A Dominantc*
Scenario 2 (LYS)
Total costs per patient (USD)
Burkina Fasof 2185 (2040–2282) 3113 (2772–3384) 3369 (3209–3462) 928 (566–1232) 1184 (985–1367) Cameroong 2674 (2553–2795) 3946 (3763–4115) 3786 (3631–3926) 1271 (1055–1482) 1112 (917–1300) Senegalh 2804 (2548–2988) 4303 (3893–4638) 4049 (3411–4567) 1499 (1044–1921) 1245 (580–1813) LYS per patient
Burkina Fasof 4.322 (3.985–4.546) 4.137 (3.672–4.520) 4.429 (4.225–4.540) − 0.185 (− 0.721 to 0.309) 0.106 (− 0.214 to 0.468) Cameroong 4.267 (4.075–4.436) 4.357 (4.181–4.494) 4.313 (4.138–4.457) 0.090 (− 0.151 to 0.334) 0.045 (− 0.195 to 0.291) Senegalh 4.248 (3.778–4.561) 4.320 (3.975–4.559) 3.998 (3.347–4.546) 0.072 (− 0.412 to 0.606) − 0.249 (− 0.991 to 0.444) ICER (∆Costs/∆LYS)
Burkina Fasof Arm A Dominantc* ICER = 11,147*
Cameroong ICER = 14,150* ICER = 24,544*
Senegalh ICER = 20,778* Arm A Dominantc*
Scenario 3 (QALYse) Total costs per patient (USD)
Burkina Fasof 2185 (2040–2282) 3113 (2772–3384) 3369 (3209–3462) 928 (566–1232) 1184 (985–1367) Cameroong 2674 (2553–2795) 3946 (3763–4115) 3786 (3631–3926) 1271 (1055–1482) 1112 (917–1300) Senegalh 2804 (2548–2988) 4303 (3893–4638) 4049 (3411–4567) 1499 (1044–1921) 1245 (580–1813)
ABC ddI LPV/r abacavir + didanosine + lopinavir/ritonavir, ARV antiretroviral drugs, CI confidence interval, ICER incremental cost-effectiveness ratio, LYS life-year saved, MSF Médecins Sans Frontières, QALYs quality-adjusted life-years, TDF/FTC DRV/r tenofovir/emtricitabine + daruna-vir/ritonavir, TDF/FTC LPV/r tenofovir/emtricitabine + lopinadaruna-vir/ritonavir, USD United States dollars, ∆ difference
*The probability of arm A being cost-effective at one times the country’s per capita gross domestic product is 100% a Unit prices of antiretroviral drugs for the year 2016 (obtained from the WHO Global Price Reporting Mechanism database) b Estimates of utilities were obtained from the DART trial [16]
c Dominance means lower costs and higher QALYs
d Unit prices of antiretroviral drugs for the year 2018 (obtained from the Médecins Sans Frontières report [30] e Estimates of utilities were obtained from Tengs and Lin [31]
f n = 90 (30 in arm A, 28 in arm B and 32 in arm C) g n = 302 (101 in arm A, 99 in arm B and 102 in arm C) h n = 59 (21 in arm A, 18 in arm B and 20 in arm C)
Table 5 (continued) TDF/FTC LPV/r (arm A, n = 152) Mean (95% CI) ABC ddI LPV/r (arm B, n = 145) Mean (95% CI) TDF/FTC DRV/r (arm C, n = 154) Mean (95% CI) Difference or ICER ABC ddI LPV/r vs TDF/ FTC LPV/r Mean (95% CI) Difference or ICER TDF/FTC DRV/r vs TDF/ FTC LPV/r Mean (95% CI) QALYs per patient
Burkina Fasof 3.803 (3.499–4.032) 3.660 (3.240–3.998) 3.871 (3.654–4.026) − 0.142 (− 0.634 to 0.310) 0.068 (− 0.253 to 0.415) Cameroong 3.670 (3.492–3.829) 3.797 (3.636–3.930) 3.663 (3.502–3.803) 0.127 (− 0.097 to 0.354) − 0.007 (− 0.233 to 0.225) Senegalh 3.817 (3.391–4.134) 3.730 (3.346–4.037) 3.472 (2.895–3.939) − 0.086 (− 0.593 to 0.444) − 0.344 (− 1.0.18 to 0.290) ICER (∆Costs/∆QALYs)
Burkina Fasof Arm A Dominantc* ICER = 17,398*
Cameroong ICER = 10,011* Arm A Dominantc*
Senegalh Arm A Dominantc* Arm A Dominantc*
Scenario 4a (discount rate of 0%)
Total costs per patient (USD)
Burkina Fasof 2317 (2158–2423) 3305 (2938–3598) 3582 (3409–3683) 988 (598–1318) 1265 (1048–1465) Cameroong 2834 (2702–2965) 4193 (3997–4374) 4023 (3856–4174) 1359 (1126–1585) 1189 (978–1393) Senegalh 2969 (2688–3170) 4562 (4110–4929) 4296 (3610–4855) 1593 (1092–2055) 1327 (609–1938) QALYs per patient
Burkina Fasof 2.954 (2.666–3.202) 2.862 (2.494–3.177) 2.974 (2.723–3.198) − 0.092 (− 0.539 to 0.337) 0.020 (− 0.338 to 0.384) Cameroong 2.764 (2.588–2.930) 2.915 (2.761–3.056) 2.690 (2.533–2.838) 0.150 (− 0.074 to 0.378) − 0.075 (− 0.301 to 0.156) Senegalh 3.079 (2.688–3.391) 2.843 (2.412–3.222) 2.636 (2.152–3.063) − 0.237 (− 0.778 to 0.312) − 0.444 (− 1.034 to 0.137) ICER (∆Costs/∆QALYs)
Burkina Fasof Arm A Dominantc* ICER = 62,198*
Cameroong ICER = 9047* Arm A Dominantc*
Senegalh Arm A Dominantc* Arm A Dominantc*
Scenario 4b (discount rate of 6%)
Total costs per patient (USD)
Burkina Fasof 2101 (1964–2192) 2991 (2666–3248) 3233 (3082–3322) 890 (547–1178) 1133 (945–1305) Cameroong 2572 (2457–2687) 3788 (3614–3949) 3638 (3491–3770) 1216 (1009–1416) 1065 (880–1243) Senegalh 2699 (2459–2873) 4138 (3754–4452) 3888 (3281–4379) 1439 (1012–1834) 1189 (556–1726) QALYs per patient
Burkina Fasof 2.634 (2.384–2.853) 2.563 (2.238–2.840) 2.657 (2.434–2.857) − 0.071 (− 0.466 to 0.304) 0.023 (− 0.294 to 0.344) Cameroong 2.466 (2.311–2.612) 2.594 (2.458–2.720) 2.393 (2.255–2.524) 0.129 (− 0.0689 to 0.330) − 0.073 (− 0.272 to 0.131) Senegalh 2.751 (2.411–3.022) 2.535 (2.158–2.871) 2.355 (1.929–2.731) − 0.216 (− 0.687 to 0.264) − 0.396 (− 0.914 to 0.112) ICER (∆Costs/∆QALYs)
Burkina Fasof Arm A Dominantc* ICER = 48,690*
Cameroong ICER = 9439* Arm A Dominantc*
2018, cost differences between the three second-line regi-mens were similar, except for Senegal where we observed a significant decrease. Indeed, the prices of ABC ddI and DRV/r drugs there were higher than those reported by MSF for LMIC in 2018. This was not the case in Burkina Faso or Cameroon where ARV prices observed in 2016 were com-parable with those of MSF.
A number of studies have been conducted in high-income settings on the cost-effectiveness of LPV/r-based regimens used either in first-line, second-line or simplified (mono and dual) therapy [32–34]. Although they com-pared LPV/r with alternative regimens to ours, all showed that LPV/r-based regimens may result in cost-saving and yet deliver similar clinical outcomes. In LMIC, one study has assessed the costs of second-line treatments and found an average yearly cost of US$1037 per patient, which is comparable with our estimations of US$687–1012 per patient-year [35]. Another study that compared the cost-effectiveness of a simplified second-line therapy using lopinavir/ritonavir + raltegravir with LPV/r + 2NRTIs concluded that this novel strategy could be cost-effective for upper-middle income countries but not for LMIC like Nigeria [14].
The 2018 updated WHO guidelines recommend the use of DTG in combination with a two-NRTI backbone as the second-line option for PLHIV with first-line virological fail-ure on efavirenz- or nevirapine-based regimens [5]. Indeed, recent evidence provided by the DAWNING trial showed that DTG-based regimens were superior to LPV/r-based regimens, virological success (VL < 50 copies/mL) being achieved in 78% vs 69% of participants with first-line failure [36]. Despite the benefits of DTG, its use in second-line therapy in LMIC raises some concerns [37, 38]. In particu-lar, DTG-based regimens are not currently recommended for women of reproductive age due to potentially higher risk of neural tube defects in children born to women who initiated DTG before conception [39]. A recent modelling study sug-gests, however, that the risk associated with DTG exposure to foetuses is outweighed by the reduction in mother-to-child HIV transmission due to the higher probability of viral sup-pression with this regimen [40]. Furthermore, thanks to a recent pricing agreement, a generic fixed-dose combina-tion of TDF/3TC/DTG will be provided in LMIC at a cost of approximately US$75 per person per year [41]. At this price, this regimen should be very cost-effective compared with LPV/r-based regimens, which are currently almost six times more expensive. While DTG-based regimens should provide greater economic value than LPV/r-based regimens, alternative bPI-based second-line therapies are still needed in LMIC, especially for patients who will receive DTG in first-line treatment.
This study has limitations. First, QALYs were estimated in the base-case analysis using utility estimates derived
from the literature, as data were not available in the trial or post-trial data [16, 31]. The utility values used in the base-case analysis were estimated using preference-based methods from a large sample of patients within the DART (Development of Anti-Retroviral Therapy in Africa) trial in Uganda [16]. In scenario analysis, we also considered an alternative source of data, specifically a meta-analysis pool-ing data from studies conducted in high-income countries [31]. QALYs per patient were still not significantly different between arms, and consequently, TDF/FTC LPV/r remained the optimal second-line therapy. Second, the structure of the simulated patient-level Markov model and the defini-tion of heath states were constrained by the size of the study population, which was too small to consider a larger number of health states. In particular, we were not able to consider an additional health state for patients with CD4 < 50 cells/ mL or define health states by combining CD4 cell count and VL as the model did not converge due to an insuffi-cient number of transitions observed. However, the effect of virological failure on disease progression was taken into account through the introduction of this variable in the model used to estimate transition probabilities. In addition, our model does not account for HIV transmission. Although we recognise that dynamic models are the most suitable to assess long-term public health impacts in the field of HIV, we believe that for our study purpose, such a model was not indispensable as the alternative regimens considered in the analysis offered very similar benefits, including benefits in terms of virological suppression. Not taking into account HIV transmission may have led to an underestimation of health benefits for each strategy, but it is unlikely to have biased our cost-effectiveness results as a similar number of HIV transmissions are expected to occur in the three alterna-tive second-line regimens assessed. Finally, our study was conducted using data collected in a trial setting, which may limit the generalisability of the results. Nevertheless, this study included PLHIV followed in the largest HIV treatment centres of the three study countries. It is therefore likely that the trial population reflected patients switching to second-line treatment in real-life contexts where viral load monitor-ing and genotypmonitor-ing are generally not available [8].
5 Conclusion
Despite the recent changes to WHO guidelines, our findings remain relevant considering the need for bPI-based second-line combinations as alternatives to DTG-based regimens. We showed that despite their clinical similarities, the choice of the bPI-based second-line ART combinations will have different economic consequences because of large differ-ences in the monthly costs of ARV. As ARV costs are the
main driver of HIV healthcare costs over the long term, it is essential that decision makers give priority to regimens that provide the best economic value. Our findings showed that at recent ARV prices, using TDF/FTC LPV/r as a bPI-based second-line regimen may be the most efficient use of resources in LMIC, supporting the choices made by WHO in its 2018 guidelines.
Acknowledgements We thank the ANRS 12169 2LADY trial
partici-pants and their partners, families, and caregivers, as well as the staff of all the participating sites. Our thanks also to the ANRS (Agence Nationale de Recherche sur le SIDA) for its support, to Gwenaëlle Maradan for its monitoring of the economic data collection and to Jude Sweeney for the English revision and editing of the manuscript.
Members of the ANRS 12169 2LADY Study Group
Protocol Steering Committee: E. Delaporte, S. Koulla-Shiro, C.T. Ndour, A. Sawadogo, V. Le Moing, J. Reynes, A. Calmy, L. Ciaffi, P.M. Girard, S. Eholie, M.L. Chaix, C. Kouanfack, I. Tita, B. Bazin, P. Garcia, J.B. Guiard-Schmid. Project Team: V. Le Moing, S. Izard, S. Eymard-Duvernay, L. Ciaffi, M. Peeters, L. Serrano, A. Cournil, I. Diallo, E. Delaporte. Site Investigators: J.M. Mben, R. Toby, N. Manga, L. Ayangma, B. Taman, F.N. Kabore, E. Kamboule, J. Zoungrana, A. Diouf, M. Diallo, L. Fortes, N.F. Ngom Gueye, G. Batista.
Site Staff: A. Aghokeng, E. Guichet, H. Abessolo, C. Essomba, G. Manirakiza, F. Essomba, T. Mbarga, S. Epanda, A. Bikie, T. Nke, N. Massaha, E. Nke, M. Ngolle, D. Bikobo, L. Abologo, O. Elat, G. Laborde-Balen, A. Diouf, A. Diop, B. Diouf, N. Bara, M.B. Koita Fall, C. Toure Kane, F.B. Seck, S. Ba, P. Njantou, A. Ndyaye, A. Hema, P. Fao, P. Ouedrago, R. Traore, Y. Sanou, G. Bado, M. Coulibaly, E. Some, J. Some, A. Kambou, A. Tapsoba, D. Sombie, S. Sanou, B. Traore. Data and Safety Monitoring Board: P. Flandre, C. Michon, J. Drabo, F. Simon.
Author Contributions ED, SK-S and LC contributed to the conception and design of the ANRS 12169 2LADY trial and overviewed the trial implementation. CK, AS, RT, MPM-E and NFNG participated in the clinical follow-up of the participants and were responsible for clinical data collection. SB designed the health economic study and overviewed the economic study. LM and MLN built the costing database. MLN performed the economic analysis, prepared figures and tables and par-ticipated in the interpretation of the data. SB and LS-T supervised the data analysis. The manuscript was drafted by SB. All authors contrib-uted to the interpretation of the data, revised the article critically for important intellectual content, and approved the final version of the manuscript for submission.
The corresponding author had full access to all the data in the study and had final responsibility for the decision to submit for publication.
Data Availability The datasets generated and analysed during the cur-rent study as well as the model underpinning our research are available from the corresponding author on reasonable request.
Compliance with Ethical Standards
Ethics committee The participating countries’ national Ethic
Commit-tees approved the protocol for the economic evaluation study and the protocol of the trial. In addition, the trial protocol was approved by the institutional Ethics Committee of the Institut de Recherche pour le Développement (IRD) in France. All participants provided writ-ten informed consent. The study was conducted in accordance with the Declaration of Helsinki and the Good Clinical Practice Guide-lines. The trial is registered with ClinicalTrial.gov with the number NCT00928187.
Conflict of interest L.C, S.K-S and A.S report grants from ANRS with financial support by Janssen Pharmaceuticals. E.D, C.K, R.T, N.F.N.G, S.B, L.M, M.L.N, L.S-T, M.A.B, M.P.M-E and B.S report no conflict of interest in relation to this study.
Source of support This work was supported by the Agence National de Recherche sur le SIDA—Inserm ANRS (Grant number 12231). The trial was sponsored by Agence National de Recherche sur le SIDA— Inserm ANRS (Grant number 12169) and by European and Devel-oping Countries Clinical Trials Partnership (EDCTP) (Grant number IP.2007.33011.004). Gilead Sciences and Janssen provided study drugs, the latter partially funding the study. Neither firm had any role in the study design, data collection, data analysis, data interpretation or writing of the report.
Open Access This article is distributed under the terms of the Crea-tive Commons Attribution-NonCommercial 4.0 International License (http://creativecommons.org/licenses/by-nc/4.0/), which permits any noncommercial use, distribution, and reproduction in any medium, provided you give appropriate credit to the original author(s) and the source, provide a link to the Creative Commons license, and indicate if changes were made.
References
1. World Health Organization. WHO HIV update: global epi-demic, progress in scale up and policy uptake [Internet]; 2018.
http://www.who.int/hiv/data/2017_globa l_summa ry_web_v11. pptx?ua=1. Accessed 23 Oct 2018.
2. World Health Organization, Habiyambere V. WHO global ARVs and diagnostic use survey in 2015 in low and middle-income countries [Internet]; 2016. http://www.who.int/hiv/amds/amds2 016-ppt-WHO-2015A RVUse Surve y.pdf. Accessed 23 Oct 2018. 3. Onoya D, Nattey C, Budgell E, van den Berg L, Maskew M,
Evans D, et al. Predicting the need for third-line antiretroviral therapy by identifying patients at high risk for failing second-line antiretroviral therapy in South Africa. AIDS Patient Care STDs. 2017;31:205–12.
4. Consolidated guidelines on the use of antiretroviral drugs for treating and preventing HIV infection: recommendations for a public health approach [Internet]; 2016. http://www.desli bris.ca/ ID/10089 566. Accessed 11 Sept 2018.
5. World Health Organization, Haile-Selassie H, World Health Organization, Department of HIV/AIDS, Centers for Disease Control and Prevention (U.S.), Global Fund to Fight AIDS T and Malaria, et al. WHO HIV drug resistance report 2017 [Internet]; 2017. http://apps.who.int/iris/bitst ream/10665 /25589 6/1/97892 41512 831-eng.pdf. Accessed 11 Sept 2018.
6. Murphy RA, Court R, Maartens G, Sunpath H. Second-line antiretroviral therapy in Sub-Saharan Africa: it is time to mind the gaps. AIDS Res Hum Retroviruses. 2017;33:1181–4. 7. World Health Organization, Hampton SG. Updated
recommenda-tions on first-line and second-line antiretroviral regimens and post-exposure prophylaxis and recommendations on early infant diag-nosis of HIV [Internet]; 2018. http://apps.who.int/iris/bitst ream/ handl e/10665 /27363 2/WHO-CDS-HIV-18.18-eng.pdf?ua=1. Accessed 5 Oct 2018.
8. Ciaffi L, Koulla-Shiro S, Sawadogo A, le Moing V, Eymard-Duvernay S, Izard S, et al. Efficacy and safety of three second-line antiretroviral regimens in HIV-infected patients in Africa. AIDS Lond Engl. 2015;29:1473–81.