Publisher’s version / Version de l'éditeur:
Proceedings 18th International Symposium on Ice, IAHR'06, 2, pp. 193-200, 2006
READ THESE TERMS AND CONDITIONS CAREFULLY BEFORE USING THIS WEBSITE. https://nrc-publications.canada.ca/eng/copyright
Vous avez des questions? Nous pouvons vous aider. Pour communiquer directement avec un auteur, consultez la première page de la revue dans laquelle son article a été publié afin de trouver ses coordonnées. Si vous n’arrivez pas à les repérer, communiquez avec nous à [email protected].
Questions? Contact the NRC Publications Archive team at
[email protected]. If you wish to email the authors directly, please see the first page of the publication for their contact information.
NRC Publications Archive
Archives des publications du CNRC
This publication could be one of several versions: author’s original, accepted manuscript or the publisher’s version. / La version de cette publication peut être l’une des suivantes : la version prépublication de l’auteur, la version acceptée du manuscrit ou la version de l’éditeur.
Access and use of this website and the material on it are subject to the Terms and Conditions set forth at
Introducing the Shear-Cap Material Criterion to an Ice Rubble Load
Model
ElSeify, Mohamed O.; Brown, Thomas G.
https://publications-cnrc.canada.ca/fra/droits
L’accès à ce site Web et l’utilisation de son contenu sont assujettis aux conditions présentées dans le site LISEZ CES CONDITIONS ATTENTIVEMENT AVANT D’UTILISER CE SITE WEB.
NRC Publications Record / Notice d'Archives des publications de CNRC: https://nrc-publications.canada.ca/eng/view/object/?id=4d0dd4cc-2dde-421f-9dbb-3d3055b23052 https://publications-cnrc.canada.ca/fra/voir/objet/?id=4d0dd4cc-2dde-421f-9dbb-3d3055b23052
Reprinted from:
Proceedings 18th International Symposium on Ice, IAHR’06 Vol.2, pp 193-200, Sapporo, Japan, 2006.
INTRODUCING THE SHEAR-CAP MATERIAL CRITERION TO AN
ICE RUBBLE LOAD MODEL
Mohamed O. ElSeify and Thomas G. Brown University of Calgary, Calgary, Canada
ABSTRACT
Current ice rubble load models are based on a cohesive-frictional stress criterion, of which the Mohr-Coulomb (MC) and Drucker-Prager (DP) models are the most widely used. Combining these failure criteria with a shear-cap model as a new material model provides limits to the behaviour of rubble in both deviatoric and hydrostatic stress states. This concept adds a cap yield surface to the DP shear yield criterion bounding the yield surface in hydrostatic compression. The cap yield surface controls the dilatation process by including a volumetric hardening parameter. A detailed parametric analysis has been done to investigate the range of the shear-cap model’s parameter values that provide valid results. These parameters have been calibrated to implement the shear-cap material criterion into an analytical load model. This analytical load model calculates the load of interaction between first year ice ridge keels and conical structures. Existing models significantly over-predict the recorded loads measured at the Confederation Bridge Pier (P31). As a result, one of the aims of the newly developed load model is to give calculated load values which correlate well with the Confederation Bridge recorded loads. Comparison has been made between the calculated pressures using the new model and the recorded pressure given by the Confederation Bridge Monitoring Program (Brown, 2006). The comparison showed promising correlation between the calculated and recorded pressures.
INTRODUCTION
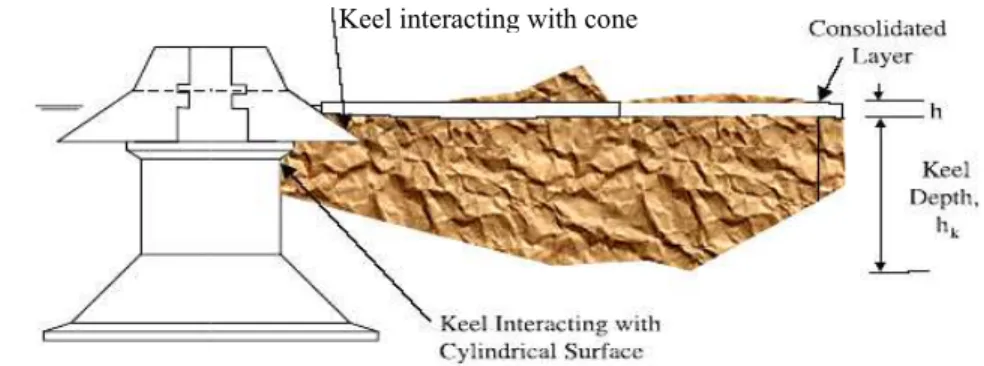
Canada has large sea areas that are ice covered in winter. Many different ice features result from the subsequent deformation of this ice cover. Most of Canada’s ice regime is marginal first year ice that includes extensive rubble fields and first year ridges. The interaction load between first year ice ridges and offshore structures (Figure 1) represents the critical design load in most of the Canadian sea areas that are ice covered in the winter. Engineers in Canada continue to face problems while designing conical offshore structures having the same geometry as the Confederation Bridge Pier interacting with first year ice ridges. This is due to the lack of an efficient and accurate model that can determine the loads resulting from the interaction of keel ice rubble with conical offshore structures. One of the most important reasons for the lack of an accurate model is the material stress criterion used for the ice rubble.
The paper has two main aims. First, investigate the capability of a new ice rubble strength algorithm to model the ice rubble behaviour interacting with conical offshore structures such as the Confederation Bridge Pier, and to show that the algorithm can be used, after calibration of the material parameters, to calculate the pressure resulting from the interaction of keel
rubble and conical offshore structures. Second, perform sensitivity and parametric analyses to investigate the material parameters that have the most influence on the load value.
Figure1.Interaction between First Year ridge and a Confederation Bridge Pier
LIMITATIONS OF THE MOHR-COULOMB STRESS CRITERION
Most of the analytical models that define the failure of keel ice rubble and calculate the loads caused by keel rubble on structures are based on cohesive-frictional stress criteria. The most frequently used cohesive-frictional stress criteria are the Mohr-Coulomb (MC) and Drucker-Prager (DP) models. The most obvious limitation in these models is their inability to simulate keel rubble volumetric changes accurately. First, the dilatation behaviour of ice rubble is unbounded and the material expands continually as plastic deformations continue. In addition, the dilatation during shear failure increases with higher friction angles. Second, the MC and the DP models do not simulate the keel rubble compaction behaviour resulting from the hydrostatic compression. As a result, another yield criterion that simulates the volumetric changes that take place in the keel rubble interacting with conical offshore structures must be considered.
SHEAR-CAP CRITERION
The main concept of the shear-cap model is to add a cap yield surface to the DP shear criterion. This cap yield surface bounds the yield surface in hydrostatic compression so it controls the dilatation process by including a volumetric hardening control parameter. The DP model is a smooth approximation of the MC criterion, which enables it to be used in the shear–cap model, allowing a smooth transition between the two components of the failure model. The great advantage of the shear-cap model over the MC and DP models is that it gives the material the ability to fail in compaction as well as in shear. According to Heinonen (2004), a smooth yield function is created by combining two elliptical yield surfaces together as shown in Figure 2, one for the shear failure, and one for the cap failure describing the compaction failure.
Figure 2. Shear-Cap Yield Function in the Meridian Plane (Heinonen, 2004) Keel interacting with cone
It can be observed that the volumetric component of the yield surface gradient results in expansion in the shear failure region and compaction in the cap part. So, this material model more closely models the keel rubble volumetric change behaviour by bounding the dilatation behaviour that accompanies the shear and, beyond the hydrostatic pressure pa the volumetric
change will be compaction.
The yield function for the cap failure is:
(
)
[
a]
a a s p p q d p p p f = − tanβ 2+ 2 −( + tanβ) ; ≤ (1) a a a c p p Rq R d p p p f = ( − )2+( )2 − ( + tanβ) ; > (2) where pb (Hydrostatic pressure strength) represents the cap hardening law as follows:(
)
⎟ ⎟ ⎠ ⎞ ⎜ ⎜ ⎝ ⎛− − = 0 0 0exp κ ε ε p vol p vol b p p (3)and pa defines the pressure that divides the shear-cap yield surface into two parts:
β tan 1 R Rd p p b a + − = (4) Where:
d: Cohesion parameter in DP model, β : Internal friction angle in DP model, R: Defines the cap shape, q: Second invariant of the deviatoric stress
κ0: Cap surface hardening parameter, :
0
p vol
ε Reference volumetric plastic strain in cap hardening model,
Cap Hardening
When the pressure is greater than pa, compaction occurs, increasing the inter-particle contact
forces. This is the case of cap failure where the material hardens. Therefore, the material hardening law should be defined by the volumetric plastic strain as a hardening variable as shown in Equation 3. The hardening variable in the yield function is pa as it depends on pb, as
given by Equation 4. According to the cap hardening law, hardening or softening of the material depends on the volumetric plastic strain. The size of the yield surface is controlled by adjusting the material parameter pa. When the stress state lies on the cap side, the volumetric
plastic strain is negative and the ice rubble is compacted. While the rubble is compacted, the yield surface grows. On the other hand, when the stress state lies on the shear failure side, the volume increases causing the yield surface to shrink.
CALIBRATION OF MATERIAL PARAMETERS
Heinonen (2004) has calibrated some of the shear-cap material model’s parameters in order to simulate the keel rubble behaviour when subjected to punch shear test. Heinonen (2004) implemented the shear-cap material model into the ABAQUS/STANDARD which is a commercial FEM package. These model’s parameters were calibrated by comparing the FEM simulations with full-scale in-situ experimental results. In the present research, the shear-cap material model has been implemented into an analytical load model using the same values of
the parameters estimated by Heinonen (2004). This model has been used to calculate the load resulting from the interaction of first year ridges with the Confederation Bridge pier (P31). The analytical model is used to obtain the contact pressure between the ridge keel material and the structure, as a function of depth and interaction geometry. Few of the calibrated material parameters’ values estimated by Heinonen (2004) give good results which correlate well with the data recorded in the Confederation Bridge monitoring program. On the other hand, other calibrated material parameters’ values do not provide results that match with the data recorded in the Confederation Bridge monitoring program. This can be attributed to the fact that Heinonen has calibrated these parameters in order to simulate the keel rubble behaviour under punch shear test. As a result, these parameters were adjusted to fit with the data recorded from the Confederation Bridge and simulate the interaction between first year ridge keels and conical offshore structures.
Parameters Calibrated by Heinonen (2004)
In this section, the parameter values that had been calibrated by Heinonen (2004) and for which the results match the measurements from this study will be introduced. A value of 0.3 was used for Poisson’s ratio. This value is a typical value for a material composed of particles (Harr, 1977). Based on the parametric simulations carried out, the value of κ was chosen to be 0.03 in order to simulate the post peak softening phenomena correctly. Finally, the volumetric plastic strain at the reference state (
0 p vol
ε ) in the cap evolution law was ignored. Thus the hardening law was simplified to:
⎟⎟ ⎠ ⎞ ⎜⎜ ⎝ ⎛ − = κ εp vol b p p 0exp (5) ANALYSIS PROCEDURE
The analysis of the rubble forces, using the new model, was based on the following premises: 1. The Rubble behaviour was modeled using a material model which includes the potential for both shear failure and cap failure which takes into consideration the volumetric changes and the possibility of pressure failure.
2. Lemée (2003) showed that the main area of contact between the ridge and the Confederation Bridge Pier is on the cone. This was based on the measurements from the ice pressure panels on the pier shaft, the presence of marine growth on the pier shafts, and the absence of any correlation between keel depth and ice load. Consequently, ridge failure occurs in a trapezoidal area with an average height of 4m and top and bottom widths of 14.2m and 20m respectively.
The analysis process can be summarized as follows:
1. Detailed analysis of video and sonar data was carried out using the video tapes and the sonar data recorded during the Confederation Bridge monitoring program. This detailed analysis focused on ridge interactions with the Confederation Bridge pier No. 31. A total of 519 events were analyzed. This analysis resulted in considerable understanding of the geometric properties of the ridges that encountered the pier during the above mentioned 519 events.
2. For each of the events, the corresponding peak load was identified from the tiltmeter record, and then corrected for the effects of wind. The recorded loads were divided by the cone area situated between the mean water level and the cone edge in order to calculate the recorded pressure. This is a conservative (i.e., upper bound) to the actual pressures, as it ignores the load associated with the consolidated layer. However, at this stage, a satisfactory
model for the failure of the consolidated layer is not available, (all models greatly over-estimate the consolidated layer load), and so this approach has been adopted.
3. The parameters of the shear-cap model were calibrated such that the calculated pressures using the model correlate well with the recorded pressures at the Confederation Bridge Piers. Taking the recorded loads from the Confederation Bridge Monitoring program as a reference is based on the fact that this program is one of the rare monitoring programs worldwide that monitors interactions between real first year ridges and real full-scale conical offshore structure.
4. The shear-cap yield functions given by Equations 1 and 2 were used to calculate the pressure acting on the cone of the Confederation Bridge pier. The ridges’ geometrical properties estimated from the video and sonar data analyses were used.
5. A comparison was then made between the recorded and calculated pressures to assess the correlation between them and to judge the capability of the shear-cap model to simulate the interactions between first year ice ridges and the Confederation Bridge’s piers.
Other Parameters Calibrated to Fit the Confederation Bridge Recorded Data
Based on the sensitivity analysis,εvolp , R, q, β were found to be the most influential parameters on the values of the calculated pressure. Based on Heinonen (2004), the value of εvolp ranged between -0.3 and 0.3. In case of the interactions between keel rubble and the Confederation Bridge cone most of the events will be governed by shear failure. As a result, dilatation will take place and the value of εvolp will be tested in the range of 0 to 0.3. The sensitivity of the results to
this parameter was assessed using parameter values of 0.05, 0.1 and 0.15. The values 0.05 and 0.15 gave calculated pressures which were far in excess of those recorded on the Confederation Bridge. It was found that the value of the volumetric plastic strain (εvolp ) must be of the order of 0.1 if the value of κ is taken to be 0.03 in order to give good correlation between calculated and recorded pressures as shown in Figure 6. As shown in Figure 3, using a volumetric plastic strain value of 0.05, gives very high calculated pressures.
0 5 10 15 20 25 30 35 40 45 0 10 20 30 40
Recorded Pressure (KPa)
C al cu lat ed P re ss u re ( K P a)
Figure 3. Relation between Calculated and Recorded Pressure for εvolp = 0.05
The calculated pressures only match the measured pressures at the higher values, and, in all cases, are greater than 30 KPa. Similarly, at a volumetric plastic strain value of 0.15, the calculated pressures are nearly all negative. These results indicate that these values of volumetric plastic strain ( 0.05 and 0.15) give poor correlation between measured pressures
and calculated pressures. As a result, it may be concluded that the value of the calculated pressure using the shear-cap model is extremely sensitive to the value ofεvolp .
R is the cap side shape factor. Parametric analysis was conducted to study the effect of this parameter on the calculated pressure values. Values ranging between R=0.5 to R=3.5 have been tried. It was concluded that the value of the cap side factor had to be approximately 3.5 in order to provide a best fit between the calculated and the recorded load. Heinonen’s numerical testing indicated that a low value for the cap side shape factor caused too much compaction during plastic deformation on the cap side. This is compatible the current findings as these parametric analyses led to a high value of R = 3.5, which is logical because in this case the failure is a shear failure, where the compaction is minimal. It is clear from Figures 4, and 6 that changing the value of R from 0.5 to 3.5 has considerable influence on the values of the calculated pressure. These results were obtained using a value of εvolp of 0.10.
-20 -15 -10 -5 0 5 10 15 20 25 30 35 0 5 10 15 20 25 30 35
Recorded Pressure (KPa)
C al cu lat ed P res su re ( K P a) Figure 4. Relation between Calculated and Recorded Pressure for R= 0.5
As a result of the parametric analyses, it was found that the value of the second invariant of the deviatoric stress tensor q must lie in the range of 40-60 KPa. It can be seen from Figures 5 and 6 that decreasing the value of q decreases the values of the calculated pressures. Figure 6 for a value of q of 50 KPa, shows a reasonable trend with a best-fit line that passes through the origin, although there is considerable scatter, and negative values of pressure. Figure 5 for value of q of 35 KPa gives very low values of the calculated pressure such that most of the trend line lies in the negative zone.
Finally, an extensive parametric analysis has been done to investigate the effect of cohesion d and internal friction angle β on the correlation between the pressures calculated from the shear-cap model and those recorded in the Confederation Bridge monitoring program. An exponential relationship determined by Heinonen (2004) that fit all data from admissible combination curves, l has been used. Values of β have been assumed ranging from 10o to 55o. Then the corresponding values of d have been calculated using the relation estimated by Heinonen (2004) as follows: ) ln(tan ) exp( ) 45 ( ) ( 0 β β = = x ax d d (8) Values of a (an empirical constant) and d (45o) have been estimated to be -0.3447 and 8.471 respectively (Heinonen, 2004). Substituting the assumed values of β and the calculated values of d into the shear-cap model, one can calculate the pressure. After detailed parametric
analysis, it was estimated that the values of β that give the best correlation between the recorded and the calculated pressures, ranged between 15° and 30°.
-20 -10 0 10 20 30 40 0 10 20 30 40
Recorded Pressure (KPa)
C al cu lat ed P re ss u re ( K P a)
Figure 5. Relation between Calculated and Recorded Pressure for q = 35KPa
RESULTS OF THE ANALYSIS
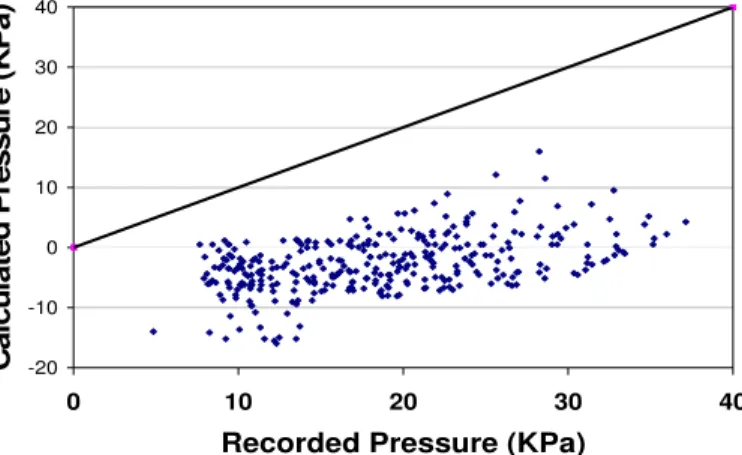
The results of the comparison are shown in Figure 6. The final values of the model parameters that give the best correlation between the calculated pressures and the recorded pressures are as follows: εvolp = 0.1, κ=0.03, q=50KPa, β=30o and R=3.5. In general, the calculated pressures are lower than the measured pressure, which is reasonable, given the upper bound character of the measured pressures. However, of concern is the presence of negative pressures for a number of interactions and this suggests that further work is required to refine the model.
-10 0 10 20 30 40 50 0 10 20 30 40 50
Recorded Pressure (KPa)
C a lc u la ted P re ssu re ( K P a)
Figure 6. Relation between Calculated and Measured Pressures
CONCLUSIONS
A new approach has been used to develop a unified model for the prediction of the average pressures associated with interactions between rubble ice features and conical offshore structures. While the model owes its origin to the work of Heinonen, the development as a stand-alone, analytical model, is new. The following conclusions result from the work:
a) The introduction of a cap failure model to a model that accounts for the potential for shear plane failure (essentially a model that allows the rubble to fail in compression in the presence of near hydrostatic compressive stress fields, and which can account for volumetric contraction) allows two forms of rubble failure to occur; shear plane failure and compressive failure. The presence of the latter form of failure is supported by the frequent observations of
“ploughing” of rubble features by the Confederation Bridge piers, and the absence of clearly defined shear failure planes.
b) Calibration of the factors required for the combined failure model was based on previous calibration by Heinonen, as well as calibration on the basis of the Confederation Bridge observations and measurements. There is considerable scatter in the results and therefore considerable uncertainty in the calibrations. However, the trends suggest that the model is capable of modeling the loads measured on the piers.
c) The aims of the study have been achieved. The paper proved that the shear-cap model holds considerable promise in simulating the keel rubble behaviour. Also it showed that the shear-cap model can be implemented as an analytical procedure that can be used by design engineers.
FUTURE WORK
This paper presents the initial results of a research plan to develop a unified analytical model that calculates the load of interaction of first year ridge keels with conical offshore structures. More work needs to be done on the model as follows:
1) The model needs to be generalized for different values of εvolp and κ.
2) To determine the reasons for the negative pressures in Figure 6.
ACKNOWLEDGEMENT
The authors would like to acknowledge the support of Strait Crossing Bridge (SCBL), Public Works and Government Services Canada (PWGSC), the Program for Energy Research and Development (PERD), and the Natural Sciences and Engineering Research Council of Canada (NSERC).
REFERENCES
Brown T., 2006 “Ice Monitoring on the Confederation Bridge, What Has Been Learnt” Proc. CSCE 2006 Annual Conference, Calgary, Alberta, Canada, Paper ST-079.
ElSeify, M.O. And Brown, T.G. 2005 “A Unified Model for Rubble Ice Load and Behaviour”, Final Report to National Research Council of Canada, PERD Ice/Structure Interaction Program. Report No.: PERD/CHC 5-119.
Harr, M.E. 1977 “Mechanics of Particulate Media” Mc-Graw-Hill Inc. USA, 543p.
Heinonen J. 2004 “Constitutive Modeling of Ice Rubble in First-Year Ridge Keel” PhD Thesis, Helsinki University of Technology, Helsinki, Finland.
Lemée, E.M., 2003 “Pressure Ridge Interaction with the Confederation Bridge Piers”, MSc Thesis, Civil Engineering Department, University of Calgary, Calgary, Alberta, Canada.