Automating Journey Fare Calculation for Transport for London by
Joshua J. Maciejewski
Submitted to the Department of Civil and Environmental Engineering in Partial Fulfillment of the Requirements for the Degree of
Master of Science in Transportation at the
Massachusetts Institute of Technology June 2008
© 2008 Massachusetts Institute of Technology. All rights reserved.
MASSACHUSETTS INS' OF TEGHNOLOGY
JUN 1 2 2008,
LIBRARIES
Signature of Author ... ... ..
Depa4ment of Clil and 'Evironmental Engineering May 9, 2008
Certified by ...
Certified by ... .. ...
S. George Kocur
Senior Lecturer of Civil and Environmental Engineering Thesis Supervisor
/ Nigel Wilson
Professor of Civil and Environmental Engineering Director, Master of Science in Transportation
Accepted by ...
Daniele Veneziano Chairman, Departmental Committee for Graduate Students
Automating Journey Fare Calculation for Transport for London by
Joshua J. Maciejewski
Submitted to the Department of Civil and Environmental Engineering on May 9, 2008 in Partial Fulfillment of the Requirements for the
Degree of Master of Science in Transportation
ABSTRACT
This thesis develops a method to automate journey fare calculation for Transport for London. Today, fares for every possible origin-destination station pair within the London Underground are prepared manually based on the zonal fare structure. Multiple feasible paths often exist within the network for a given origin-destination pair, each of which may produce a different journey fare. Thus, manually adjusting journey fares after any alteration of the network or fare structure is a time consuming task for staff and restricts Transport for London's ability to implement changes in fare policy. This approach also lacks transparency from the passenger's perspective.
Automating Transport for London's fare calculation requires automating the selection of travel paths. This thesis adapts a label-correcting shortest path algorithm to produce journey paths and fares based on four different selection rules: minimum fare, minimum number of transfers, minimum travel time, and minimum distance. The algorithm operates on a directed graph model of the network. This thesis develops a method to structure the directed graph to capture the network's intricacies.
Given a network and fare structure, the modified shortest path algorithm produces all path and fare information for an origin-destination pair in less than one millisecond. Transport for London can then assess the implications of a fare policy change by comparing the existing fares with those generated under each path selection rule. Supplementing these comparisons with historical data provides an estimate of the number ofjourneys affected and the possible impact on fare revenue. This thesis uses a sample dataset to estimate these impacts.
Thesis Supervisor: George Kocur
Table of Contents
1 Sum m ary and conclusions ... ... 7
1.1 Problem statem ent ... ... 7
1.2 Conclusions... ... 7
1.2.1 N etwork m odel and shortest path... 8
1.2.2 Tracking variables for path selection and fare calculation ... ... 8
1.2.3 Staff and passenger inform ation device ... 9
1.2.4 Perform ance ... 9
1.2.5 Com parison of generated and current fares ... 9
2 Shortest path algorithm s ... 11
3 Fram ework ... 12
3.1 Background... 12
3.1.1 Transport for London ... 12
3.1.2 National Rail ... 13
3.1.3 TranSys and Oyster ... 13
3.1.4 Current ticketing and fare structures ... 13
3.2 Problem statem ent and research question... ... 17
4 Algorithm ... 19
4.1 N etwork m odel ... 19
4.1.1 Basic concepts ... 20
4.1.2 Parallel service case... 20
4.1.3 Representing transfers ... 21
4.1.4 Representing station closures ... ... 24
4.1.5 Representing handicap accessibility restrictions ... ... 25
4.1.6 Representing tw o-w ay service... ... 26
4.1.7 Representing branches... 27
4.1.8 Representing out-of-station interchanges ... 28
4.1.9 Representing interm ediate validators ... 29
4.1.10 Autom ated arc and node generation ... 30
4.2 Path selection ... 33
4.2.1 M inim um fare path... 34
4.2.2 M inim um transfer path... 34
4.2.3 M inim um duration (travel tim e) path... ... 35
4.2.5 Tie breaking ... 36
4.2.6 Interm ediate validation... ... 40
4.3 Tracking variables ... ... 41
4.3.1 Tracking visited zones ... 42
4.3.2 Tracking fares ... 45
4.3.3 Tracking transfers and last service ... ... 50
4.3.4 Tracking duration ... ... 51
4.3.5 Tracking distance ... ... 51
4.3.6 Tracking predecessor nodes ... ... 52
4.3.7 Tracking com posite cost... 52
4.4 Retrieving path inform ation... ... 53
4.5 Staff and passenger inform ation device... ... 55
5 Database ... 58 5.1 FareStructure table... ... 59 5.2 FareTypes table... ... 59 5.3 Services table ... 59 5.4 ServiceLinks table ... ... 59 5.5 Stations table ... 60 5.6 StationTypes table ... 60 5.7 TransferDurations table ... 60 5.8 Zones table ... 60 6 Perform ance ... 61
6.1 Perform ance required... ... 61
6.2 A lgorithm perform ance ... ... 62
7 Com parison of generated and current fares ... ... 63
7.1 Exam ple data source ... ... 63
7.2 Inclusion of London Overground ... ... 63
7.3 M inim um fare path ... 64
7.4 M inim um transfer path ... ... 67
7.5 M inim um duration (travel tim e) path ... 68
Appendix A : Current TfL fare structure ... 70
1 Summary and conclusions
1.1 Problem statement
This research focuses on automating journey fare calculation for Transport for London (TfL). Today, fares for every possible origin-destination (OD) station pair within the London Underground network are calculated manually based on the zonal fare structure. The manual approach restricts TfL's ability to implement changes in fare policy. Multiple feasible paths often exist within the network for a given OD pair, each of which may produce a different journey fare. Thus, manually adjusting journey fares after any alteration of the network or fare structure is a time consuming task for staff. This approach also lacks transparency from the passenger's perspective.
London Underground fares are a function of the innermost and outermost zones a passenger travels through on a given journey. For example, a journey that begins at a station in zone 3, travels through zone 2, and ends at a station in zone 1, is subject to a zone-i-to-zone-3 fare. Moreover, the same zone-l-to-zone-3 fare applies to a journey that starts in zone 3, crosses central London through zones 1 and 2, and ends at another station in zone 3.
Automating fare calculation requires automating path selection. However, TfL only has knowledge of a passenger's entry and exit locations, and therefore must make assumptions about the actual path of travel. Modeling the TfL network as a directed graph and adapting a shortest path algorithm accomplishes this task.
1.2 Conclusions
The primary conclusion of this research is that automating fare calculation for TfL's network is feasible. One can model the network, with all its intricacies and complexities, in a way that produces the desired results but remains manageable for TfL staff. Adapting a shortest path algorithm automates the selection of journey paths between any two stations. The fare structure and a set of rules guide the algorithm. This algorithm produces the journey fare and a variety of path information relevant to staff and passengers. Thus, the algorithm could function solely as a fare calculator or it might be expanded into an information device for staff and passengers.
1.2.1 Network model and shortest path
Shortest path algorithms operate on the nodes and arcs of a directed graph. Each arc is assigned a cost, which can be defined in a variety of ways. The algorithm finds the lowest cost path from an origin node to any other node in the network. A shortest path algorithm was adapted to produce:
* minimum fare paths, * minimum transfer paths,
* minimum duration (travel time) paths, and * minimum distance paths.
Modeling each station as a node and each station-to-station branch of service as a unique arc produces a directed graph representation of TfL's network. The addition of station-service sub nodes and one-way arcs represents transfers between services, or between branches of services. Additional arcs between station entry and exit nodes represent out-of-station interchanges (defined later) and transfers between modes. Entry, exit, or handicap access at represented stations can be disabled for path selection and fare calculation without removing the station for pass-through service.
Assigning each arc's cost under the minimum transfer path requires knowledge of the branch of service associated with each arc and the branch of service utilized to reach the previous node along the shortest path. In the case of the minimum fare path, the cost of each arc must be dynamically determined based on the innermost and outermost zones visited previously in the journey, consistent with the fare rules in London. Transit systems with different fare rules require a different adaptation, though based on the same principles.
1.2.2 Tracking variables for path selection and fare calculation
Whenever the algorithm considers an arc and node, it adds the incremental fare associated with that arc to the journey fare stored for the previous node in the path. Fares are calculated incrementally in this manner, but the fare increment itself depends on two other tracked values: the innermost zone visited
and the outermost zone visited. The zone-visited variables are associated with the stations in the journey, not the arcs.
The algorithm tracks transfers using two variables: total transfers made and the previous service used to reach the active node. When the algorithm considers a node and arc, it compares the service associated with that arc to the service used to reach the previous node. If the services are different, a transfer must occur and the arc's transfer increment is one unit.
Tracking variables for distance and duration is straightforward. Each arc is assigned fixed increments of duration and distance. The algorithm tracks total distance and total duration from the root for each node. When a node and arc are considered, the algorithm adds the arc's incremental values to the total values for the previous node.
The algorithm tracks each variable under each path selection method regardless of whether or not it needs the variable to determine the shortest path. Doing so allows the algorithm to produce all relevant path information for comparison of paths selected by the different methods. To eliminate ties between two or more shortest paths, the algorithm makes all decisions based on a composite variable. This composite variable combines the path variables in the order of importance dictated by the path selection method.
1.2.3 Staff and passenger information device
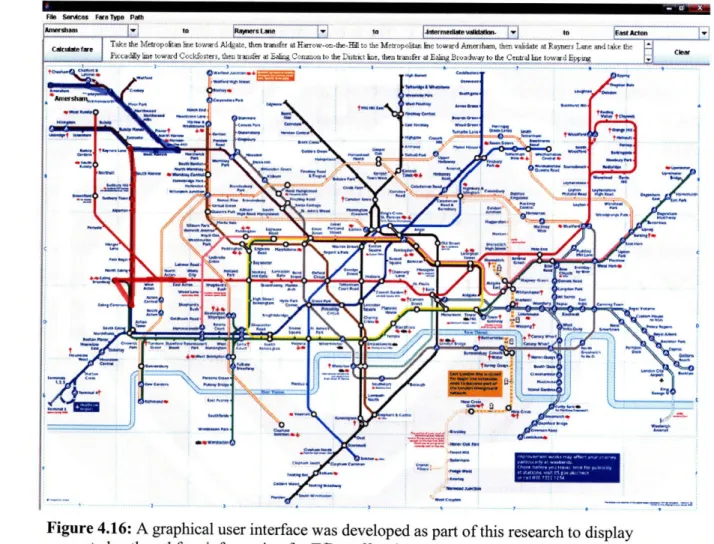
The path selection algorithm tracks many pieces of information about the shortest path that may be useful to passengers and TfL staff alike. A graphical user interface (GUI) could be used to illustrate the shortest path and to provide relevant travel details. A GUI was written as part of this research to serve as an example.
The GUI might be a web-based application accessible to both staff and passengers or restricted to internal use by TfL staff. It might be deployed as an in-station passenger information kiosk or as an application available for download to a PDA. Depending on its implementation, TfL may restrict the options the GUI makes available to passengers.
1.2.4 Performance
Performance of the algorithm is a key requirement for implementation as a real-time component in the fare collection system. The Hao-Kocur algorithm was chosen as the shortest path algorithm for this research because it is arguably the fastest label-correcting algorithm available. Tests conducted on a desktop platform indicate the adapted algorithm is fast enough for use in real-time. The algorithm completes the calculation of the shortest path and all relevant information in less than one millisecond on average.
1.2.5 Comparison of generated and current fares
Automating fare calculation requires that TfL define business rules for determining a passenger's travel path. Depending on the selected combination of rules, generated fares for some OD pairs will
differ from the currently advertised fares. Changes to the graph representation of the physical network, such as deciding to include the London Overground in the LUL fare structure, will also produce different fares.
TfL staff can compare the current fares to fares generated under various decision rules for a given network structure. This allows TfL to identify the OD pairs that would experience a change in fare and, using historical data, estimate the number of journeys affected and the potential impact on revenue. Allowing costless transfer between LUL and the London Overground increases the total number of affected OD pairs and journeys. This effect is more pronounced under a minimum fare path policy than under a minimum transfer path policy because the minimum fare path method is more likely to include the Overground in path selection.
The historical journey sample used for this analysis lacked sufficient detail to produce bankable estimates of each method's impacts on revenue. However, the data indicate that the minimum fare path, minimum transfer path, and minimum duration path methods each result in a decrease in revenue. The average daily pay-as-you-go revenue during the sample period was £1.3 million. The minimum transfer path has the smallest decrease at £32,000 per day, or 2% of pay-as-you-go revenue. The minimum fare path with the Overground included has the largest decrease at £96,000 per day, or 7% of pay-as-you-go revenue.
2 Shortestpath algorithms
All shortest path algorithms are labeling algorithms. These algorithms find the path and cost (label) to each node in a network from the origin, or root, node. Shortest path algorithms operate on the arcs out of each node and track candidate nodes on a candidate list. Two general types of shortest path algorithms exist: label setting and label correcting.
Label-setting algorithms, such as Dijkstra's algorithm from 1959, permanently add arcs to the shortest path tree and visit each node only once. Label-correcting algorithms can revisit nodes, which is useful for this research because, in TfL's zonal fare structure, the cost of an arc may change based on the nodes previously visited. Thus, a label-correcting algorithm is a more appropriate choice for calculating minimum fare paths.
Several label-correcting algorithms are available from which to choose. Performance will be critical if the fare calculation algorithm is implemented as a real-time component in a fare collection
system. A 1992 report titled A Faster Implementation ofa Shortest Path Algorithm identified Hao-Kocur
as generally the most efficient of the label-correcting algorithms (Hao & Kocur, 1992).
The method of managing and selecting nodes from the candidate list differentiates one label-correcting algorithm from another. Hao-Kocur places a node on the end of the candidate list "only if it has never been on the [candidate list] before and its label is greater than that of the current front node" (Hao & Kocur, 1992, p. 2). In any other case, the algorithm adds the node to the front of the list. More specifically, the Hao-Kocur algorithm operates as follows:
1. Set the root node's label equal to zero and add it to the candidate list. Set the initial label for all other nodes equal to infinity.
2. Select the node on the front of the candidate list and scan each arc out of that node. For each of these arcs, sum the arc's cost with the candidate node's label. Compare this result with the label of the node connected by the arc. If the result is an improvement over the existing label and this node is not on the candidate list, add it to the candidate list in the following manner:
* If the node was previously on the list, add it to the front.
* If the node has never been on the list and its label is smaller than the front node's label, add it to the front.
* Otherwise, add the node to the back of the candidate list. 3. Repeat (2) until the candidate list is empty.
3 Framework
3.1 Background
London's complex transportation system relies on the coordination of numerous entities, both public and private. This section briefly explores the history and role of the entities most applicable to this research. The current fare structure and fare collection system are also discussed.
3.1.1 Transport for London
Transport for London, or TfL, as it is widely known, is a public agency responsible for most transportation-related matters in the city of London, England. TfL was created in 2000 as one of four
functional bodies of the Greater London Authority (GLA), which was established by the Greater London Authority Act of 1999. The Metropolitan Police Authority, the London Fire and Emergency Planning Authority, and the London Development Agency are the other three bodies of the GLA (Greater London Authority Act, 1999).
TfL assumed the responsibilities of its predecessor agency, London Regional Transport (LRT), during the 2000 transition. The London Regional Transport Act of 1984 established LRT, and LRT fell under the direct control of the national government through the Secretary of State for Transport (London Regional Transport Act, 1984). London Underground Limited (LUL) was created in 1985, but TfL did not assume direct responsibility for LUL until 2003 due to contract negotiation of a public-private partnership.
The creation of the GLA and TfL marked a significant transition from control by the national government to control by local government. The membership of the GLA includes the Mayor of London and a locally elected 25-member assembly. The mayor also chairs the board of directors that controls TfL. Thus, TfL interprets its task as "to put the Mayor of London's Transport Strategy into action and manage transport services across the Capital" (Company information, 2008). According to the TfL website, implementing this strategy means TfL's responsibilities include:
* London's buses,
* London Underground Limited (LUL), * Docklands Light Railway (DLR), * managing Croydon Tramlink,
* managing the Congestion Charging scheme,
* regulating the city's taxis and private hire trade, and * other transportation services (Company information, 2008).
In 2007, through subsidiary companies and private partnerships, more than 1.8 billion passenger journeys were made using TfL's surface network of approximately seven thousand buses, on over 700 routes (London Buses, 2008). More than one billion passenger journeys were made using the LUL network during the same period. The LUL network has over 250 miles of track and nearly 4100 subway cars (London Underground, 2008).
3.1.2 National Rail
National Rail (NR) refers to the private train operating companies (TOCs) created from the break-up of British Rail under the Railways Act of 1993 (About ATOC, 2008). Several TOCs operate
passenger suburban rail service in the Greater London area. Numerous London stations serve both the underground and NR, forming a vital link in the commuter network.
3.1.3 TranSys and Oyster
TranSys is a private consortium of Cubic Transportation Systems, Electronic Data Systems (EDS), Fujitsu Services Limited, and WS Atkins (About us, 2008). In 1998, TfL awarded TranSys a contract to design, implement, manage, and market an integrated smartcard fare collection system. Cubic and EDS remain principal partners while Fujitsu and WS Atkins were largely involved in the initial design and implementation of the Prestige contract (Prestige Fact Sheet, 2008).
TranSys developed London's current contactless automatic fare collection system under the name Oyster. Oyster supports preloading of season tickets as well as a prepaid option known as pay-as-you-go. Oyster has been highly successful since coming online in November 2002. Approximately 80% of all bus and Tube journeys are made using Oyster. Over seven million journeys are completed each day using Oyster resulting in ten million daily Oyster transactions (Oyster fact sheet, 2008).
3.1.4 Current ticketing and fare structures
TfL's current fare and ticketing structures vary from mode to mode. Journeys occurring solely on London Bus or the Croydon Tramlink carry a flat fare regardless of the distance travelled. Journeys on the underground, DLR, or London Overground carry a fare based on TfL's zonal fare structure. These
two different fare structures are supported by variations of the ticketing system, which combines magnetic-stripe paper tickets and the Oyster smartcard.
TfL offers a variety of concessionary fares as well as peak and off-peak fares. TfL also
introduced a daily capping policy that limits the maximum amount charged to a passenger's pay-as-you-go account each day, regardless of the number of journeys. The following discussions in parts a and b refer to adult peak, single journey fares.
(a) Fares and ticketing on bus and tram
Fares for bus service in the Greater London area were once distance-based, but today all bus and tram journeys carry a flat fare. Valid fare payment for bus and tram includes cash single tickets, Bus
Savers (bus only), Bus Passes, Travelcards, and Oyster pay-as-you-go. The fare is due upon boarding, and several routes now require cash single tickets be purchased off-vehicle to expedite boarding (Fares and tickets supplementary information, 2008).
As of January 2008, the cash single fare for bus and tram is £2 and the Oyster single fare is 90p. The significant pay-as-you-go discount reflects TfL's commitment to encouraging Oyster adoption. Travelcards and Bus Passes allow unlimited free travel within a given time period and carry fees commensurate with the length of the period. The current flat fare structure for bus and tram makes fare calculation for these modes straightforward.
(b) Fares and ticketing on LUL and DLR
Valid ticket media for use on the Underground and DLR include cash single tickets, Travelcards, and Oyster pay-as-you-go. Cash singles and short duration (one and three-day) Travelcards are magnetic stripe paper tickets, while pay-as-you-go and longer duration Travelcards require the Oyster smartcard. All passengers must pass through a set of gates at each end of their journey. To gain entry to the
Underground, passengers using Oyster tap their smartcard on a card reader attached to the entry gate; exit from the system is accomplished in a similar manner. Many DLR stations are not gated, but passengers are required to tap an Oyster validator at either end of their journeys to mimic passing through the gates. Pay-as-you-go fares are at a substantial discount to cash single fares and are the primary focus of this research.
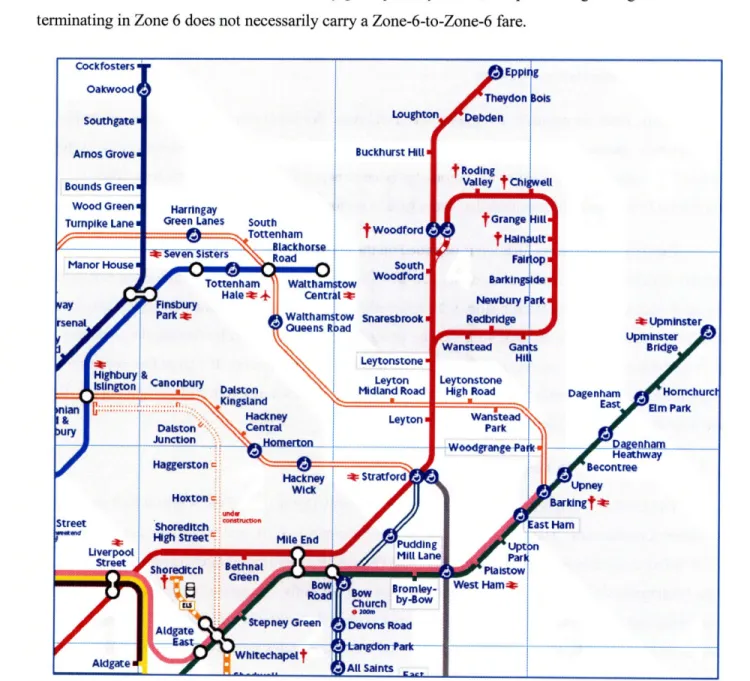
TfL uses a zonal fare structure to determine pay-as-you-go fares for journeys on the Underground and DLR. This fare structure has nine zones centered on central London. Figure 3.1 shows a portion of the LUL network and the zonal fare structure for northeast London. Zone 1 is the innermost zone. The origin zone and destination zone alone do not determine the fare-fares are calculated based on the innermost and outermost zones visited on any given journey. Thus, a trip both originating and terminating in Zone 6 does not necessarily carry a Zone-6-to-Zone-6 fare.
Harrlngay
Green Lanes South
Tottenenharn
Road
nb Tottenham Walthams
Fnsbury Hale 4~ CentrI ParkWalthamt Oueens Rb Southgate Amos Grove Bounds Green, Wood Green I Turnpike Lane I Manor House I iury Street Liverpool
Street
Mitt Lane
Sh redtch .thna Pla
S Green ~Pas Eppi Theydon Loughton /Debden Buckhurst Hill, South Woodford tow 1 * :ow Snaresbrook i 'ad Leytonstone Leyton Midland Road Leyton --- - ---t Roding Valley tChl Grange tHain Fal Barking Newbury I Redbridge Wanstead Gar HI Leytonstone High Road Wanstead Park -- woodgrang4 * Stratford PuddingI
T : I Bromlay-! West Ham:
Schurch by-ow
Adgate StepneyGreen RDevonsRoad
Aidgate -Whltha• W IAUSains
Aldgate All Saints ~
-Pa Upt Parl :ow
1
*L UpmInstern Upmlnster J Bridge Dagenham Homchurcl East Elm Parkk-Heathway Becontree Upney BarkHngt* ast Ham
Figure 3.1: This northeast segment of the London Underground map shows parts of TfL's fare zones 1 through 6.
For example, consider a journey from Epping to Upminster. As Figure 3.1 illustrates, both stations are in Zone 6, but no service exists connecting the two stations directly through Zone 6. Thus, the journey fare cannot be a Zone-6-to-Zone-6 fare. A passenger making this journey must take the Central line (red) into an inner zone and transfer to District line (green) service toward Upminster. Numerous
Cockfosters Oakwood A Canonbury Daston Kingsland Hackney DaCtonentral Junction Haggerston e Hackney Wick Hoxton Shoreditch
High Street Mile End
j I _ ~~ __~_
I-.J
potential paths and transfer locations are available for this journey. The passenger may transfer among several LUL lines, the DLR, or even the London Overground. Depending on the passenger's chosen path, this journey could reasonably require visiting a variety of different zones: Zones 3 through 6 will
necessarily be visited, but Zone 2 and Zone 1 might also be visited. Thus, a variety of different fares may be reasonably applicable for the same origin-destination (OD) pair. The fact that most transfers at LUL stations occur behind the gate lines, without record, compounds this issue. Once a passenger taps in and passes through the gate, the system has no further knowledge of the passenger's actual travel behavior other than the eventual tap-out location.
Today, fares are manually assigned to each OD pair. For those pairs with multiple reasonable paths and fares, manual rules are applied to determine the path. TfL and Transys reconstruct the system's
OD fare tables following any major alteration of service or adjustment to the fare structure. The information from these tables is loaded at every gate to perform Oyster pay-as-you-go transactions.
The passenger's entry location is recorded on the Oystercard during the entry transaction and a base fare is deducted from the card's pay-as-you-go-balance. When the passenger taps at the exit gate, the reader updates the Oystercard history with the exit location. At the same time, the system compares the fare for the appropriate OD pair with the fare charged on entry. If a smaller fare applies, which is typically the case, the pay-as-you-go account is credited with the difference. If a large fare applies for this journey, the system debits the difference. If the passenger exits the system without tapping out, the base fare has already been deducted.
(c) Fares and ticketing on London Overground
The London Overground is a train operating company that is part of the National Rail network in the Greater London area. The Overground falls under the control of TfL and therefore must be supported by TfL's fare collection and ticketing systems. The Overground has a zonal fare structure similar to that of the Underground and DLR. However, the Overground currently operates service at much lower frequencies and over greater station-to-station distances than that of the Underground. Therefore, it is reasonable to assume the Overground may have a different set of fares for the same zonal structure in the
future.
Most transfers between the Underground and the Overground require passengers to pass through an intermediate gate line. The system records these transfers, which can be used for better calculation of fares.
(c) Fares and ticketing on National Rail
National Rail has historically operated on a paper-based ticketing structure with OD-based fares. A growing number of NR services in the Greater London area now accept Oyster-pay-as-you-go fare payment. However, in many cases the NR fare structure is different from TfL's zonal structure and requires special consideration.
(d) Concessionary fares
A variety of discounted fares exists within TfL's current fare structure. For example, 11-15 year old photocards permit free bus travel and reduced LUL and DLR fares for children aged 11 to 15 years. Additional concessionary fares apply to college students, children of various ages, the unemployed, and the elderly. The existence of concessionary fares is largely a political phenomenon and thus TfL's fare collection and ticketing systems must be able to adapt to changing demands.
(e) TfL's evolving approach to fare collection
In an effort to leverage the benefits of technological improvements, TfL created the Future Ticketing Project (FTP). The FTP is concerned with the next generation of ticketing technologies that may be applicable at TfL. Developments in the payment industry may make it desirable for TfL to accept a variety of contactless payment devices at the gate lines including contactless credit cards, key fobs, and NFC-enabled mobile phones. The exploration of alternative arrangements is ongoing. TfL may decide to manage some or all of the existing Oyster fare collection system in-house during a period of transition to a new payment medium.
Many significant changes that will require some adjustment to the fare collection system are occurring within the TfL network; service on the Overground is expanding, more NR services are
adopting TfL's payment media, and Crossrail will open in 2017. Additionally, elections for the Mayor of London will take place in May 2008, which may result in notable changes in the general fare structure or concessionary fares. Small adjustments to the base fare structure under the current manual approach would likely require extensive work and may delay implementation of the correct fares.
3.2 Problem statement and research question
This research focuses on a key component of any future TfL-managed ticketing system: automating the calculation ofjourney fares given a base zonal fare structure and a set of rules. A supporting focus of this work is the development of an automated path selection algorithm for travel within the TfL network. Automation is vital for implementing new fare types, new services, or changes
to the base fare structure. Automation of fare calculation is also essential if TfL chooses to involve a generic acquirer for credit card processing or similar transactions.
Automating fare calculation for TfL's path-based fare policy requires development of a path selection algorithm to choose from among the many feasible routes available between most OD pairs. Modeling the TfL network as a directed graph allows a modified shortest path algorithm to select paths
for fare calculation. A set of rules regarding fare path decisions guide this algorithm; TfL will need to establish business rules to define these decisions.
Using well-defined business rules to guide fare calculation will also increase transparency for TfL staff and customers. Today, it is difficult to find an explanation for why a given route is assumed for fare calculation. TfL's online passenger information guide, Journey Planner, occasionally suggests travel routes that do not reflect the published fare. Sharing a common path selection algorithm for fare
calculation and providing passenger information will eliminate such discrepancies-this research intends to support both fare calculation and passenger information systems.
This thesis first explores how to model the complexities of TfL's network as a directed graph. Then, four different basic path selection rules are explored and implemented within a shortest path algorithm. This algorithm could assist the manual fare calculations performed today; the results produced by the algorithm could be loaded as static fare tables in the Oyster collection system. Under this
approach, the speed of the algorithm is not a primary concern. However, computation time becomes a key concern if the algorithm is employed as a real-time component in one or more of the following:
* a future fare collection system, * a passenger information device, or * a planning and policy tool.
Therefore, the algorithm's performance is also discussed.
TfL's adoption of business rules to govern path decisions may result in differences for some OD pairs between the fares generated and the fares currently advertised. Changes in the network or fare
structure will also produce different fares. Comparing generated and current fares allows TfL to identify the OD pairs affected by a policy change. Historical data can then provide estimates of the number of journeys potentially affected. This thesis uses a sample data set to compare the number of OD pairs and
4 Algorithm
4.1 Network model
The LUL network, as seen in the standard Tube map in Figure 4.1, can be portrayed as a set of nodes connected by arcs. Algorithms operating on a network of arcs and nodes can identify the shortest path between any two points in the network. This research defines the shortest path in multiple ways including:
* minimum fare path, * minimum transfer path,
* minimum duration (travel time) path, and * minimum distance path.
Using an algorithm to produce these paths in the LUL network, with its complex set of services and interchanges, requires a graph representation of the physical network. This section describes how to represent the intricacies of the network for the purpose of fare calculation.
Figure 4.1: This iconic map of the London Underground illustrates the network's complexity
4.1.1 Basic concepts
The shortest path algorithm operates on the arcs and nodes of a directed graph. The simplest case is when two or more stations are connected by one service operating in one direction. Modeling this case as directed graph requires treating each station as a node and each connection from one station to the next as a one-way arc, as seen in Figure 4.2.
0
0.
"0
Figure 4.2: Modeling three stations as nodes and the service
connecting them as one-way arcs produces a directed graph.
Assume the passenger starts at a node called the origin, or root, node. For each node in the network, the shortest path algorithm developed in this thesis tracks eight pieces of information to describe the path from the origin node:
* monetary cost (fare), * duration (travel time), * distance,
* number of transfers,
* predecessor node (the previous node in the path),
* the service used between predecessor and current node (service ID), * the innermost zone visited at any node along the path, and
* the outermost zone visited at any node along the path.
All eight pieces of data are required to calculate the paths with the lowest fare, travel time, distance or transfers. The first four elements in this list are direct measures minimized by the algorithm; the last four elements are intermediate values the algorithm uses to support its decisions.
4.1.2 Parallel service case
Next, consider the case when two or more services (or branches) operate between a series of stations. Consider the network of three nodes illustrated in Figure 4.3. Assume two different one-way services, service A and service B, operate from node 1 to node 2 and that only service B continues from node 2 to node 3. Two feasible paths exist from node 1 to node 3. Both paths travel via node 2 and therefore node 3's predecessor will always be node 2 (and node 2's predecessor will always be node 1).
If the fare structure is the same for both of these services, then the fare from node 1 to node 3 will be the same regardless of the path chosen. The innermost and outermost zones visited are the same regardless of path, because either path visits exactly the same set of nodes. The service ID stored for node 3 will be service B, regardless of path choice, because only service B connects node 3 to the rest of the network. However, travel time and distance to node 3 may differ depending on path choice, and the number of transfers required will necessarily differ.
A
0
B
Figure 4.3: Two feasible paths exist for travel from node 1 to node 3 in this three-node network with services A and B.
This journey can be completed by utilizing only service B, resulting in zero transfers, or it may be completed by traveling from node 1 to node 2 on service A and then transferring at node 2 to service B, resulting in one transfer.
Travel time will probably differ based on path choice. If the travel time between nodes 1 and 2 is greater on service B than on service A, and some positive transfer time exists at node 2, there are two potential shortest paths. The passenger can use service B from node 1 to 3, or he can use service A from node 1 to node 2, and then transfer to service B to node 3. If the transfer time at node 2 is less than the extra travel time of service B, the minimum duration path uses both services. Otherwise, the minimum duration path uses strictly service B.
The graph shown in Figure 4.3 cannot model this choice. Therefore, the network representation must be modified to better model transfers.
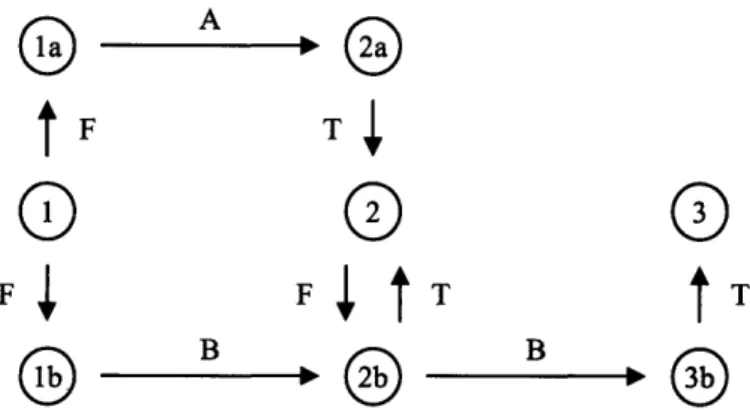
4.1.3 Representing transfers
The network in Figure 4.4 shows an initial model for transfers: * split node 1 into two separate nodes, node la and node lb, * split node 2 into nodes 2a and 2b, and
* add an arc representing transfer from service A to service B via "transfer service" X. This ensures that the minimum duration path is identified correctly.
The time required for transfer at physical node 2 is the travel time on "service" X from node 2a to node 2b. As long as nodes la and lb are assigned zonal attributes identical to that of node 1, and nodes 2a and 2b are assigned the attributes of node 2, then the innermost and outermost zones visited under any path choice method will be appropriately tracked and fare calculation will be unaffected.
A
At
g
X
B
B
(
Figure 4.4: Creating a node for each station-service
combination allows representation of transfers via service X.
To correctly track transfers between services A and B, a set of rules is implemented to evaluate whether a transfer has occurred with the addition of each node. If the last service used in the path is service X, then a transfer has occurred. Otherwise, the last service must be the same as the current service. However, this approach of splitting each node into service-sub nodes is not sufficient.
The initial origin was node 1 and the initial destination was node 3, not node la or node lb and node 3b. Using the modified graph requires associating the beginning and end of each trip with sub-nodes (like la or ib), rather than the original node (1, or 2). This is awkward.
To avoid this, the graph must include unique nodes representing each station and each station-service combination. Figure 4.5 modifies the three-station example from above to reflect this
requirement. An in-station service, service F ("from"), is included to represent travel from the station nodes (nodes 1, 2, and 3) to the appropriate station-service sub nodes (nodes la, lb, 2a, 2b, and 3b). A directed arc of service F is required from a given station node to a station-service sub node whenever travel is feasible from that station on that service.
Service A and service B both operate from station 1, thus two unique arcs of service F must exist: one from node 1 to node la and one from node 1 to node lb. This provides access to each service from node 1. Station 2, however, has only one service operating from it, service B. Thus, only one directed arc
of service F is required: from node 2 to node 2b. Station 3 has no services operating from it, and therefore requires no service F arcs.
Similarly, a directed arc of service T ("to") is required from a station-service sub node to a station node whenever that service operates to that station. Nodes 2a and 2b require such arcs to node 2 because both services A and B operate to node 2. Node 3b also requires an arc of service T to node 3 because service B operates to station 3. Node 1 does not require any arcs of service T because neither service A nor B operates to station 1. Defining service F and service T separately is not entirely necessary in this example; service X could be used in place of services F and T as a universal "transfer" service. However, splitting service X into two more descriptive services makes visualization clearer and simplifies the tracking of transfers.
A
F.-T
B
_BFigure 4.5: Creating a unique node for each station and each station-service combination improves the network model.
If the transfer time between any two services is equivalent for all combinations of services operating at a particular node, then this representation may be sufficient. However, when three or more services operate at a given station this approach is not guaranteed to provide an accurate representation of transfer times.
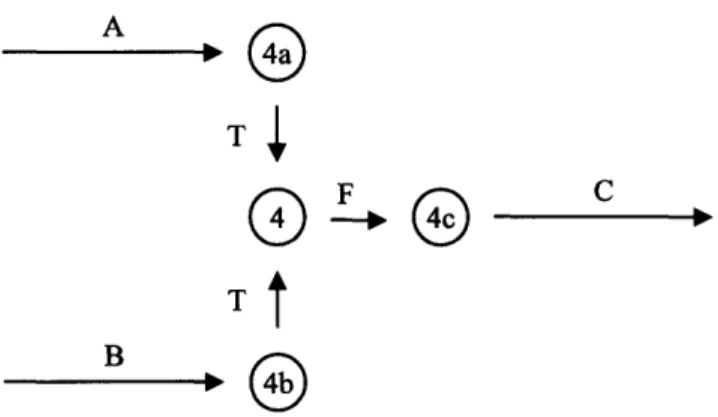
Consider station 4 with services A and B operating to the station, and service C operating from the station. Assuming transfers are possible from A to C and from B to C, the station and station-service sub node representation would resemble Figure 4.6. If the time required to make each of these transfers is identical, then this model accurately represents the physical network. Transfers must occur through node 4, but since the transfer times are identical, this time can be assigned to the arc with service F. A logical operator within the shortest path algorithm then ensures the transfer time is counted only if the passenger is transferring and that it is not counted if the journey is originating at node 4. However, if the transfer times are different in each case, the logical operations required to assign transfer duration to the arc with service F become complex and unmanageable.
A
T
BFigure 4.6: Accurately representing transfer times at stations with
more than two services is difficult under this network model.
A more robust approach creates a unique arc directly between each pair of station-service sub nodes for every possible transfer within a station. Figures 4.7 and 4.8 reflect this approach, which allows straightforward assignment of the appropriate transfer times for every feasible combination.
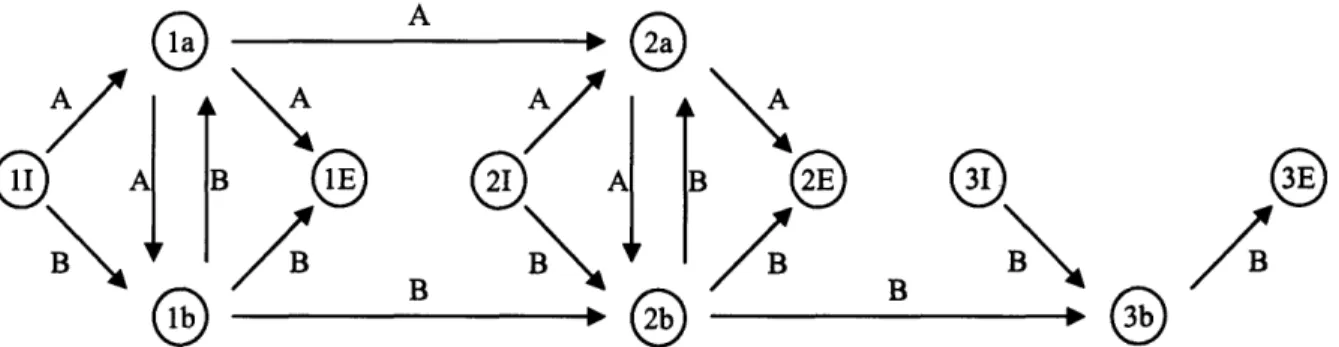
4.1.4 Representing station closures
Splitting node 4 into source node 41 and a sink node 4E, representing ingress to and egress from the system, respectively, helps addresses the transfer issue and improves functionality. Physical stations may close for passenger entry and/or exit while remaining operational for pass-through services. For example, some stations such as Turnham Green via the Piccadilly line, allow entry and exit only during certain periods, but allow pass-through service continuously. Treating passenger entry and exit as two separate nodes for each station provides the ability to represent closures.
A
B ZB
bi•,AA
Figure 4.7: The addition of transfer arcs between station-service sub nodes
Thus, even though the graphical representation grows more complex through the addition of more nodes and arcs, the overall calculation of the shortest path becomes more intuitive and efficient. Figure 4.7 revisits the case of station 4 under this new representation, and Figure 4.8 similarly revisits the three-station case described earlier.
o
AA A A A
SB
B
Figure 4.8: Adding entry and egress nodes at each station ensures transfers will use the direct transfer arcs and also helps support station closures.
4.1.5 Representing handicap accessibility restrictions
Most of LUL's stations were constructed at a time when accessibility by persons with disabilities was not a primary design consideration. TfL has undertaken renovation projects to improve accessibility, but many stations remain inaccessible. Some stations with large gaps between platform and train are completely inaccessible for persons with disabilities. Others are accessible for transfers from one service to another, but cannot be used for entry or exit from the system because of stairwells.
Representing these accessibility restrictions is desirable when employing the path selection algorithm as part of a passenger information system. Handicap accessible routes for an OD pair can be produced upon demand. Altering the graphical representation allows incorporation of the accessibility constraints:
* If a station is not handicap accessible for entry and exit, do not create the ingress and egress nodes at that station. This is similar to disabling a station for entry and exit, but it will only occur when requesting handicap-accessible routes.
* If a station is not handicap accessible for transfers, do not create transfer arcs between any of the station-service sub nodes.
Removing the entry and exit nodes for a given station necessarily disables this station as an entry or exit location. Removing the transfer arcs necessarily prevents transfers or off-vehicle intermediate validations at this station.
4.1.6 Representing two-way service
The examples earlier in this chapter assume travel on each service occurs in one direction: from left to right. In a directed graph, representation of two-way service between any two adjacent stations requires two unique one-way arcs.
Under the station-service sub node representation, these two arcs can both be constructed between the same two station-service sub nodes, as seen in Figure 4.9. The shortest path algorithm will track each data item correctly using this model, and each of the path choice methods will produce the correct paths for the constructed graph, with one exception.
A
A
0
AFigure 4.9: Representing two-way service requires two direct arcs for each
station-to-station connection. Figure 4.10 shows a more robust representation.
A problem arises when a transfer occurs from service A-leftward to service A-rightward, or vice versa. From the algorithm's perspective, a transfer has not occurred because the two arcs are both of service A and no intermediate service was used. The algorithm will not increase the total travel time or the transfer count. Figure 4.10 shows a representation that handles this issue correctly.
A
A A A
D
D
Figure 4.10: Representing two-way service as two separate services (A and D) improves path description and transfer time tracking.
Although it does not affect the path choice or fare calculation, another issue develops from the representation in Figure 4.9 when producing a text description of a generated path. Using this model makes it difficult to provide a meaningful path description for passengers and planners because the name of a given service, which will be reported in the path description, will be the same regardless of the direction of travel. Therefore, it is desirable to construct additional station-service sub nodes (5d and 6d) and define a new service (service D) to separate the representation of a physical two-way service, as seen in Figure 4.10. Service A becomes the eastbound service and can be given a more descriptive name, such as "service A eastbound". Service D, which represents the westbound direction of service A, can be given the name "service A westbound."
4.1.7 Representing branches
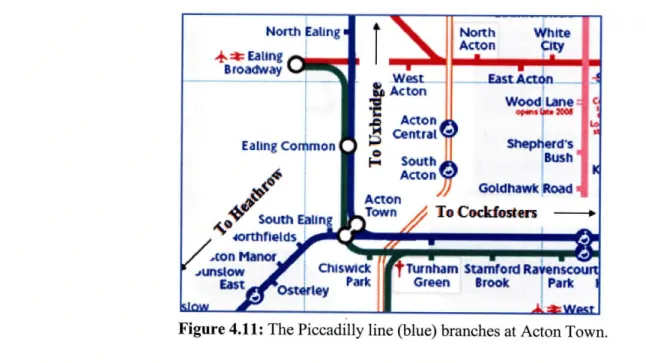
Many LUL services, such as the Piccadilly line, have more than one branch. Some stations are served by only one branch; others are served by multiple branches. For example, only the Heathrow branch of the Piccadilly line serves South Ealing, but both the Heathrow and Uxbridge branches serve Acton Town. In the opposite direction, services from either branch terminate at Cockfosters, the end of the Piccadilly line. Figure 4.11 displays this section of the Piccadilly line.
Figure 4.11: The Piccadilly line (blue) branches at Acton Town.
Every branch is represented as a separate service in the model for the same reasons two-way service is represented with two arcs. Additional station-service sub nodes and transfer arcs are created as necessary so that transfers are modeled correctly.
Piccadilly line services operating on either branch toward Cockfosters eventually travel through the same trunk portion of the Piccadilly line. Thus, a journey from Uxbridge to Cockfosters on the Piccadilly line may be completed without transferring branches or services. Similarly, a transfer-free journey is possible from Heathrow to Cockfosters or from anywhere else along the Piccadilly line to Cockfosters. This is represented by modeling the Piccadilly line as three separate services: one toward Uxbridge, one toward Heathrow, and one toward Cockfosters. A series of directed arcs of Piccadilly line
service toward Cockfosters start at both Uxbridge and Heathrow, sequentially connecting each station along the respective branch until converging at Acton Town. A single series of directed arcs continues from Acton Town to Cockfosters. Conversely, the two branches of the Piccadilly line operating from Cockfosters cannot share the same directed arcs along the trunk portion of the line. Each branch must be represented separately for every station it serves or the algorithm may identify a transfer where one is not necessary.
Representing the branches in this way solves the issues of path generation for any OD pair along the Piccadilly line, and it solves the problems of path description for journeys commencing or terminating in the non-trunk sections of the Piccadilly line. However, for paths both originating and terminating along the trunk section of the Piccadilly line heading away from Cockfosters, the algorithm produces an undesirable result. The text description of the path will instruct passengers to use the Uxbridge branch (or equivalently, the Heathrow branch) when they could actually use either because their journeys do not deviate from the trunk portion of the line.
This issue is most easily handled by keeping a service list for origin-destination pairs having multiple services. If the shortest path for one of these origin-destination pairs uses one of the services in the list, the algorithm can display text instructions that any of the services may be used. This list can be automatically generated from the graph and does not alter the structure of the representation.
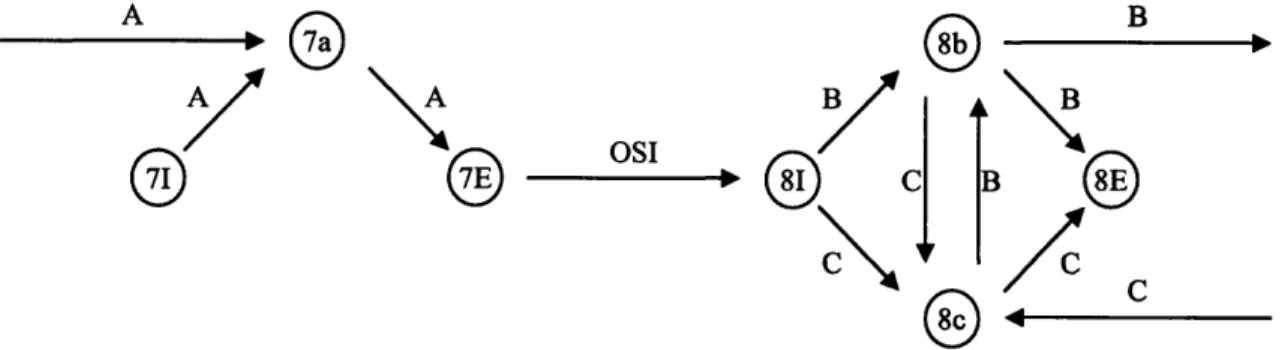
4.1.8 Representing out-of-station interchanges
An out-of-station interchange (OSI) is a transfer from one service to another that differs from an ordinary transfer. As the name implies, an OSI is a transfer that is not conducted solely inside a station. The two stations involved in an OSI, although usually geographically close, are not connected by a common service. To complete an OSI, the passenger must pass through the gate line of one or both stations, and must tap his or her payment device accordingly.
In order to represent the possibility of a transfer between two stations, these stations must be connected with one or more directed arcs in the direction transfers are possible; two directed arcs, one beginning at each station, are necessary between the two stations if an OSI is possible in both directions. A unique service is defined to identify these arcs. The universal OSI service is used whenever an OSI is possible. Since each station is represented by a set of sub nodes rather than a single node, it is important to associate the OSI arcs with the appropriate nodes. If an OSI is possible from station 7 to station 8, then a directed arc of the universal OSI service must be constructed from the egress node of station 7 to the ingress node of station 8, as seen in Figure 4.12. This will enable transfers from every service operating at station 7 to every service operating at station 8. An appropriate value is assigned to this OSI arc to reflect the duration of the transfer. If a transfer is possible in the opposite direction, from station 8 to station 7, then an additional OSI arc is required from the egress node of station 8 to the ingress node of station 7.
A B
OSI
Figure 4.12: A directed arc of service "OSI" represents an out-of-station interchange from station 7 to station 8.
The shortest path algorithm will recognize that a transfer is possible between these two stations and will produce the correct paths under each path choice method. When the algorithm is used as a fares engine to calculate a fare given a sequence of tap-ins and outs, the OSI taps can be treated as intermediate validations in the journey, the intermediate segment being the short OSI leg between stations 7 and 8.
4.1.9 Representing intermediate validators
In the physical network, an intermediate validation may occur whenever a payment device reader is available behind the gate line. Such a device is used to provide information to the fare collection system regarding a passenger's travel behavior. Intermediate validation occurs today in London in a variety of cases including out-of-station interchanges, transitions from the Underground to the DLR, or
transitions from the Underground to tram services. Future fare policy may allow TfL to adjust a given journey's fare based on a passenger's intermediate validation behavior.
At TfL, these payment device readers are known as a passenger validators, or PVs. Similar to a station exit, a PV can be represented in a directed graph as an additional node made accessible from every station-service sub node via one-way arcs. Although a validator node does not represent exit from the system, it must be treated as a terminal node because it cannot be the origin of an arc. If an arc originating at a validator node and terminating at a station-service sub node were added to the graph, transfer durations would no longer be accurately represented; transfers would occur through the costless path provided via the validator node rather than along a transfer arc. A discussion of how intermediate validation behavior may be modeled using this graphical representation is contained in section 4.2.6.
4.1.10 Automated are and node generation
Representing TfL's transit network requires a graph of sub nodes and adjoining arcs for every station. Manually constructing the representation of a station with multiple services is cumbersome. The standard Tube map published by TfL for passengers includes more than 300 stations, most of which are connected by multiple services. This map does not include the growing number of National Rail stations surrounding London that now support fare payment via TfL's fare collection systems.
Manually creating and editing every sub node and arc in the graphical representation of this system is, at best, burdensome and is a likely source of error. Overlooking the creation of one sub node or a single arc may result in the production of erroneous paths and fares. Isolating the source of the error among hundreds, or thousands, of arcs and nodes promises to be time consuming. The ability to quickly alter the network representation following a change in fare policy or a change in the physical network was a primary motivation for automating fare calculation. Thus, the manager's interaction with the system must be as straightforward and intuitive as possible. An algorithm was developed to eliminate the need to
explicitly define each supplementary sub node and arc, which greatly reduces the manger's workload and simplifies data storage. This algorithm utilizes manually defined stations, services, transfer times, and service links to generate a complete graphical representation of the physical network.
Section 5 describes the data required to generate the graph. This includes defining: * each station and its attributes,
* each direction of each branch, of each physical service, and * each physical station-to-station service link.
Each station-to-station service link includes the origin station ID, the destination station ID, the service ID, the duration of travel, and the distance of travel. The algorithm creates all of the sub nodes and arcs to represent the physical network based on the stored data. This process occurs in three steps:
* construct ingress and egress nodes, * construct station-service sub nodes, and * construct transfer and station-to-station arcs.
(a) Construction of ingress and egress nodes
The automated construction of the network begins with the creation of the ingress and egress nodes as follows:
* For every station with entry enabled, an ingress node is created. For every station with exit enabled, an exit node is created. If handicap accessibility mode is enabled, ingress and egress nodes are created only at stations that are handicap accessible and have entry and/or exit enabled.
* For every station with intermediate validation enabled, a validator node is created. * Each of these nodes is assigned the zonal and map coordinate attributes of its associated
station.
* Each node is assigned a unique ID; the first node created is assigned node ID 0 and each additional node is assigned a sequential ID. The node ID is the most important attribute for identifying the node in the graph and it will typically differ from the associated station ID. A two-dimensional array tracks the nodes associated with a given station. The first dimension of the array identifies the station and the second dimension identifies the service (with ingress and egress each treated as unique, automatically defined services). The generated node's ID is stored in this lookup array.
(b) Construction of station-service sub nodes and station-to-station arcs
Once the algorithm has created an ingress, egress, and validator node for every enabled station, it begins construction of the arcs and station-service sub nodes. The algorithm performs the following steps for each service link:
1. If an appropriate station-service sub node does not already exist, create one at the origin station and assign this node the zonal attributes of its station.
2. If an appropriate station-service sub node does not already exist, create one at the destination station and assign this node the zonal attributes of its station.
3. Create an arc, with service ID equal to that of the service link, representing entry from the origin station ingress node to the origin station-service node in (1) above. Assign zero duration and distance values to this arc.
4. Create an arc from the origin station-service node in (1) to the destination station-service node referred to in (2). Assign this arc the service ID, duration, and distance attributes defined for the service link.
5. Create an arc, with service ID equal to that of the service link, from the destination
station-service node referred to in (2) to the destination station egress node. Assign zero duration and distance values to this arc.
(c) Construction of transfer arcs
Once the algorithm has transformed every service link into sub nodes and arcs, it constructs the appropriate transfer arcs as follows:
* For each station with an intermediate validation node, a single one-way arc is constructed from every station-service sub node to the station's intermediate validation node. Each of these arcs is assigned the service ID of the station-service sub node from which it
originates. Each arc is also assigned zero duration and zero distance.
* For every station with two or more station-service sub nodes defined, the algorithm creates two arcs (one in each direction) between each pair of station-service sub nodes.
* Each of these transfer arcs is assigned the service ID of the service from which it is transferring and a distance of zero.
* Each transfer arc is assigned a duration in one of two ways:
* If the stored data specifically defines a duration for this transfer at this station (in the TransferDurations table), the algorithm assigns this value.
* If a duration is not defined for this specific transfer, the algorithm assigns the value of the station's default transfer attribute.
Assigning transfer duration in this way allows transfers between different services at the same station to accurately reflect physical reality. Transferring from District to Circle line service at Westminster station, for example, occurs on the same platform and thus carries a duration approximately equal to the headway between trains of either service. However, transferring from the District line to the Jubilee line at
Westminster has a greater duration because the Jubilee line operates approximately 100 feet below the District line.
The graph is now fully constructed. The algorithm does not alter the stored data during this process, and the graph is regenerated based on the stored data each time the algorithm is initialized. Thus,
although the assignment of station IDs is critical for interaction with the stored data, the actual values of the station IDs are inconsequential because the application generates node IDs sequentially from zero. As
long as the station IDs are consistent throughout the stored data, the arc and node generation algorithm will associate every generated node with the appropriate station and every arc with the appropriate nodes. This allows each stored station ID to take on any unique integer value, which is especially useful when deleting a stored station.
4.2 Path selection
Modeling the LUL network as a directed graph allows the use of a shortest path algorithm to determine journey paths and fares. Shortest path algorithms operate based on the utilization cost assigned to each arc in the graph. It searches for the shortest path from a given origin or root node based on these costs. This research defines cost in different ways depending on the path selection criteria. Four different path selection methods were developed and explored:
* minimum fare path, * minimum transfer path,
* minimum duration (travel time) path, and * minimum distance path.
This section describes each of these methods.
For many OD pairs, multiple paths exist as a solution for each path selection method. Ensuring the algorithm appropriately chooses one path from among a set of feasible solutions requires a process for tie breaking, which section 4.2.5 describes.
TfL may wish to offer multiple fares for a given origin and destination based on more than one path selection method. For example, TfL may charge the fare associated with the minimum duration path by default, but if the minimum fare path's duration is reasonably close to the minimum duration, TfL may offer the cheaper fare to a passenger if he proves he traveled via the cheaper route. Providing such proof will likely require the use of intermediate validation for the production of non-standard travel paths, which section 4.2.6 describes.
4.2.1 Minimum fare path
The minimum fare path is the cheapest possible path from an origin station to a destination station. Cost of travel on each arc in the graph takes on a currency value (in TfL's case GBP)
representing the incremental increase in journey fare if a given arc is utilized. The minimum fare path method seeks the cheapest possible route between the desired OD pair. It ignores the number of transfers, duration, or distance of a journey except for the purpose of tie breaking, as discussed in section 4.2.5. The algorithm always tracks these additional data items for reporting purposes, but they are not primary considerations under the minimum fare path.
In a zonal fare structure such as TfL's, the incremental fare for traveling on an arc depends on several factors including each connected station's zone and the zones already visited during the journey. Thus, the cost assigned to a given arc may change with each visit of the algorithm-this is why a label-correcting algorithm is the most suitable option for automated fare calculation at TfL. The algorithm determines a given arc's fare increment by comparing the applicable fare for the innermost and outermost zones already visited in the journey with the applicable fare for the innermost and outermost zones visited after the addition of the arc.
Consider an arc connecting the two adjacent stations Liverpool Street in Zone 1 and Bethnal Green in Zone 2. The incremental cost of travel on this arc depends on where the passenger's journey began, or more specifically the zones already visited in this journey. If the passenger has only traveled in Zone 1 thus far, the incremental cost of travel on this arc is the difference between a Zone-i -to-Zone-2 fare and a Zone-i -to-Zone-1 fare. However, if the passenger's outermost zone already visited is Zone 3 and innermost is Zone 2, then the cost of travel on this arc is now the difference between a Zone-i -to-Zone-3 fare and a Zone-2-to--to-Zone-3 fare.
The incremental cost of an arc connecting stations in two previously visited zones is costless because the fare does not change. Similarly, after the first arc entering a zone, travel on subsequent arcs between stations of the same zone is costless from the algorithm's perspective. Appropriate tracking of
visited zones is essential for determining the minimum fare path-section 4.3.1 provides an overview of tracking visited zones.
4.2.2 Minimum transfer path
The minimum transfer path is the path from origin to destination requiring the fewest number of inter-service, and inter-branch, transfers. The minimum transfer path method ignores the duration of the journey and all other cost implications; it chooses a path with the fewest possible transfers between
services or branches of services. This path is often not unique, as multiple paths with the minimum number of transfers may exist.
The algorithm determines the incremental cost of travel on an are by whether or not the arc's service ID is the same as the last service used to reach the predecessor node. If the services are the same, travel on this arc is costless; if the services differ, this arc has a cost of one transfer unit. The arcs automatically generated to represent transfers between station-service sub nodes, as described in section 4.1.10, are assigned the service associated with the station-service sub node from which they originate. Thus, the algorithm does not assign a transfer cost when utilizing a transfer arc. The algorithm imposes a transfer cost when the subsequent are is utilized, given the subsequent arc originates at the station-service sub node at which the transfer arc terminates.
4.2.3 Minimum duration (travel time) path
The minimum duration path is the path from origin to destination that has the smallest expected travel time. The total travel time considered includes the expected duration of travel between each station as well as the transfer time between services, when applicable. The incremental cost of travel on any arc is therefore the expected duration of travel on that arc. The duration assigned to an arc connecting station-service sub nodes of two different stations is the expected in-vehicle travel time. Dwell times, station ingress, and station egress times were not explicitly included this research, but slight modifications to the network representation could incorporate all three.
The arcs automatically generated to represent transfers between station-service sub nodes, as described in section 4.1.10, are assigned the expected time for the transfer including walk and any wait time. A transfer made between two services, or between two branches of the same service, must utilize one of these arcs. In doing so, the duration assigned to that arc will be appropriately included in the calculation ofjourney duration.
4.2.4 Minimum distance path
The minimum distance path is the path from origin to destination with the smallest total in-vehicle distance traveled. The incremental cost of an arc connecting two nodes from different stations is the distance traveled between the two stations. Transfer arcs and station ingress and egress arcs are assigned zero incremental distance costs. The algorithm works equally well defining distance as in-vehicle travel distance or as some other measure of distance (map distance, for example). The minimum distance path may not be unique.