Publisher’s version / Version de l'éditeur:
Vous avez des questions? Nous pouvons vous aider. Pour communiquer directement avec un auteur, consultez la première page de la revue dans laquelle son article a été publié afin de trouver ses coordonnées. Si vous n’arrivez pas à les repérer, communiquez avec nous à PublicationsArchive-ArchivesPublications@nrc-cnrc.gc.ca.
Questions? Contact the NRC Publications Archive team at
PublicationsArchive-ArchivesPublications@nrc-cnrc.gc.ca. If you wish to email the authors directly, please see the first page of the publication for their contact information.
https://publications-cnrc.canada.ca/fra/droits
L’accès à ce site Web et l’utilisation de son contenu sont assujettis aux conditions présentées dans le site LISEZ CES CONDITIONS ATTENTIVEMENT AVANT D’UTILISER CE SITE WEB.
Water Loss Specialist Conference, International Water Association [Proceedings],
pp. 32-46, 2007-09-23
READ THESE TERMS AND CONDITIONS CAREFULLY BEFORE USING THIS WEBSITE.
https://nrc-publications.canada.ca/eng/copyright
NRC Publications Archive Record / Notice des Archives des publications du CNRC :
https://nrc-publications.canada.ca/eng/view/object/?id=ecc9c5be-7ce8-4dfe-8d0f-7164211fbd82 https://publications-cnrc.canada.ca/fra/voir/objet/?id=ecc9c5be-7ce8-4dfe-8d0f-7164211fbd82
NRC Publications Archive
Archives des publications du CNRC
This publication could be one of several versions: author’s original, accepted manuscript or the publisher’s version. / La version de cette publication peut être l’une des suivantes : la version prépublication de l’auteur, la version acceptée du manuscrit ou la version de l’éditeur.
Access and use of this website and the material on it are subject to the Terms and Conditions set forth at
Night flow analysis of pilot DMAs in Ottawa
http://irc.nrc-cnrc.gc.ca
N ight flow a na lysis of pilot
DM As in Ot t a w a
N R C C - 5 0 2 9 9
H u n a i d i , O . a n d B r o t h e r s , K .
2 0 0 7 - 0 9 - 2 3
A version of this document is published in / Une version de ce document se trouve dans:
Water Loss Specialist Conference, International Water Association (Bucharest,
Romania, September 23, 2007), pp. 32-46
The material in this document is covered by the provisions of the Copyright Act, by Canadian laws, policies, regulations and international agreements. Such provisions serve to identify the information source and, in specific instances, to prohibit reproduction of materials without written permission. For more information visit http://laws.justice.gc.ca/en/showtdm/cs/C-42
Les renseignements dans ce document sont protégés par la Loi sur le droit d'auteur, par les lois, les politiques et les règlements du Canada et des accords internationaux. Ces dispositions permettent d'identifier la source de l'information et, dans certains cas, d'interdire la copie de documents sans permission écrite. Pour obtenir de plus amples renseignements : http://lois.justice.gc.ca/fr/showtdm/cs/C-42
Water Loss Specialist Conference, International Water Association Bucharest, Romania, 23-26 September 2007
Night Flow Analysis of Pilot DMAs in Ottawa
Osama Hunaidi* and Ken Brothers**
* National Research Council, Institute for Research in Construction, Ottawa, ON, Canada, K1A 0R6 (email: osama.hunaidi@nrc.ca)
** City of Ottawa, Utility Services Branch, 100 Constellation Crescent, Ottawa, ON, Canada, K2G 6J8 (e-mail: Ken.Brothers@ottawa.ca)
Keywords: DMA; residential demand; background leakage
Abstract
Commonly used estimates for background leakage, residential night water demand, and pressure-leakage relationships may not be representative for North American water distribution systems. This paper reports the results of measurements at two pilot DMAs in Ottawa, Canada, that were undertaken to determine actual values. Residential night demand was found to be higher than expected; background leakage was as expected for ductile iron pipes but the leakage-pressure relationship deviated significantly from the expected one.
Introduction
Several important estimates commonly used in flow analysis of district metered areas (or DMAs), namely, background leakage level, residential night water demand, and pressure-leakage relationships are based on data collected primarily from water systems in Europe, mainly the U.K. and Germany. These estimates may not be representative for North American water distribution pipe networks. Pipes in North America are larger in diameter than those in European systems and therefore may have different background losses, leak frequencies and flow rates. Also, patterns of night water demand in North America may be significantly different from those in Europe due to differences in population lifestyle and residential plumping. Representative information about residential night demand, background leakage, and pressure effect is important for determining the level of recoverable leakage in DMAs.
The following are further issues regarding international leakage management methods that need to be assessed when applied to North American systems: (i) IWA’s model for estimating Unavoidable Annual Real Losses (UARL) does not account for soil type, pipe burial depth and climate – these have significant effects for systems in Canada and Northern United States, (ii) the 500 litres per hour threshold for technically undetectable leaks is dated – significant advances in acoustic leak detection equipment were made in recent years which dramatically lowered the threshold, and (iii) the UARL model does not account for different leak survey procedures, e.g., acoustic noise mapping, correlation-based surveys, general listening surveys and detailed listening surveys. Inaccurate UARL may adversely impact the effectiveness of leakage management since it may lead to underestimates of recoverable leakage and unreliable infrastructure leakage indices.
The study reported in this paper was undertaken to measure and anlayse flow and pressure nightlines for residential district-metered areas in Ottawa, Canada. Fieldwork was performed under controlled conditions to: (i) determine average residential night water demand and background leakage levels, (ii) evaluate indirect statistical calculation of residential night demand, (iii) model background leakage, (iv) evaluate analytical procedure(s) for component identification of minimum night flow, (v) verify leakage-pressure relationships, and (vi) compare different leak detection strategies.
In this paper, findings based on fieldwork carried out in Ottawa in summer and fall 2006 are presented and discussed. Details of field tests; instrumentation and software; measurement and analysis procedures are also presented.
Description of Tests
Test Sites
Measurements of night flow and pressure were performed for two temporarily created DMAs in Ottawa over a period of three weeks in summer and fall 2006. The first DMA was in the Orleans area in the eastern part of the City. It has 21.74 km of distribution pipes constructed in the late 1960s, 70s and 80s, of which 84.8% is ductile iron (DI), 7% is polyvinyl chloride (PVC), and 8.2% is copper for service pipes. The number of service connections in this DMA is 1834, the majority of which is residential except for 2 schools and a large retirement home. This DMA includes a large residential complex comprising ~194 apartments. The number of boundary valves that were needed to be closed to completely isolate this DMA was 5. Flow and pressure were also measured in a sub-area (sub-DMA) of this DMA that consisted of ~2.33 km of distribution pipes (almost all is ductile iron) and 298 service connections, all of which are residential except for two schools. The number of boundary valves that was needed to be closed to completely isolate this sub-DMA was 6.
The second DMA was in the Meadowlands area in the west of the City. This is a high-pressure area that is known to have pipe breakage and leakage problems. Pipe high-pressure in the DMA is ~88 psi compared to 50 to 60 psi in surrounding areas. The DMA has 15.31 km of distribution pipes constructed in the 1960s, 70s and 80s, of which 66.6% is cast iron (CI), 15.6% is ductile iron, 10.2% is PVC, and 7.2% copper service pipes. The number of service connections is 909, most of it is residential except for 4 schools and 25 small commercial outlets. Also this DMA includes 2 large residential buildings comprised of 447 apartments. The number of boundary valves that was needed to be closed to completely isolate this DMA was 2, in addition to 20 permanently closed valves that are part of the pressure zone boundary. Flow and pressure were also measured in a sub-area of this DMA that consisted of ~2 km of cast iron pipes and 220 service connections, all of which residential. The number of boundary valves that was needed to be closed to completely isolate this sub-DMA was 17.
Setup of DMAs
District metered areas were isolated at night by temporarily closing all boundary valves between approximately 11:00 PM and 5:00 AM. Water was supplied to the isolated area via an above ground bypass by running a short 2-inch fire hose (~10 m long) connected to taps on either side of a boundary valve inside a manhole (see Figure 1). Above ground, fire hoses were connected to a portable rig that included a flow meter, pressure reducing valve (PRV) and a pressure gauge (see Figures 2 and 3). Pipe pressure was recorded at the DMA’s inlet as well as at a fire hydrant near a point where pressure was approximately equal to average pressure in the whole DMA.
The integrity of boundary valves, i.e., their water tightness, was checked nightly prior to flow measurements. For this, pressure inside DMAs was reduced below that in surrounding areas by at least 20 psi. A valve that’s not tightly seated creates a hissing sound under differential pressure, which is easy to detect with an acoustic listening device attached to a valve key (see Figure 4). Initially, few valves were found to be passing in each DMA.
Tight seating of most passing valves was restored by either closing and opening them several times or by scouring valve seats and discs by creating high velocity flows. In some instances, simply turning valves backward a couple of turns restored proper seating. If turning or scouring did not work, valves were dug out and repaired or the boundary of the DMA was adjusted to exclude them. Following the initial check, only valves that were reopened between night measurements were re-checked. During re-checks, simply turning valves backward a couple of turns restored proper seating of most passing valves.
Instrumentation and Software
All instrumentation and software used for measuring, recording and analyzing flow and pressure were off-the-shelf and commercially available. Water flow into DMAs was measured using one of the following flow meters:
• 3/4-inch Neptune T-10 positive displacement flow meter having a pulse factor of 17.07 pulses per litre; low flow rate of 1 litre per minute at 95% accuracy; and normal operating range between 2.8 and 114 litres per minute at 100% accuracy (±1.5%)
• 2-inch Neptune T-10 positive displacement flow meter having a pulse factor of 1.98 pulses per litre; low flow rate of 3.83 litres per minute at 95% accuracy; and normal operating range between 9.5 and 606 litres per minute at 100% accuracy (±1.5%) • 3-inch Neptune high performance turbine flow meter having a pulse factor of 0.148
pulses per litre; normal operating range between 19 and 1703 litres per minute at 100% accuracy (±1.5%); and maximum intermittent flow rate of 2120 litres per second
Calibration of flow meters was checked at the City’s meter shop prior to field measurements. Magnetic drive signals of flow meters were digitized and recorded using Neptune FloSearch II transmitter inserted between the flow meter and its register and MeterMaster data logger model 100. For comparison, magnetic drive signals of flow meters were also digitized and recorded using MeterMaster Model 50 strap-on magnetic sensor and Radcom model LoLogLL data logger. The register of the flow meter was read manually at the beginning and end of the period over which flow information was recorded and totals based on recorded flows and manual readings were compared as an accuracy check; differences were always found to be negligible.
The MeterMaster logger operates in pulse-count mode only while the Radcom logger can operate in both pulse-count and pulse-interval-timing (PIT) mode. PIT overcomes accuracy problems suffered by simple pulse-counting for measuring low flow with flow meters that have insufficient pulse output. Data files were exported from loggers to spreadsheets for analysis and display.
A Singer model 106-PR 1 ½ inch pressure reducing valve with a low flow stabilizer model 26 was used to control pipe pressures in DMAs.
Test and Analysis Procedures
Residential night water demand and background leakage levels were established based on measurement of flow for sub-DMAs consisting of 200 to 400 residences. Initially, it was planned to perform flow measurements for the sub-DMAs while residential curb-stops were open and closed. However, closing curb stops was unfeasible. Flow measurements into the DI sub-DMA in Orleans were performed in summer and fall 2006 for several nights between approximately 11:00 PM and 5:00 AM. Initial measurements were undertaken in the CI sub-DMA in Meadowlands in fall 2006, but further measurements are planned in 2007. Prior to conducting these measurements, leak detection surveys were undertaken and all detected leaks were repaired.
Because of the small number of residences in the sub-DMAs, it’s very likely that there are several short intervals with no water being consumed by residences (except for plumping losses). Therefore, background leakage level could be assumed to correspond to the minimum value of the measured flow rate. Average residential night water demand was estimated as the average hourly flow rate (calculated over a 2-hour period) minus the minimum flow rate divided by the number of residences in the sub-DMA. Average residential night demand based on these measurements excludes losses from residential plumbing.
Water loss due to leakage in DMAs was evaluated based on minimum moving 60-minute average flow rate of water supplied to DMA minus average flow rate due residential demand based on sub-DMA flow measurement.
It may be possible to indirectly estimate residential night demand by statistically analysing 1-week long (or more) high-resolution measurements of night flow into DMAs. The concept behind this is that unless there are significant fluctuations in pressure, water demand due to leakage in DMAs remains almost constant at night. Therefore, fluctuations in night flow rate of a DMA will be wholly attributable to demand from residences in the district (assuming commercial and industrial use is insignificant or can be accounted for fully). In this statistical method (Creasey et al., 1996), residential demand is assumed to be dominated by a known short fixed-volume event, e.g., toilette flush, and that the average total demand is constant. There was insufficient flow data to apply this method in the current paper.
It may also be possible to analytically determine background and recoverable leakage levels and residential night demand based on DMA night flow measurements under significantly different pipe pressures. Background and recoverable leakage components respond differently to variation in pressure. Assuming that residential night demand is not dependent on pipe pressure (e.g., due to fixed volume toilette flushes), a model can be established to separate these components.
The relationship between leakage level and pipe pressure is based on DMA night flow measurements during at least 3 different pipe pressures before / after leak detection and repair.
Water flow and pipe pressure were recorded with high resolution at 5-second long intervals between approximately 11:00 PM and 5:00 AM. Recorded flow information was used to determine minimum, average and maximum flow rates for stationary 1-mintute long intervals. A 60-minute moving average was also determined. Recorded pressure information was averaged over stationary 1-minute long intervals.
Results and Observations
Background Leakage Level
As can be seen from the flow nightline obtained from a preliminary flow measurement in the ductile iron sub-DMA in Orleans on 7 June 2006 (Figure 5), there were short periods over which the flow rate remained almost constant. This could be taken as an indication that there was no residential demand during these periods and subsequently the background leakage level may be assumed to be equal to the minimum flow rate. It should be noted that this background level includes losses in residential plumping, e.g., leaking toilette tanks and dripping faucets. Background leakage levels of ~6 litres per connection per hour were obtained at pipe pressures of ~49 and 55 psi (34 and 38 m), and ~8 litres per connection per hour at ~73 psi (50 m). These values are approximately four times background leakage levels estimated using the following commonly used equation for systems in good condition (Lambert, 1999):
⎟⎟ ⎠ ⎞ ⎜⎜ ⎝ ⎛ × + + = s d L c 34.8 P level leakage
Background 9.6 0.6 0.016 , in litres per connection per hour
(1)
where P is pipe pressure in psi, cd is service connection density in services per km (taken
equal to 127), and Ls is average length of service connection pipes in metres (assumed to
be 20). For systems in average and poor conditions, commonly used background leakage levels are two and three times those determined using Eq. (1), respectively. The high level of measured background leakage could be due to the use of a lawn-watering sprinkler
and/or high losses from residential plumping. A single sprinkler may consume ~30 litre per minute at 73 psi pressure, which could spuriously raise background leakage by ~6 litres per connection per hour. Based on this, actual background leakage may be equal to 2 litres per connection per hour, which is close to the expected value based on Eq. (1) for a system in good condition.
Significant flow oscillation was observed in the flow nightline obtained from the preliminary flow measurement in the DI sub-DMA in Orleans on 7 June 2006 (Figure 5). It was suspected that this was due to PRV hunting under low flows. To investigate this, flow in the DI sub-DMA in Orleans were re-measured on 26 June 2006 but with the PRV bypassed. During flow measurement, it was observed that the telltale indicator of the flow meter’s register sometimes rotated backwards (for up to 5 seconds), which indicates backflow from the sub-DMA. Most likely, this is as a result of sudden high demand in surrounding areas. Subsequently, minimum flow rates may not correspond to actual background leakage levels. As can be seen from Figure 6, there were several minima below 1 litre per connection per hour but they did not last for more than 5 seconds. For the purpose of estimating background leakage, minimum flow rate that did not last for a period of at least 30 seconds was not considered. Close inspection of Figure 6 indicates that there are three such periods at 1:57, 2:01 and 2:45 AM. There was slight fluctuation in minima over these periods but the average value was consistently equal to ~3.2 litres per connection per hour. This background leakage level at ~88.5 psi (60.7 m) is reasonably close to the value of 2.54 litres per connection per hour obtained using Eq. (1) that is currently used for estimating background leakage for distribution systems in good condition. The measured value is slightly higher because it includes leakage from residential plumping.
To prevent backflow from the DI sub-DMA in Orleans, flow was re-measured on 27 June 2006 while passing through a fully open PRV to introduce some head loss. As a result of this, the telltale of the flow meter’s register never turned backwards; however, on several occasions it almost came to a complete stop. The head loss in the PRV was just sufficient to prevent backflow but not high enough to keep the sub-DMA’s pressure sufficiently below that of surrounding areas when their demand exceeded that in the sub-DMA. Nonetheless, as can be seen from the flow nightline in Figure 7, there were two or more long enough periods over which minimum flow corresponding to background leakage almost remained constant at 2.9 litres per connection per hour. Average pressure in the sub-DMA during these measurements was ~88.5 psi.
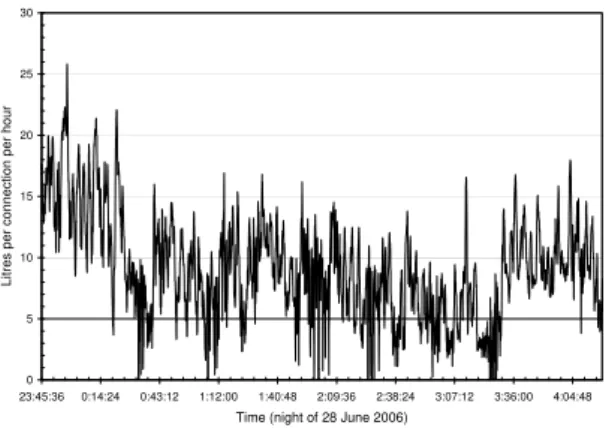
Flow in the DI sub-DMA in Orleans was also re-measured on 28 June 2006 while passing through a check valve and bypassing the PRV. As can be seen from Figure 8, the flow came to a complete stop on several occasions for no more than 5 seconds. However, it can also be seen that there were two or more long enough periods over which minimum flow corresponding to background leakage almost remained constant at ~2.9 litres per connection per hour. Average pressure in the sub-DMA during these measurements was ~88.5 psi (60.7 m). It’s interesting to observe that at 3:30 AM the flow increased suddenly by about 5 litres per connection per hour. This may correspond to flow from a lawn water sprinkler.
Flow measurements in the Orleans DI sub-DMA to establish the relationship between background leakage level and pressure were performed in late October 2006, outside the lawn-watering season. On 17 October, flow was measured under normal operating pressure of ~88 psi, bypassing the PRV. As for similar measurements in June 2006, it was observed that the telltale of the flow meter’s register sometimes almost stopped or rotated backwards, indicating backflow from the sub-DMA. However, as can be seen from the flow nightline (Figure 9), there were two or more long enough periods over which the minimum flow rate corresponding to background leakage almost remained constant at ~3.04 litres per connection per hour. This leakage level is close to the background leakage levels measured in June 2006 at similar pipe pressure.
Flow in the DI sub-DMA in Orleans was also measured on 18 and 19 October 2006 under reduced pressures of ~49 and 67.5 psi, respectively. As can be seen from the flow nightlines (Figures 10 and 11), there were several long enough periods over which minimum flow rate remained almost constant. These levels correspond to background leakage equal to 1.65 and 2.26 litres per connection per hour at 49 and 67.5 psi, respectively. It should be noted that at these reduced pressures, oscillation over the constant flow rate periods was significantly less than that under normal operating pressure. The small oscillation at reduced pressure is mainly due to quantization error related to the limited pulse output of the flow meter used. The higher the pulse output the lower the flow oscillation.
Night flow was measured on 14 November 2006 on preliminary basis in the cast iron sub-DMA in Meadowlands. A boundary valve check revealed 4 noisy valves. Two of these valves (V272 and V036) were fixed by turning them up and down several times; but the other two (V294 and V282) could not be fixed by simple turning. The latter valves were also noisy when fully open which was taken as an indication that there was a leak nearby. This was confirmed later in December; however it was realized that for V294 to be tightly closed it had to be turned down fully and then backwards a couple of turns which was not done at the time of flow measurement. Subsequently, the flow nightline (Figure 12) of the CI sub-DMA with V294 on its boundary may not be representative. As can be seen from the flow nightline, there were several long enough periods over which minimum flow corresponding to background leakage almost remained constant at ~0.5 litres per connection per hour under a pressure of 60 psi and ~6.25 litres per connection per hour under a pressure of 85 psi (note: pressures were measured at the DMA inlet only because of freezing problems). The leakage level at ~85 psi is close to the commonly used estimate for distribution systems in average condition. However, unlike results obtained for the ductile iron sub-DMA in Orleans, the above leakage levels deviate substantially from the expected leakage-pressure power relationship (discussed later) and they may be due to a passing boundary valve.
Subsequently the boundary of the sub-DMA was modified to exclude V294 and V282 and flow was re-measured on 15 November 2006. As can be seen from the corresponding flow nightline (Figure 13), there were several long enough periods over which minimum flow rate corresponding to background leakage almost remained constant at ~0.24, 0.96 and 5.31 litres per connection per hour under inlet pressures of ~49, 62 and 79 psi. These are relatively close to the values obtained on 14 November and it appears that the expected leakage-pressure relationship is not due to passing boundary valves. More flow measurements will be undertaken to verify this.
Residential Night Demand
Average residential night demand based on flow measurements in the ductile iron sub-DMA in Orleans in June and October 2006 is presented in Table 1. Demand levels are shown for three 2-hour periods between 1:00 and 4:30 AM, as well as for the whole 1:00 to 4:30 AM period. Moving 60-minute average residential demand is also shown graphically in Figure 14. Residential demand was calculated by subtracting background leakage level from the flow rate at the inlet of the sub-DMA, averaged over the specified period. Residential demand determined as such does not include losses from residential plumbing—these are included in background leakage levels. The following observations can be made based on results in Table 1 and Figure 14:
• Except for the night of 19 Oct 2006 between 2:00 and 4:00 AM, residential demand was always higher than the commonly used estimate of 1.7 litres per connection per hour based on flow measurements in the 1990s in the U.K. (Report E, 1994). This was most pronounced for demand measured during the lawn-watering season in June with demand up to 3 times the commonly used estimate. For a typical DMA
size of 2000 service connections, this could lead to a spurious recoverable leakage level of up to 113 litres per minute, which is equivalent to about 4 service pipe leaks or a break of a small-diameter distribution pipe.
• Residential night demand varied significantly from night to night in June, most likely as a result of lawn watering at night. For example, demand on the night of 28 June was higher than that on the nights 26 or 27 June by up to 2.14 litres per connection per hour (~87% higher). It rained heavily during the nights of 26 and 27 June and hence most likely fewer (if not none) lawn water sprinklers were turned on.
• In October, which falls outside the lawn-watering season, residential demand varied only slightly from night to night over the same 2-hour period. Generally, the demand was higher than the commonly used estimate of 1.7 litres per connection per hour. However, it fell within the 95% confidence range between 1.79 and 2.89 litres per connection per hour determined based on the assumption of a Binomial distribution of active population, a proportion of 6% active population per hour at night, 13 litres toilette tank, and 3 residents per home (Report E, 1994). The corresponding mean and standard deviation are 2.34 and 0.276 litres per connection per hour, respectively. For a typical DMA size of 2000 service connections, assuming no other sources of error, the 95% confidence range of recoverable leakage level will be an insignificant ±18.4 litre per minute about the level calculated based on a mean residential night demand of 2.34 litres per connection per hour.
• Demand measured on the rainy nights of 26 and 27 June for 1:30-3:30 and 2:00-4:00 AM were higher than corresponding demand in October but it also generally fell within the above 95% confidence limits. A higher proportion of people can be expected to be staying up at night during the summer vacation months (June to August). Hence, even if no sprinklers are used during rainy nights, residential night demand in summer months can be expected to be higher than in the rest of the year.
• Generally, demand decreased from period to period over the same night with the most decrease occurring from 1:00-3:00 to 1:30-3:30 AM. The most decrease outside the lawn-watering season in October was 0.66 litres per connection per hour.
During preliminary flow measurements in the ductile iron sub-DMA in Orleans on 7 June (not listed in Table 1), average flow rate at the sub-DMA’s inlet was ~10.25 litres per connection per hour at ~74 psi pipe average pressure. Background leakage level at this pressure is equal to ~2.55 litres per connection per hour (see Figure 18). Subsequently, actual residential demand is equal to 7.7 litres per connection per hour. This is almost 5 times the commonly used estimate of 1.7 litres per connection per hour. If not accounted for, this would lead to a false recoverable leakage level of ~200 litres per minute for a typical DMA having 2000 service connections. On the level of the whole distribution system, an error in residential demand of +1 or –1 litres per connection per hour corresponds to a leakage level of –1.1 or +1.1%, respectively, for a system the size that of Ottawa’s (having ~2500 km of distribution pipes and ~179,000 service connections). Therefore, for reliable estimation of leakage levels under the condition of variable night demand, it may be necessary that residential demand be measured using AMR simultaneously with water flow into DMAs.
Recoverable Leakage Level
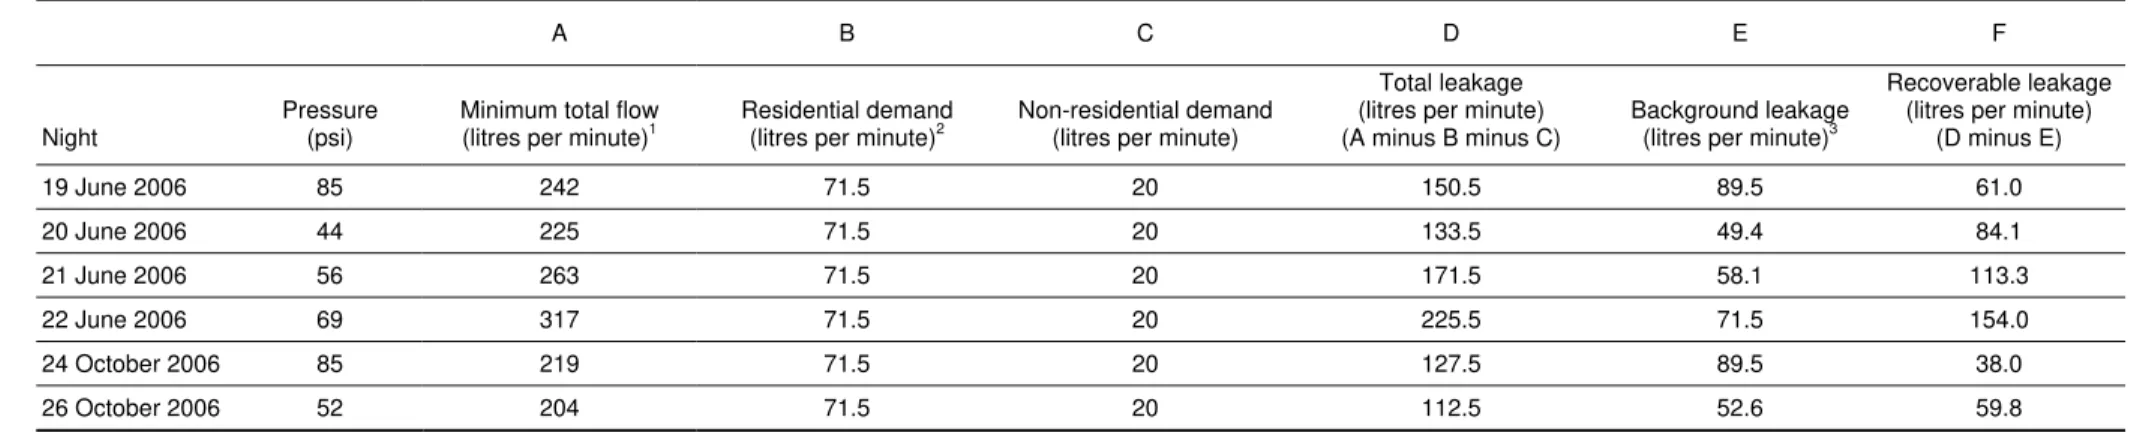
Total and recoverable leakage levels for the ductile iron pipe DMA in Orleans based on flow measurements over six nights in June and October 2006 are listed in Table 2. Total leakage levels were obtained by subtracting residential and non-residential demand from the minimum value of the moving 60-minute average supply flow rate. Residential demand
was taken equal to 2.34 litres per connection per hour. A retirement home was the only major non-residential user in this DMA⎯its average night demand was found to be ~20 litres per minute. Background leakage level was estimated based on a reference value of 3.04 litres per connection per hour at 88 psi and adjusted for pressure using a power relationship with N1 = 1.08. Recoverable leakage level was determined as total leakage
level minus the background leakage level.
As can be seen from Table 2, there is significant variation in the recoverable leakage level from night to night. This was most pronounced during June, which falls in the lawn-watering and vacation season. Leakage level did not vary with pressure as expected, i.e., it did not necessarily increase with pressure. The lowest recoverable leakage level in June occurred on the 19th under the highest pressure level of 85 psi. This unpredictable variation may be attributed to lawn watering at night, with different numbers of active sprinklers on different nights. It rained heavily on 19 June and subsequently fewer sprinklers might have been turned on during the night (new sprinkler systems are fitted with rain sensors). Prior to flow measurements, the DMA was surveyed for leaks but none were detected.
Recoverable leakage levels in the ductile iron pipe DMA in Orleans in late October were lower than those measured in June. Most likely, this is due to the fact that lawns are rarely watered at the time flow was measured in October. Prior to flow measurements in October the DMA was surveyed for leaks but none were detected. The non-zero levels of recoverable leakage obtained in October are most likely due to underestimation of residential demand, or the calculation method itself involving the mixed use of minimum supply flow rate and average demand, or variation of plumbing leakage in residences and major establishments such as schools of which there were 4 in this DMA. This could also explain the unexpected variation of recoverable leakage level with pressure, i.e., its increase with decreasing pressure.
Flow in the cast iron pipe DMA in Meadowlands was preliminarily measured on 16 November 2006 but the flow rate was unexpectedly high and beyond the high limit of the 2-inch positive displacement meter that was used. Initially, as a result of routine boundary valve check, the high flow was suspected to be due to a boundary breach at one of the valves (V269 on Merivale Road) on the permanent boundary of the Meadowlands high-pressure zone. The suspected valve was repaired and flow was re-measured on 23 November 2006 using a 3-inch turbine flow meter. As can be seen from the flow nightline in Figure 15, the flow rate was ~750 litres per minute (~33.2 litres per connection per hour). This is much higher than the expected background leakage level for a system in average condition and average residential night demand equal to ~4 and ~2.34 litres per connection per hour, respectively. Such high flow rate is indicative of a major leakage in the DMA or a breach of its boundary or both.
Boundary valves in the CI DMA in Meadowlands were checked again but all were found to be quiet. Also, an extensive leak survey did not reveal any leaks, except for a minor one at a fire hydrant (H063) that was duly repaired. Subsequently, it was decided to step test the DMA in order to narrow down the area of the leak. For this, the DMA was divided into 5 small areas that could be isolated individually (see Figure 16). The flow step test was performed on the night of 19 December 2006 with the flow monitored between ½ to 1 hour for each step. Step 1 comprised area 1 and step 2 comprised areas 1 and 2, etc. In step 5, the flow increased suddenly (see Figure 17) and this was taken as indication of a major leak in area 5.
Area 5 was then thoroughly surveyed for leaks using the LeakfinderRT sate-of-the-art leak noise correlator (Hunaidi and Wang, 2006) on 27 and 28 December 2006. The correlator detected a leak in a 10-inch cast iron pipe (between fire hydrants H117 and H118 on Meadowlands Drive slightly to the east of Eagle Lane). The position of the leak was confirmed with ground geophones and a chlorine test on a water sample from a
nearby storm water manhole. The leak location was excavated and a full circumferential pipe break was found. Subsequent to the repair of the pipe break, minimum night flow rate in the Meadowlands high-pressure zone, of which the CI DMA is part, dropped by ~600 litres per minute. Further measurements in the DMA to determine residential night demand and background and recoverable leakage levels are scheduled to take place in 2007.
It’s not clear why the above large leak was missed initially by listening surveys. Probably, this may be due to the attenuation of leak sound in the presence of a deep frost layer. The latter increases the effective mass of fire hydrants and in turn reduces their response to vibration.
Leakage-Pressure Relationship
It’s generally assumed that leakage level in water distribution networks varies with pressure to the power N1 (Lambert, 2001). The power coefficient typically ranges from 0.5
to 2.5, depending on the type of pipe material and type and size of leaks. According to Lambert (2001), small background leaks in both metal and plastic pipes are very sensitive to pressure with N1 being close to 1.5; large detectable leaks in plastic pipes also have N1
equal to 1.5 or higher; and large detectable leaks in metal pipes have N1 close to 0.5. For
background leakage measured in the Orleans sub-DMA consisting of ductile iron pipes, N1
was found to be ~1.08 (see Figure 18). This power is significantly lower than the 1.5 value suggested by Lambert (2001). For cast iron pipes, based on preliminary measurements in the Meadowlands sub-DMA, N1 was found to be ~6.5 (see Figure 19). This power
coefficient is very high and it will be verified with further flow measurements in 2007. Leak detection surveys in the ductile iron pipe DMA in Orleans did not uncover any leaks and therefore it was not possible to determine a relationship between recoverable leakage level and pressure. The spurious recoverable leakage level detected on the nights of 20 to 22 June 2006 in this DMA is most likely due to the use of lawn-watering sprinklers. The corresponding N1 is ~1.5 (Figure 20), which may not be unrealistic for
water sprinklers not fitted with pressure regulators.
A relationship between recoverable leakage and pressure for cast iron pipes in the Meadowlands DMA will be determined based on flow measurements planned in 2007.
Analytical Identification of Flow Components
Analytical identification of the components of minimum moving 60-minute flow rates measured on the nights of 20 to 22 June 2006 was first attempted assuming N1 = 1.5 for
background leakage and 0.5 for recoverable leakage. Residential demand was assumed to be constant. Minimum moving 60-minute flow rates were 7.4, 8.6 and 10.4 litres per connection per hour under average pipe pressures of 44, 56.4 and 68.8, respectively. This led to background leakage level, recoverable leakage level and residential demand equal to 14.2, -20 and 15.8 litres per connection per hour, respectively. These are significantly different from measured levels. A second attempt was made using measured N1 values of
1.08 and 1.5 for background and recoverable leakage levels, respectively. This led to background leakage level, recoverable leakage level and residential demand equal to -24.5, 25.3 and 9.5 litres per connection per hour, respectively. These are also significantly different from measured levels.
The failure to analytically identify night flow components is most likely due to the invalidity of the assumption of constant residential demand and / or use of minimum 60-minute flow rate. The latter was ruled out by using average flow rates between 2:00 and 4:00 AM, which also led to unrealistic flow components.
Conclusions
Based on fieldwork performed in Ottawa to measure night flow and pressure in ductile and cast iron pipe DMAs, the following preliminary conclusions can be made:
• Residential night demand was generally higher than the commonly used estimate of 1.7 litres per connection per hour. This was especially the case during the lawn-watering season, with demand being up to 5 times the commonly used estimate. Residential demand in this season varied significantly from night to night. Consequently, leakage levels based on analysis of minimum night flows may be in error by up to ~200 litres per minute for a typical DMA of 2000 service connections. This is equivalent to 8 service pipe leaks or a distribution pipe break. For improved accuracy, automatic meter reading (AMR) of all flow meters in the DMA may be necessary.
• Residential night demand outside the lawn-watering season varied only slightly from night to night. The mean demand was close to the value of 2.34 litres per connection per hour. The latter was estimated based on average volume of a toilet flush of 13 litres, average number of residents per connection of 3 and 6% percent of population active per hour.
• Residential demand generally decreased over night, with the most decrease occurring from the period 1:00-3:00 to 1:30-3:30 AM. The decrease was up to 0.66 litres per connection per hour, outside the lawn-watering season.
• Background leakage level was found to be ~3 litres per connection per hour at ~88 psi pipe pressure for ductile iron pipes, and it varied almost linearly with pressure. For cast iron pipes, it was ~6.25 litres per connection per hour at ~85 psi, which is close to commonly used estimates for distribution systems in average condition. However, the leakage-pressure relationship deviated significantly from the expected one.
• There was significant night-to-night variation during summer in the level of recoverable leakage obtained from the analysis of minimum night flows. In one instance leakage increased with decreasing pipe pressure. This variation is believed to be due to different precipitation conditions on different nights, which affects the number of lawn water sprinklers in use and subsequently water demand. • When no leaks can be revealed by leak detection surveys, the level of recoverable
leakage may not be zero. This can be due to one or more of the following: ineffective leak surveys, underestimation of residential demand, the mixed use of minimum supply flow and average residential demand, variation of plumbing leakage in residences and major establishments such as schools.
• General leak listening surveys during winter may miss some leaks, including large ones. This is probably due to the attenuation of leak sound in the presence of a deep frost layer. The latter increases the effective mass of fire hydrants and in turn reduces their response to vibration.
• The N1 coefficient of the leakage-pressure power relationship for background
leakage in ductile iron pipes was ~1.08, which is significantly lower than the value of 1.5 reported in the literature. For cast iron pipes, N1 was ~6.5, which is much
higher than the expected value of 1.5 and hence it will be verified with further measurements. It was not possible to determine the power coefficient for recoverable leakage in the ductile iron pipes because the selected DMA had no detectable leaks. For cast iron pipes, measurements are scheduled in 2007.
• Poor accuracy was obtained for minimum night flow components calculated analytically using a system of linear algebraic equations based on commonly used
or measured leakage-pressure power coefficients and assuming constant residential night demand. Most likely, this is due to the invalidity of the assumption of constant residential night demand.
References
Creasey, J.D., Joy, J.S., and Oakes A. (1996), Direct Assessment of District Leakage Levels. Report No. PT 1097, Water Research Centre, United Kingdom.
Hunaidi, O., and Wang, A. (2006). “A new System for Locating Leaks in Urban Water Distribution Systems”, International Journal of Management of Environmental Quality, V. 15, No. 4, pp. 450-466.
Lambert, A. (2001), “What Do We Know About Pressure / Leakage Relationships in Distribution Systems?”, Proc. IWA Specialised Conference: System Approach to Leakage Control and Water Distribution Systems Management, Brno, Czech Republic, May 16-18, 2001, pp. 89-96.
Lambert, A. (1999), “A Review of Performance Indicators for Real Losses from Water Supply Systems”, J. Water SRT-Aqua, Vol. 48, pp. 227-237, International Water Supply Association.
Report E (1994). Interpreting Measured Night Flows (Report E), Engineering and Operations Committee, WRc, UK.
Acknowledgements
This study was carried out under collaborative research agreements between the Institute for Research in Construction of the National Research Council Canada (NRC); Communities of Tomorrow Inc. (CT) and the City of Ottawa. Funding for the study was provided by CT and NRC and in-kind contributions were provided by the City of Ottawa. The help of Mr. Alex Wang of the National Research Council; and Ms. Shelley McDonald and Messrs. Joseph Hannewyk and Martin Leclair of the City of Ottawa in planning and carrying out fieldwork is greatly appreciated.
Table 1: Average residential demand (in litres per connection per hour) based on supply flow measurements in Orleans ductile iron pipe sub-DMA
A B C
Minimum flow rate equal to background leakage level including residential
plumping losses1
Average supply to sub-DMA
Average residential demand excluding plumping losses (B minus A) Period 1:00 AM to 4:30 AM 1:00 AM to 3:00 AM 1:30 AM to 3:30 AM 2:00 AM to 4:00 AM 26 June 2006 27 June 2006 28 June 2006 17 Oct 2006 18 Oct 2006 19 Oct 2006 3.2 2.9 2.9 3.04 1.65 2.26 26 June 2006 27 June 2006 28 June 2006 17 Oct 2006 18 Oct 2006 19 Oct 2006 6.38 5.76 8.10 5.15 4.04 4.43 6.65 6.10 8.05 5.59 4.45 4.91 6.32 5.55 7.32 4.98 3.79 4.35 6.09 5.36 7.5 4.84 3.88 3.68 26 June 2006 27 June 2006 28 June 2006 17 Oct 2006 18 Oct 2006 19 Oct 2006 3.18 2.86 5.2 2.11 2.39 2.17 3.45 3.2 5.15 2.55 2.8 2.65 3.12 2.65 4.42 1.94 2.14 2.09 2.89 2.46 4.6 1.8 2.23 1.42 1 Average pressure in the sub-DMA was ~88.5 psi on 26/27/28 June, 88 psi on 17 Oct, 49 psi on 18 Oct, and 67.5 on 19 Oct.
Table 2: Recoverable leakage levels in the ductile iron pipe DMA in Orleans
A B C D E F
Night
Pressure (psi)
Minimum total flow (litres per minute)1
Residential demand (litres per minute)2
Non-residential demand (litres per minute)
Total leakage (litres per minute) (A minus B minus C)
Background leakage (litres per minute)3
Recoverable leakage (litres per minute)
(D minus E) 19 June 2006 85 242 71.5 20 150.5 89.5 61.0 20 June 2006 44 225 71.5 20 133.5 49.4 84.1 21 June 2006 56 263 71.5 20 171.5 58.1 113.3 22 June 2006 69 317 71.5 20 225.5 71.5 154.0 24 October 2006 85 219 71.5 20 127.5 89.5 38.0 26 October 2006 52 204 71.5 20 112.5 52.6 59.8
1 Minimum value of moving 60-minute average flow
2 Based on average demand of 2.34 litres per service connection per hour 3 Based on measured value of 3.04 litres per service connection per hour at 88 psi
Figure 1: Bypass around a closed valve at DMA inlet Figure 2: Above ground water supply bypass
Figure 3: Flow meter and PRV rig Figure 4: Acoustic listening to check boundary valves
0 2 4 6 8 10 12 14 16 18 20 1:55:12 2:24:00 2:52:48 3:21:36 3:50:24
Time (night of 7 June 2006)
Litres per connection per hour
4:19:12 4:48:00
Figure 5: Flow nightline at 5-seconds interval for ductile
iron sub-DMA in Orleans on 7 June 2006
0 2 4 6 8 10 12 14 16 18 0:57:36 1:26:24 1:55:12 2:24:00 Time (night of
Litres per connection per hour
2:52:48 3:21:36 3:50:24
26 June 2006)
Figure 6: Flow nightline at 5-seconds interval for ductile
iron sub-DMA in Orleans on 26 June 2006
0 5 10 15 20 25 0:00:00 0:28:48 0:57:36 1:26:24 1:55:12 2:24:00 2:52:48 3:21:36 3:50:24 4:19:12
Time (night of 27 June 2006)
Litres per connection per hour
Figure 7: Flow nightline at 5-seconds interval for ductile
iron sub-DMA in Orleans on 27 June 2006
0 5 10 15 20 25 30 23:45:36 0:14:24 0:43:12 1:12:00 1:40:48 2:09:36 2:38:24 3:07:12 3:36:00 4:04:48
Time (night of 28 June 2006)
Litres per connection per hour
Figure 8: Flow nightline at 5-seconds interval for ductile
0 2 4 6 8 10 12 14 16 0:46:05 1:14:53 1:43:41 2:12:29 2:41:17 3:10:05 3:38:53 4:07:41 4:36:29
Time (night of 17 October 2006)
Litres per connection per hour
Figure 9: Flow nightline at 5-seconds interval for ductile
iron sub-DMA in Orleans on 17 October 2006
0 10 20 30 40 50 60 70 80 90 0:57:36 1:26:24 1:55:12 2:24:00 2:52:48 3:21:36 3:50:24 4:19:12 4:48:00
Time (night of 18 October 2006)
Litres per connection per hour
Figure 10: Flow nightline at 5-seconds interval for ductile
iron sub-DMA in Orleans on 18 October 2006
0.00 10.00 20.00 30.00 40.00 50.00 60.00 70.00 80.00 90.00 100.00 0:14:24 0:43:12 1:12:00 1:40:48 2:09:36 2:38:24 3:07:12 3:36:00 4:04:48 4:33:36
Time (night of 19 October 2006)
Litres per connection per hour
Figure 11: Flow nightline at 5-seconds interval for ductile
iron sub-DMA in Orleans on 19 October 2006
0.00 10.00 20.00 30.00 40.00 50.00 60.00 70.00 80.00 90.00 100.00 3:07:12 3:21:36 3:36:00 3:50:24 4:04:48 4:19:12 4:33:36
Time (night of 14 November 2006)
Litres per connection per hour
Figure 12: Flow nightline at 5-seconds interval for cast
iron sub-DMA in Meadowlands on 14 November 2006
0.0 10.0 20.0 30.0 40.0 50.0 60.0 70.0 80.0 90.0 3:36:00 3:43:12 3:50:24 3:57:36 4:04:48 4:12:00 4:19:12 4:26:24 4:33:36
Time (night of 15 November 2006)
Li tr es per connect ion per hour
Figure 13: Flow nightline at 5-seconds interval for cast
iron sub-DMA in Meadowlands on 15 November 2006
0.00 1.00 2.00 3.00 4.00 5.00 6.00 7.00 8.00 23:45:54 0:15:54 0:45:54 1:15:54 1:45:54 2:15:54 2:45:54 3:15:54 3:45:54 Time
Litre per connection per hour
Monday night, 26 June 2006 (88 psi) Tuesday night, 27 June 2006(88 psi) Wednesday night, 28 June 2006 (88 psi) Wednesday night, 18 October 2006 (49 psi) Thursday night, 19 October 2006 (67 psi) Tuesday night, 17 October 2006 (88 psi)
Figure 14: Moving 60-minute average residential night
demand in the ductile iron pipe sub-DMA in Orleans
500 550 600 650 700 750 800 850 900 950 1000 2:30 3:00 3:30 4:00 4:30 5:00
Thursday night (23 N ovem ber 2006)
Li tr es per connect ion per hour
1-m inute average flow M oving 60-m inute average flow
Figure 15: Flow nightline in the cast iron pipe DMA in
Meadowlands on 23 November 2006
Figure 16: Zones used for flow step testing in the
cast iron pipe DMA in Meadowlands
85 psi
60 psi
79 psi
62 psi 49 psi
0 100 200 300 400 500 600 700 23:35:33 0:05:33 0:37:46 1:07:46 1:37:46 2:07:46 2:37:46 3:07:46 3:37:46 4:07:46 4:37:46
Time (night of 19 December 2006)
Li
tres
per mi
nute
Step 1 Step 2 Step 3 Step 4 Step 5
Figure 17: Flow nightline of step test in the cast iron pipe
DMA in Meadowlands on 19 December 2006
0 0.5 1 1.5 2 2.5 3 3.5 4 0 20 40 60 80 100 120 Pressure (psi) Background leakage level (litres
per c
onn per hour)
Measured
Power relationship with N1 = 1.08
Figure 18: Background leakage level versus pressure
for ductile iron pipe sub-DMA in Orleans
0 5 10 15 20 25 30 0 20 40 60 80 100 120 Pressure (psi) Background leakage level (litres per conn per hour)
Measured
Power relationship with N1 = 6.5
Figure 19: Background leakage level versus pressure for
cast iron pipe sub-DMA in Meadowlands
0.0 50.0 100.0 150.0 200.0 250.0 300.0 0 20 40 60 80 100 120 Pressure (psi)
Recoverable leakage level
(litres per m
inute)
Measured
Power relationship with N1 = 1.5
Figure 20: Recoverable leakage level versus pressure