EUROPEAN ORGANISATION FOR NUCLEAR RESEARCH (CERN)
Phys. Lett. B 816 (2021) 136204
DOI:10.1016/j.physletb.2021.136204 28th April 2021
Measurement of the associated production of a
Higgs boson decaying into 𝒃-quarks with a vector
boson at high transverse momentum in 𝒑 𝒑
collisions at
√
𝒔 = 13 TeV with the ATLAS detector
The ATLAS Collaboration
The associated production of a Higgs boson with a 𝑊 or 𝑍 boson decaying into leptons
and where the Higgs boson decays to a 𝑏 ¯𝑏 pair is measured in the high vector-boson
transverse momentum regime, above 250 GeV, with the ATLAS detector. The analysed
data, corresponding to an integrated luminosity of 139 fb−1, were collected in proton–proton
collisions at the Large Hadron Collider between 2015 and 2018 at a centre-of-mass energy of √
𝑠 = 13 TeV. The measured signal strength, defined as the ratio of the measured signal yield
to that predicted by the Standard Model, is 0.72+0.39−0.36corresponding to an observed (expected)
significance of 2.1 (2.7) standard deviations. Cross-sections of associated production of a Higgs boson decaying into 𝑏 quark pairs with a 𝑊 or 𝑍 gauge boson, decaying into leptons, are measured in two exclusive vector boson transverse momentum regions, 250–400 GeV and above 400 GeV, and interpreted as constraints on anomalous couplings in the framework of a Standard Model effective field theory.
© 2021 CERN for the benefit of the ATLAS Collaboration.
Reproduction of this article or parts of it is allowed as specified in the CC-BY-4.0 license.
1 Introduction
Since the discovery of the Higgs boson (𝐻) [1–4] with a mass of around 125 GeV [5] by the ATLAS and
CMS Collaborations [6,7] in 2012, the analysis of proton–proton (𝑝 𝑝) collision data at centre-of-mass
energies of 7 TeV, 8 TeV and 13 TeV delivered by the Large Hadron Collider (LHC) [8] has led to precise
measurements of the main production cross-sections and decay rates of the Higgs boson, as well as measurements of its mass and its spin and parity properties. In particular, the observation of the decay of the Higgs boson into 𝑏-quark pairs provided direct evidence for the Yukawa coupling of the Higgs boson to
down-type quarks [9,10]. Finally, a combination of 13 TeV results searching for the Higgs boson produced
in association with a leptonically decaying 𝑊 or 𝑍 boson established the observation of this production
process [9]. A first cross-section measurement as a function of the vector-boson transverse momentum was
also carried out by the ATLAS Collaboration [11].
The previous ATLAS analyses [9,11] in this channel were mainly sensitive to vector bosons with transverse
momentum (𝑝T) in the range of approximately 100–300 GeV. These analyses considered a pair of jets with
radius parameter of 𝑅 = 0.4, referred to as small-radius (small-𝑅) jets, to reconstruct the Higgs boson. For higher Higgs boson transverse momenta, the decay products can become close enough that they cannot be reconstructed with two small-𝑅 jets. To explore this ‘boosted’ regime, the Higgs boson is reconstructed as
a single large-𝑅 jet with 𝑅 = 1.0 [12]. This high-𝑝Tregime is particularly interesting due to its sensitivity
to physics beyond the Standard Model [13].
This Letter presents a measurement of cross-sections for the associated production of a high transverse
momentum Higgs boson that decays into a 𝑏 ¯𝑏pair with a leptonically decaying 𝑊 or 𝑍 boson. The analysis
uses 𝑝 𝑝 collision data recorded between 2015 and 2018 by the ATLAS detector [14] during Run 2 at
the LHC. This dataset corresponds to an integrated luminosity of 139 fb−1. Events are selected in 0-,
1-and 2-lepton channels, based on the number of reconstructed charged leptons, ℓ (electrons or muons), in
the final state to explore the 𝑍 𝐻 → 𝜈𝜈𝑏 ¯𝑏, 𝑊 𝐻 → ℓ𝜈𝑏 ¯𝑏and 𝑍 𝐻 → ℓℓ𝑏 ¯𝑏signatures, respectively. The
Higgs boson is reconstructed as a single large-𝑅 jet and the 𝑏-quarks from its decay as a pair of jets,
reconstructed with a 𝑝T-dependent radius parameter, associated with the large-𝑅 jet and identified as
containing a 𝑏-hadron.
The analysis using small-𝑅 jets and focusing on slightly lower Higgs boson transverse momentum regions
was recently updated with the complete Run 2 dataset [15]. The large-𝑅 jet analysis significantly overlaps
with the small-𝑅 jets analysis. The two results can therefore not be straightforwardly combined.
The dominant background processes after the event selection correspond to the production of 𝑉 + jets, where 𝑉 refers to either a 𝑊 or 𝑍 boson, 𝑡 ¯𝑡, single-top and dibosons. The signal is extracted from a combined profile likelihood fit to the large-𝑅 jet mass, using several signal and control regions. The yield
of diboson production 𝑉 𝑍 with 𝑍 → 𝑏 ¯𝑏is also measured using the same fit and provides a validation of
the analysis. The cross-section measurements are performed within the simplified template cross-section
(STXS) framework [16,17]. These measurements are then used to constrain anomalous couplings in a
2 ATLAS detector
The ATLAS detector [14] at the LHC is a multipurpose particle detector with a forward–backward
symmetric cylindrical geometry and a near 4𝜋 coverage in solid angle.1 It consists of an inner detector
(ID) for tracking surrounded by a thin superconducting solenoid providing a 2 T axial magnetic field, electromagnetic and hadronic calorimeters, and a muon spectrometer. The ID covers the pseudorapidity range |𝜂| < 2.5. It consists of silicon pixel, silicon microstrip, and transition radiation tracking detectors.
An inner pixel layer, the insertable B-layer [19,20], was added at a mean radius of 3.3 cm during the long
shutdown period between Run 1 and Run 2 of the LHC. Lead/liquid-argon (LAr) sampling calorimeters provide electromagnetic (EM) energy measurements with high granularity (|𝜂| < 3.2). The hadronic calorimeter uses a steel/scintillator-tile sampling detector in the central pseudorapidity range (|𝜂| < 1.7) and a copper/LAr detector in the region 1.5 < |𝜂| < 3.2. The forward regions (3.2 < |𝜂| < 4.9) are instrumented with copper/LAr and tungsten/LAr calorimeter modules optimised for electromagnetic and hadronic measurements, respectively. A muon spectrometer with an air-core toroid magnet system surrounds the calorimeters. Three layers of high-precision tracking chambers provide coverage in the range |𝜂| < 2.7, while dedicated fast chambers allow muon triggering in the region |𝜂| < 2.4. The ATLAS trigger system consists of a hardware-based first-level trigger followed by a software-based high-level
trigger [21].
3 Data and Monte Carlo simulation
The data were collected in 𝑝 𝑝 collisions at√
𝑠 = 13 TeV during Run 2 of the LHC. The data sample
corresponds to an integrated luminosity of 139 fb−1 after requiring that all detector subsystems were
operating normally and recording high-quality data [22]. The uncertainty in the combined 2015–2018
integrated luminosity is 1.7% [23], obtained using the LUCID-2 detector [24] for the primary luminosity
measurements. Collision events considered for this analysis were recorded with a combination of triggers
selecting events with high missing transverse momentum or with a high-𝑝T lepton, depending on the
analysis channel. More details of the trigger selection are given in Section5.
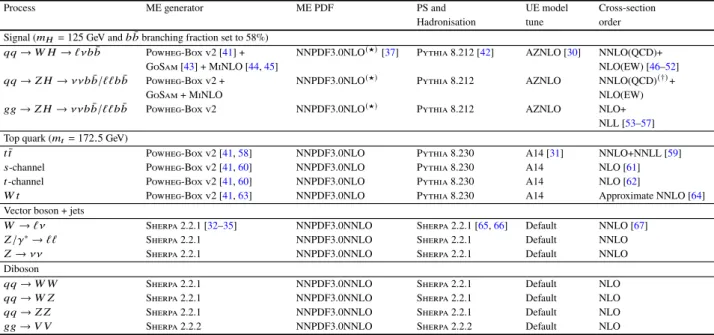
Monte Carlo (MC) simulated event samples processed with the ATLAS detector simulation [25] based on
Geant 4 [26] are used to model the signal and background contributions, except for the multijet production,
whose contribution is estimated with data-driven techniques as detailed in Section6. A summary of all the
signal and background processes with the corresponding generators used for the nominal samples is shown
in Table1. All simulated processes are normalised using the most precise theoretical predictions currently
available of their cross-sections. In addition to the hard scatter, each event was overlaid with additional 𝑝 𝑝
collisions (pile-up) generated with Pythia 8.1 [27] using the ATLAS A3 set of tuned parameters [28] and
the NNPDF23LO [29] parton distribution function (PDF) set. Simulated events were then reconstructed
with the same algorithms as those applied to data and are weighted to match the pile-up distribution observed in the data.
1ATLAS uses a right-handed coordinate system with its origin at the nominal interaction point in the centre of the detector. The
positive 𝑥-axis is defined by the direction from the interaction point to the centre of the LHC ring, with the positive 𝑦-axis pointing upwards, while the beam direction defines the 𝑧-axis. Cylindrical coordinates (𝑟, 𝜙) are used in the transverse plane, 𝜙 being the azimuthal angle around the 𝑧-axis. The pseudorapidity 𝜂 is defined in terms of the polar angle 𝜃 by 𝜂 = − ln tan(𝜃/2). The angular distance is defined as Δ𝑅 ≡
√︁
(Δ𝜂)2+ (Δ𝜙)2. Rapidity is defined as 𝑦 = 0.5 ln[(𝐸 + 𝑝𝑧)/(𝐸 − 𝑝𝑧)] where 𝐸
Table 1: Signal and background processes with the corresponding generators used for the nominal samples. If not specified, the order of the cross-section calculation refers to the expansion in the strong coupling constant (𝛼S). (★) The events were generated using the first PDF in the NNPDF3.0NLO set and subsequently reweighted to the PDF4LHC15NLO set [38] using the internal algorithm in Powheg-Box v2. (†) The NNLO(QCD)+NLO(EW) cross-section calculation for the 𝑝 𝑝 → 𝑍 𝐻 process already includes the 𝑔𝑔 → 𝑍 𝐻 contribution. The 𝑞𝑞 → 𝑍 𝐻 process is normalised using the cross-section for the 𝑝 𝑝 → 𝑍 𝐻 process, after subtracting the 𝑔𝑔 → 𝑍 𝐻 contribution. An additional scale factor is applied to the 𝑞𝑞 → 𝑉 𝐻 processes as a function of the transverse momentum of the vector boson, to account for electroweak (EW) corrections at NLO. This makes use of the 𝑉 𝐻 differential cross-section computed with Hawk [39,40].
Process ME generator ME PDF PS and UE model Cross-section
Hadronisation tune order
Signal (𝑚𝐻= 125 GeV and 𝑏 ¯𝑏 branching fraction set to 58%)
𝑞 𝑞→ 𝑊 𝐻 → ℓ 𝜈𝑏 ¯𝑏 Powheg-Box v2 [41] + NNPDF3.0NLO(★)[37] Pythia 8.212 [42] AZNLO [30] NNLO(QCD)+
GoSam [43] + MiNLO [44,45] NLO(EW) [46–52]
𝑞 𝑞→ 𝑍 𝐻 → 𝜈𝜈𝑏 ¯𝑏/ℓℓ 𝑏 ¯𝑏 Powheg-Box v2 + NNPDF3.0NLO(★) Pythia 8.212 AZNLO NNLO(QCD)(†)+
GoSam + MiNLO NLO(EW)
𝑔𝑔→ 𝑍 𝐻 → 𝜈𝜈𝑏 ¯𝑏/ℓℓ 𝑏 ¯𝑏 Powheg-Box v2 NNPDF3.0NLO(★) Pythia 8.212 AZNLO NLO+
NLL [53–57] Top quark (𝑚𝑡= 172.5 GeV)
𝑡𝑡¯ Powheg-Box v2 [41,58] NNPDF3.0NLO Pythia 8.230 A14 [31] NNLO+NNLL [59]
𝑠-channel Powheg-Box v2 [41,60] NNPDF3.0NLO Pythia 8.230 A14 NLO [61]
𝑡 -channel Powheg-Box v2 [41,60] NNPDF3.0NLO Pythia 8.230 A14 NLO [62]
𝑊 𝑡 Powheg-Box v2 [41,63] NNPDF3.0NLO Pythia 8.230 A14 Approximate NNLO [64]
Vector boson + jets
𝑊→ ℓ 𝜈 Sherpa 2.2.1 [32–35] NNPDF3.0NNLO Sherpa 2.2.1 [65,66] Default NNLO [67]
𝑍/𝛾∗→ ℓℓ
Sherpa 2.2.1 NNPDF3.0NNLO Sherpa 2.2.1 Default NNLO
𝑍→ 𝜈𝜈 Sherpa 2.2.1 NNPDF3.0NNLO Sherpa 2.2.1 Default NNLO
Diboson
𝑞 𝑞→ 𝑊 𝑊 Sherpa 2.2.1 NNPDF3.0NNLO Sherpa 2.2.1 Default NLO
𝑞 𝑞→ 𝑊 𝑍 Sherpa 2.2.1 NNPDF3.0NNLO Sherpa 2.2.1 Default NLO
𝑞 𝑞→ 𝑍 𝑍 Sherpa 2.2.1 NNPDF3.0NNLO Sherpa 2.2.1 Default NLO
𝑔𝑔→ 𝑉 𝑉 Sherpa 2.2.2 NNPDF3.0NNLO Sherpa 2.2.2 Default NLO
For the signal events, the AZNLO [30] model of parton showers and the underlying event (UE) was
used. For the top-quark pair and single-top-quark production processes, the UE model was taken from
the ATLAS A14 [31] set of tuned Pythia 8.1 [27] parameters and for the other backgrounds the default
Sherpa [32–35] tune set was used. For all samples of simulated events, except for those generated using
Sherpa, the EvtGen v1.2.0 program [36] was used to describe the decays of bottom and charm hadrons.
The nominal PDF set used for 𝑊 /𝑍 +jets and diboson processes was NNPDF3.0NNLO [37] while for
the top-quark pair and single-top production the NNPDF3.0NLO [37] set was used. Samples produced
with alternative generators which are used to estimate modelling systematic uncertainties are described in
Section7.
All 𝑞𝑞-initiated signal processes were simulated with up to one additional parton at next-to-leading-order
(NLO) accuracy in QCD using the Powheg-Box v2 [41] and the GoSam [43] generator with the MiNLO
(Multiscale Improved NLO) [44,45] procedure applied, interfaced to Pythia 8.212 for the simulation of
the parton shower (PS), UE and multiple parton interactions. The 𝑔𝑔 → 𝑍 𝐻 contribution was simulated at leading order (LO) in QCD with Powheg-Box v2. The 𝑔𝑔 → 𝑍 𝐻 cross-section process was calculated
at NLO in QCD including soft gluon resummation up to next-to-leading logarithms (NLL) [53–57].
Signal MC events were generated using the NNPDF3.0NLO PDF set and subsequently reweighted to
the PDF4LHC15NLO PDF set [38]. The total inclusive cross-sections for all signal processes (𝑊 𝐻 and
accuracy, including photon-induced contributions calculated with Hawk [39,40].
The nominal top-quark pair production generator was Powheg-Box v2 with real and virtual corrections at NLO accuracy in QCD and interfaced to Pythia 8.230 for the parton showering. The nominal top-quark pair production cross-section is from a resummed NNLO and next-to-next-to-leading logarithm (NNLL)
prediction [59].
Single top-quark production was also generated with Powheg-Box v2 interfaced to Pythia 8.230. The nominal cross-section normalisations for the single top-quark production 𝑠- and 𝑡- processes were estimated
from resummed calculations at NLO, while for the 𝑊 𝑡 process approximate NNLO was used [61,62,64].
At higher orders in QCD, the definition of the 𝑊 𝑡 process can correspond to leading-order top-quark pair production processes. To account for these ambiguities and related interference effects when generating
the processes separately, the diagram removal (DR) subtraction scheme was used [68].
The nominal 𝑊 /𝑍 +jets background samples used Sherpa 2.2.1 [33–35] for the matrix element (ME) and
parton shower with virtual corrections at NLO accuracy for up to two additional jets and at LO for up to
four additional jets using OpenLoops [32,34,35]. In these samples, the simulation of the emission of hard
partons matched with a parton shower was based on the Catani–Seymour subtraction term [32,34,35] and
the multi-parton ME was merged with the parton shower using an improved ckkw matching procedure
extended to NLO accuracy using the MEPS@NLO prescription [66]. The nominal normalisation of this
background was obtained from an NNLO fixed-order estimate [67].
The diboson nominal samples were generated using Sherpa 2.2.1 for the dominant 𝑞𝑞-initiated processes for which zero or one additional parton was calculated at NLO in the ME, while two or three additional partons were included at LO in QCD. The subdominant 𝑔𝑔-initiated processes were generated with Sherpa 2.2.2. For these samples, zero or one additional parton was calculated at LO in the ME. These generators also provided the nominal normalisation for this process.
4 Object reconstruction
Of all the reconstructed 𝑝 𝑝 collision vertices with at least two reconstructed trajectories of charged particles
in the ID (tracks) with 𝑝T > 0.5 GeV, the hard-scattering primary vertex is selected as the one with the
highest sum of squared transverse momenta of associated tracks [69].
Leptons are used for event categorisation as described in Section5. Electrons are reconstructed from
tracks in the ID associated with topological clusters of energy depositions in the calorimeter [70,71]. The
identification criteria closely follow those described in Ref. [9]. Baseline electrons are required to have
𝑝
T >7 GeV and |𝜂| < 2.47, to be isolated from other tracks and energy deposit clusters, to meet loose
likelihood selection criteria based on shower shapes and to satisfy |𝑑0/𝜎 (𝑑0) | < 5 and |𝑧0sin 𝜃 | < 0.5 mm,
where 𝑑0and 𝑧0are the transverse and longitudinal impact parameters defined relative to the primary vertex
position2and 𝜎 (𝑑0) is the 𝑑0uncertainty. Signal electrons are a subset of the baseline electron set and are
selected using a tighter likelihood requirement, which also includes tracking and track–cluster matching variables, and using a tighter calorimeter-based isolation criterion.
Muon candidates are identified by matching ID tracks to full tracks or track segments reconstructed in the muon spectrometer within the inner detector coverage and using only information from the muon
2For the computation of the impact parameters, the beam line is used to approximate the primary vertex position in the transverse
spectrometer outside of that coverage. Muons are required to have 𝑝T >7 GeV and |𝜂| < 2.7 and to have
|𝑑0/𝜎 (𝑑0) | < 3 and |𝑧0sin 𝜃 | < 0.5 mm. Two muon categories are used in the analysis: baseline muons
are selected using the ‘loose’ identification criterion of Ref. [72] and a loose track isolation; signal muons
are required to have |𝜂| < 2.5, to satisfy the ‘medium’ identification criterion [72] and a tighter track-based
isolation criterion.
The low-threshold (7 GeV) baseline leptons are used to define the three main channels requiring exactly zero, one and two leptons. The latter 1- and 2-lepton channels further require at least one signal lepton, with identification and isolation requirements chosen to optimise the suppression of the multijet background.
Signal leptons must have a 𝑝T >27 GeV (except in the 1-lepton muon sub-channel where a 𝑝T > 25 GeV
is used).
Calorimeter jets are reconstructed from noise-suppressed topological clusters (topoclusters) of calorimeter
energy depositions [73], using the anti-𝑘𝑡 algorithm [74] with radius parameter 𝑅 = 1.0 (large-𝑅 jets) or
𝑅= 0.4 (small-𝑅 jets) implemented in FastJet [75]. Small-𝑅 jets are built from topoclusters calibrated at
the electromagnetic scale [76], while large-𝑅 jets are built from topoclusters calibrated at the local hadronic
scale [73]. Large-𝑅 jets are groomed using trimming [77,78] to improve the jet mass resolution and its
stability with respect to pile-up by discarding the softer components of jets that originate from initial-state radiation, pile-up interactions, or the underlying event. This is done by reclustering the constituents of
the initial large-𝑅 jet, using the 𝑘𝑡 algorithm [79, 80], into subjets with radius parameter 𝑅sub = 0.2
and removing any subjet that has a 𝑝T less than 5% of the parent jet 𝑝T. The large-𝑅 jet mass 𝑚Jis
computed using tracking and calorimeter information [81]. A dedicated MC-based calibration, similar to
the procedure used in Ref. [81], is applied to correct the 𝑝Tand mass of the trimmed jets to the particle
level. Large-𝑅 jets are required to have 𝑝T > 250 GeV, 𝑚J> 50 GeV and |𝜂| < 2.0, the last due to tracking
acceptance.
Small-𝑅 jets are used in building the missing transverse momentum and event categorisation. They are calibrated with a series of simulation-based corrections and 𝑖𝑛 𝑠𝑖𝑡𝑢 techniques, including corrections to
account for pile-up energy entering the jet area, as described in Ref. [76]. They are required to have
𝑝
T >30 GeV and |𝜂| < 4.5. To reduce the number of small-𝑅 jets originating from pile-up interactions,
small-𝑅 jets are required to pass the jet vertex tagger (JVT) [82] requirement if they are in the range
𝑝
T <120 GeV and |𝜂| < 2.5 due to tracking acceptance.
Track-jets formed from charged-particle tracks are used to reconstruct a candidate two-body 𝐻 → 𝑏 ¯𝑏
decay within the large-𝑅 jet. Track-jets are built with the anti-𝑘𝑡 algorithm with a variable radius
(VR) 𝑝T-dependent parameter, from tracks reconstructed in the inner detector with 𝑝T > 0.5 GeV and
|𝜂| < 2.5 [83–85]. VR track-jets have an effective jet radius 𝑅effproportional to the inverse of the jet 𝑝T
in the jet finding procedure: 𝑅eff( 𝑝T) = 𝜌/𝑝T, where the 𝜌-parameter is set to 30 GeV. There are two
additional parameters, 𝑅minand 𝑅max, used to set the minimum and maximum cut-offs on the jet radius,
and these are set to 0.02 and 0.4, respectively. Only VR track-jets with 𝑝T >10 GeV, |𝜂| < 2.5 and with at
least two constituents are considered [86]. VR track-jets are matched to the large-𝑅 calorimeter jets via
ghost-association [87]. Track-jets not associated with large-𝑅 jets are also used in the analysis for event
categorisation as described in Section5.
The ‘truth’ flavour labelling of track-jets in simulation is done by geometrically matching the jet to ‘truth’
hadrons, using ‘truth’ information from the generator’s event record. If a 𝑏-hadron with 𝑝Tabove 5 GeV is
found within Δ𝑅 = 0.3 of the direction of the track-jet, the track-jet is labelled as a 𝑏-jet. If the 𝑏-hadron is matched to more than one track-jet, only the closest track-jet is labelled as a 𝑏-jet. If no 𝑏-hadron is found, the procedure is repeated first for 𝑐-hadrons to label 𝑐-jets and then for 𝜏-leptons to label 𝜏-jets. As is the
case for defining a 𝑏-jet, the labelling is also exclusive for 𝑐- and 𝜏-jets. A jet for which no such matching can be made is labelled as a light-flavour jet.
To identify track-jets containing 𝑏-hadron decay products, track-jets are tagged using the multivariate algorithm MV2c10, which exploits the presence of large-impact-parameter tracks, the topological decay
chain reconstruction and the displaced vertices from 𝑏-hadron decays [88,89]. The MV2c10 algorithm is
configured to achieve an average efficiency of 70% for tagging jets labelled as 𝑏-jets in an MC sample of 𝑡 ¯𝑡 events. This requirement has corresponding rejection factors of 9 and 304 for jets labelled as 𝑐-jets and light-flavour jets, respectively, in simulated 𝑡 ¯𝑡 events. The tagging efficiencies per jet flavour are corrected
in the simulation to match those measured in data [86,90,91].
Two additional corrections are applied to the large-𝑅 jets to improve the scale and the resolution of their energy and mass measurements. First, to account for semileptonic decays of the 𝑏-hadrons, the four-momentum of
the closest reconstructed non-isolated muon candidate within Δ𝑅 = min(0.4, 0.04 + 10 GeV/𝑝muonT ) of a
track-jet matched to the large-𝑅 jet by ghost association is added to the calorimeter-based component of the
large-𝑅 jet four-momentum while its expected calorimeter energy deposits are removed [85]. This is known
as the muon-in-jet correction. Non-isolated muons satisfy the ‘medium’ identification criterion [72], but
no isolation or impact parameter criteria are applied. Second, in the 2-lepton channel only, a per-event likelihood uses the full reconstruction of the event kinematics to improve the estimate of the energy of
the 𝑏-jets [92]. The kinematic fit constrains the ℓ+ℓ−𝑏 𝑏 system and the additional small-𝑅 jets in the
event to be balanced in the transverse plane and the dilepton system to the 𝑍 boson mass, by scaling the four-momentum of the objects in the event including the large-𝑅 jet, additional small-𝑅 jets and leptons within their detector response resolutions. The large-𝑅 jet mass is then scaled by the ratio of the energies
after and before the correction. For the event selection detailed in Section5, the large-𝑅 jet mass resolution
improves by 5% to 10% after the first correction (depending on the lepton channel), while the second correction brings an additional improvement in the 2-lepton channel of up to 40%.
The presence of neutrinos in the 𝑊 𝐻 → ℓ𝜈𝑏 ¯𝑏 and 𝑍 𝐻 → 𝜈𝜈𝑏 ¯𝑏 signatures can be inferred from a
momentum imbalance in the transverse plane. The missing transverse momentum 𝑬missT is reconstructed as
the negative vector sum of the momenta of leptons and small-𝑅 jets in the event plus a ‘soft term’ built from
additional tracks associated with the primary vertex [93]. Small-𝑅 jets used for the 𝑬missT reconstruction are
required to have 𝑝T >20 GeV. The magnitude of 𝑬missT is referred to as 𝐸Tmiss. To suppress non-collision
and multijet backgrounds in the 0-lepton channel, an additional track-based missing transverse momentum
estimator, 𝑬missT, trk, is built independently as the negative vector sum of the transverse momenta of all tracks
from the primary vertex.
An overlap removal procedure is applied to avoid double-counting between reconstructed leptons [9],
including hadronically decaying 𝜏-leptons [94], and small-𝑅 jets [92].
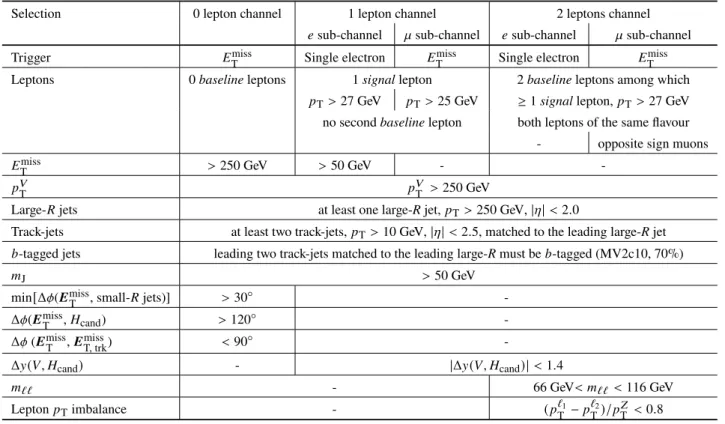
5 Event selection
Events are categorised into the 0-, 1- and 2-lepton channels depending on the number of selected electrons
and muons to target the 𝑍 𝐻 → 𝑣𝑣𝑏 ¯𝑏, 𝑊 𝐻 → ℓ𝜈𝑏 ¯𝑏and 𝑍 𝐻 → ℓℓ𝑏 ¯𝑏signatures, respectively.
The 0-lepton selection is applied to events selected with an 𝐸Tmisstrigger with thresholds varying from 70 to
110 GeV depending on the data-taking period to cope with increasing trigger rates at higher instantaneous luminosities. In the 1-lepton channel, single-electron events are required to be triggered by at least one of
Table 2: Event selection requirements for the boosted 𝑉 𝐻, 𝐻 → 𝑏 ¯𝑏analysis channels and sub-channels.
Selection 0 lepton channel 1 lepton channel 2 leptons channel
𝑒sub-channel 𝜇sub-channel 𝑒sub-channel 𝜇sub-channel
Trigger 𝐸miss T Single electron 𝐸 miss T Single electron 𝐸 miss T
Leptons 0 baseline leptons 1 signal lepton 2 baseline leptons among which
𝑝
T>27 GeV 𝑝T>25 GeV ≥ 1 signal lepton, 𝑝T>27 GeV
no second baseline lepton both leptons of the same flavour
- opposite sign muons
𝐸miss T >250 GeV >50 GeV - -𝑝𝑉 T 𝑝𝑉 T >250 GeV
Large-𝑅 jets at least one large-R jet, 𝑝T>250 GeV, |𝜂| < 2.0
Track-jets at least two track-jets, 𝑝T>10 GeV, |𝜂| < 2.5, matched to the leading large-R jet
𝑏-tagged jets leading two track-jets matched to the leading large-R must be 𝑏-tagged (MV2c10, 70%)
𝑚
J >50 GeV
min[Δ𝜙(𝑬missT , small-𝑅 jets)] >30◦
-Δ𝜙(𝑬miss T , 𝐻cand) >120◦ -Δ𝜙 (𝑬miss T , 𝑬 miss T, trk) <90◦ -Δ𝑦 (𝑉 , 𝐻cand) - |Δ𝑦(𝑉 , 𝐻cand) | < 1.4 𝑚ℓ ℓ - 66 GeV< 𝑚ℓ ℓ<116 GeV Lepton 𝑝Timbalance - ( 𝑝 ℓ1 T − 𝑝 ℓ2 T)/𝑝 𝑍 T <0.8
with time from 24 to 26 GeV. Events in the single-muon channel were triggered using the same 𝐸Tmiss
trigger as used in the 0-lepton channel. Given that muons do not enter in the online 𝐸missT calculation and
that uninstrumented regions affect the coverage of the muon spectrometer, the 𝐸Tmisstriggers translate into a
requirement on the transverse momentum of the lepton and neutrino pair, 𝑝ℓ 𝜈T , which is more efficient in
the analysis phase space than the single-muon triggers. In the 2-lepton channel, the same trigger strategy as in the 1-lepton channel is adopted. The dielectron selection is applied to events triggered by at least one of
the un-prescaled single-electron triggers. The dimuon selection is applied to events triggered by an 𝐸Tmiss
trigger. All triggers used in this analysis are fully efficient for the events selected using the requirements described below.
In all three channels, events are required to contain at least one large-𝑅 jet with 𝑝T > 250 GeV and
|𝜂| < 2.0. To select the Higgs boson candidate, the leading 𝑝T large-𝑅 jet is chosen, at least two VR
track-jets are required to be matched to it by ghost-association, and the two leading ones are required to be
𝑏-tagged. This jet is referred to as the ‘Higgs-jet candidate’ in the following. To avoid the ambiguous cases
of concentric jets, events where the 𝑏-tagged VR track-jets overlap with other VR track-jets, satisfying
Δ𝑅/𝑅s<1 (where Δ𝑅 corresponds to the distance among any pair of VR track-jets and 𝑅
scorresponds to
the smaller radius of the considered pair), are removed. The reconstructed transverse momentum 𝑝𝑉T of the
vector boson corresponds to 𝐸missT in the 0-lepton channel, to the magnitude of the vector sum of 𝑬missT and
the charged-lepton transverse momentum in the 1-lepton channel, and to the transverse momentum of the
2-lepton system in the 2-lepton channel. The 𝑝𝑉T is required to be above 250 GeV in all three channels. The
event selection is detailed in Table2, with further explanations provided below for the non-straightforward
selection criteria.
reduce this background to a negligible level, three dedicated selection criteria are applied. Events are removed if the missing transverse momentum is pointing towards the direction of the Higgs-jet candidate
(Δ𝜙( 𝑬missT , 𝐻cand) > 120
◦
). Events are also removed if the calorimetric 𝑬missT and the track 𝑬T, trkmiss are far
apart (Δ𝜙( 𝑬missT ,𝑬miss
T, trk) < 90 ◦
). The 𝑬missT is required to be isolated from any calorimeter small-𝑅 jet
with transverse momentum in excess of 70 GeV (min[Δ𝜙( 𝑬missT , small-𝑅 jets)] > 30◦). In this case, only
small-𝑅 jets not overlapping with the Higgs-jet candidate within Δ𝑅 = 1.0 are considered.
In the 1-lepton channel, the isolation requirements remove most of the non-prompt lepton background. An
additional 𝐸Tmissrequirement is applied in the electron sub-channel to reduce this background further. In
order to reduce other backgrounds, such as top and 𝑊 +jets production, a further selection on the rapidity
difference between the Higgs-jet candidate and the vector boson is applied (|Δ𝑦 (𝑉 , 𝐻cand) | < 1.4). The
𝑊-boson rapidity is estimated assuming that 𝐸miss
T is the 𝑝Tof the neutrino and the longitudinal momentum
of the neutrino is estimated using the 𝑊 -boson mass constraint. This method leads to a quadratic equation for the longitudinal momentum of the neutrino. In case of two real solutions: the retained solution is the one that minimises the difference between the longitudinal boost of the 𝑊 boson and the Higgs boson. In
case of no real solution, the imaginary part is set to 0.3
In the 2-lepton channel, where two same-flavour leptons are required (in the dimuon sub-channel the two muons are further required to be of opposite sign, in the dielectron case this selection is not applied
due to the comparatively higher charge misidentification), the rapidity difference (|Δ𝑦 (𝑉 , 𝐻cand) | < 1.4)
effectively reduces the main 𝑍 +jets background. A requirement is imposed on the lepton 𝑝Timbalance
(( 𝑝ℓ1 T − 𝑝 ℓ 2 T)/𝑝 𝑍 T
<0.8), which is sensitive to the 𝑍 boson polarisation [95]. Since the 𝑍 boson has different
states of polarisation in the 𝑍 𝐻 signal and the 𝑍 +jets background, this selection further reduces this background.
Since the signal-to-background ratio increases for large Higgs boson transverse momenta [12,96], events
are further split into two 𝑝𝑉T bins with 250 < 𝑝𝑉T <400 GeV and with 𝑝𝑉
T ≥ 400 GeV.
The selection efficiency in the 0-, 1- and 2- lepton channels and two 𝑝𝑉T bins ranges between approximately
6% and 16% for the 𝑊 𝐻 and 𝑍 𝐻 processes where the 𝑊 and 𝑍 bosons decay leptonically and the Higgs boson decays into a pair of 𝑏-quarks. The analysis does not explicitly select 𝜏-leptons but they are accounted for in the case of leptonically decaying 𝜏-leptons in the 1- and 2-lepton channels and hadronically decaying
𝜏-leptons in the 0-lepton channel if they are misidentified as jets.
As discussed in Section1the overlaps between the event selections presented herein and those of Ref. [15]
are non negligible. In the 250 GeV < 𝑝𝑉T < 400 GeV region, approximately 40% of the signal events
are selected by both sets of selections, and the fraction of signal events uniquely selected by the large-𝑅
jet analysis varies between 5% and 30% with increasing 𝑝𝑉T. In the 𝑝𝑉T > 400 GeV region, the overlap
decreases progressively to reach approximately 15% and the unique large-𝑅 jet analysis signal events
increase to 75% at a 𝑝𝑉T of around 700 GeV.
The 𝑡 ¯𝑡 process is a major background in the 0- and 1-lepton channels. For 𝑡 ¯𝑡 events, the 𝑏-tagged track-jets associated with the Higgs-jet candidate are mainly a 𝑏- and a 𝑐-jet (the former from a top-quark decay and the latter from the hadronic 𝑊 boson decay) and therefore the second 𝑏-jet from the other top-quark is often expected to be identified as an additional 𝑏-tagged track-jet not associated with the Higgs-jet candidate. Taking this into account, signal regions (SR) in the 0- and 1-lepton channels are defined by vetoing on
𝑏-tagged track-jets outside the Higgs-jet candidate and control regions (CR), enriched in 𝑡 ¯𝑡 events, are built
from events which fail this veto. The SRs and CRs are accounted for in the same way in the fit, but CRs are dominated by backgrounds and are used to constrain specific background components.
Events in the 0- and 1-lepton channels are further categorised depending on the number of small-𝑅 jets
not matched to the Higgs-jet candidate, i.e. with Δ𝑅(𝐻cand, small-𝑅 jet)>1.0. Two categories are defined:
a high-purity signal region (HP SR) with 0 small-𝑅 jets not matched to the Higgs-jet candidate and a low-purity signal region (LP SR) with ≥ 1 small-𝑅 jets not matched to the Higgs-jet candidate.
The ten SRs and the four CRs are summarised in Table3.
Table 3: Summary of the definition of the analysis regions. Signal enriched regions are marked with the label SR. There are regions with relatively large signal purity (HP SR) and with low purity (LP SR). Background enriched regions are marked with the label CR. The shorthand “add” stands for additional small-𝑅 jets, i.e. number of small-𝑅 jets not matched to the Higgs-jet candidate.
Channel
Categories
250 < 𝑝𝑉T <400 GeV 𝑝𝑉
T ≥ 400 GeV 0 add. 𝑏-track-jets ≥ 1 add.
𝑏-track-jets
0 add. 𝑏-track-jets ≥ 1 add. 𝑏-track-jets 0 add. small-R jets ≥ 1 add. small-R jets 0 add. small-R jets ≥ 1 add. small-R jets 0-lepton HP SR LP SR CR HP SR LP SR CR 1-lepton HP SR LP SR CR HP SR LP SR CR 2-lepton SR SR
6 Background composition and estimation
The background contribution in the SRs is different for each of the three channels. In the 0-lepton channel, the dominant background sources are 𝑍 + jets and 𝑡 ¯𝑡 events with a significant contribution from 𝑊 + jets and diboson production. In the 1-lepton channel, the largest backgrounds are 𝑡 ¯𝑡 and 𝑊 + jets production followed by the single-top background. In the 2-lepton channel, 𝑍 + jets production is the dominant background followed by the 𝑍 𝑍 background. Contributions from 𝑡 ¯𝑡𝑉 and 𝑡 ¯𝑡𝐻 are negligible. The multijet background, due to semileptonic heavy-flavour-hadron decays or misidentified jets, is found to be negligible in the 0-and 2-lepton channels as well as in the 1-lepton muon sub-channel after applying the event selections
described in Section5, as confirmed using data-driven techniques. In the 1-lepton electron sub-channel
its contribution is not neglected. All initial background distribution shapes prior to the fit (described in
Section8), except those for multijet, are estimated from the samples of simulated events. The multijet
shape and normalisation are determined using data.
The 𝑊 /𝑍 +jets simulated event samples are split into 6 categories depending on the ‘truth’ labels of the track-jets ghost-associated to the Higgs-jet candidate: 𝑊 /𝑍 + 𝑏𝑏, 𝑊 /𝑍 + 𝑏𝑐, 𝑊 /𝑍 + 𝑏𝑙, 𝑊 /𝑍 + 𝑐𝑐,
𝑊/𝑍 + 𝑐𝑙 and 𝑊/𝑍 + 𝑙𝑙; in this notation 𝑙 refers to a light-flavour jet.4 The 𝑊 /𝑍 + 𝑏𝑏 fraction corresponds
to approximately 80% of the total 𝑊 /𝑍 +jets background. This categorisation is used in the uncertainties
4When labelling jets in the 𝑉 + jets backgrounds modelling, the labelling of 𝜏-jets is omitted and the negligible 𝜏-lepton
variations of the ratios 𝑉 + 𝑏𝑐/𝑉 + 𝑏𝑏, 𝑉 + 𝑏𝑙/𝑉 + 𝑏𝑏 and 𝑉 + 𝑐𝑐/𝑉 + 𝑏𝑏 to cover uncertainties on the
flavour composition in 𝑉 +jets production, see Section7.
In the statistical analysis described in Section8, the components 𝑊 /𝑍 + 𝑏𝑏, 𝑊 /𝑍 + 𝑏𝑐, 𝑊 /𝑍 + 𝑏𝑙 and
𝑊/𝑍 + 𝑐𝑐 are treated as a single background component denoted by 𝑊/𝑍+HF. The 𝑊+HF and 𝑍+HF
contributions, which together constitute 90% of 𝑉 +jets background, are estimated separately, each with its own normalisation factor determined from the fit to data.
The 𝑡𝑡 production background arises from topologies with decays of 𝑊 bosons into 𝜏-leptons which then decay hadronically in the 0-lepton channel and from 𝑊 bosons decaying into 𝑒/𝜇 in the 1-lepton channel. In the 2-lepton channel the 𝑡𝑡 contribution is much smaller. For the 0- and 1-lepton channels, two independent normalisation factors are considered and left floating in the fit, where they are constrained by the CRs. Single-top production contributes to the 0- and 1-lepton channels and 𝑊 𝑡 production is the dominant process (𝑠- and 𝑡-channel processes amount to less than 1% globally and less than 5% of the single-top contribution).
The diboson background process consists of final states arising mostly from 𝑊 𝑍 and 𝑍 𝑍 events, where a 𝑍 boson decays into a pair of 𝑏-quarks. This process has a topology very similar to that of the signal,
exhibiting a peak in 𝑚Jat the mass of the hadronically decaying vector boson. Although it is a subdominant
contribution, it provides an important reference for validation. Its normalisation is measured simultaneously with the 𝑉 𝐻 signal.
In the 1-lepton channel, the multijet background originating from jets misidentified as leptons and/or due to semileptonic heavy-flavour-hadron decays cannot be neglected. Since MC simulation samples are statistically limited and are not expected to reproduce the multijet production in this corner of the
phase space, it is estimated from a template fit using the data. The 𝑚Jtemplates in the electron and muon
sub-channels are taken from dedicated CRs enriched in multijet background, obtained from the inversion of
the tight lepton isolation requirements and the removal of the 𝐸Tmissrequirement, and after subtraction of the
other backgrounds. The multijet normalisations are estimated in the SRs from a fit to the transverse mass5
distribution separately for the electron and muon sub-channels. The contribution of the multijet background is found to be negligible in the muon sub-channel. In the electron sub-channel it is approximately 2% of the total background, with an uncertainty of 55% estimated mainly from the statistical uncertainty of the transverse mass fit. This contribution and its associated uncertainty are taken into account in the signal extraction fit.
7 Systematic uncertainties
Systematic uncertainties can have an impact on the overall signal and background yields, on the shapes of the jet mass distributions, on the CR to SR extrapolations, and on the relative acceptances between the
HP and LP SRs and between the 𝑝𝑉T bins. Systematic uncertainties are discussed herein for three main
categories: experimental, signal modelling, and background modelling.
5The transverse mass 𝑚
Tof the 𝑊 boson candidate in the event is calculated using the lepton candidate and 𝐸Tmissaccording to
𝑚 T= √︃ 2𝑝ℓT𝐸miss T (1 − cos Δ𝜙(ℓ, 𝐸 miss T )).
7.1 Experimental systematic uncertainties
The uncertainties in the small-𝑅 jet energy scale and resolution have contributions from 𝑖𝑛 𝑠𝑖𝑡𝑢 calibration
studies, from the dependency on the pile-up activity and on the flavour composition of the jets [76]. For
large-𝑅 jets, the uncertainties in the energy and mass scales are based on a comparison of the ratio of
calorimeter-based to track-based measurements in dijet data and simulation, as described in Ref. [81].
The impact of the jet energy scale and resolution uncertainties on the large-𝑅 jet mass are assessed by applying different calibration scales and smearings to the jet observables in the simulation, according to the estimated uncertainties. An absolute uncertainty of 2% is used for the jet energy resolution while a relative uncertainty of 20% is used for the jet mass resolution, consistent with previous studies for trimmed
jets [97,98].
The 𝑏-tagging uncertainties are assessed from the calibration data in various kinematic regions and
separately for 𝑏-, 𝑐-, and light-flavour jets. The uncertainties are then decomposed in each of the
flavour categories into independent components. An additional uncertainty is included to account for the
extrapolation to jets with 𝑝Tbeyond the kinematic reach of the data calibration (the thresholds are 250 GeV,
140 GeV and 300 GeV for 𝑏-, 𝑐- and light-flavour jets, respectively) [86,90,91].
Other experimental systematic uncertainties with a smaller impact are those in the lepton energy and momentum scales, in lepton reconstruction and identification efficiency, and in the efficiency of the triggers. An uncertainty associated with the modelling of pile-up in the simulation is included to cover the difference
between the predicted and measured inelastic cross-sections [99]. The uncertainties in the energy scale
and resolution of the small-𝑅 jets and leptons are propagated to the calculation of 𝐸Tmiss, which also has
additional uncertainties from the scale, resolution and reconstruction efficiency of the tracks used to
compute the soft term, along with the modelling of the underlying event [93].
7.2 Signal modelling systematic uncertainties
The systematic uncertainties that affect the modelling of the signal are derived closely following the
procedure outlined in Refs. [11, 16, 92] and in Refs. [100, 101] for uncertainties specific to STXS.
The systematic uncertainties in the calculations of the 𝑉 𝐻 production cross-sections and the 𝐻 → 𝑏 ¯𝑏
branching fraction are assigned following the recommendations of the LHC Higgs Cross Section Working
Group [56, 57, 102–104]. Acceptance and shape systematic uncertainties are derived to account for
missing higher-order QCD and EW corrections, for PDF+𝛼Suncertainties, and for variations of the PS
and UE models. Factorisation and renormalisation scales are varied by factors of 0.5 and 2. PDF-related
uncertainties are derived following Ref. [38]. The effects of the uncertainties from missing higher-order
EW corrections, PDF+𝛼Sand QCD scale variations on the jet mass shape are negligible. The PS and UE
uncertainty is evaluated by comparing the nominal signal Powheg-Box samples showered by Pythia 8
with alternative samples showered by Herwig 7 [105].
7.3 Background modelling systematic uncertainties
The principal additional modelling uncertainties for the backgrounds that were considered are the following: renormalisation and factorisation scale variations by factors of 0.5 and 2 for higher order in QCD corrections of the matrix element of the process; merging scale variations from multi-leg simulations; resummation scale or parton shower uncertainties; PDF uncertainties; and differences with alternative MC generators.
The impact of these systematic uncertainties in terms of normalisation, shape, acceptance and extrapolation
between analysis regions is then estimated and included in the fit model (described in Section8). Given
that the analysis is based on the fit of the 𝑚Jvariable only, all shape uncertainties are estimated with respect
to this observable.
The normalisations of the 𝑊 /𝑍 +HF backgrounds are free parameters in the fit. They are determined thanks to the use of the jet mass distributions in SRs once 𝑡 ¯𝑡 is constrained from 𝐶 𝑅 enriched in 𝑡 ¯𝑡 events. In addition to scale variations within Sherpa 2.2.1, alternative samples for acceptance and shape variations generated with MadGraph interfaced to Pythia 8 were considered. Finally, variations in the
𝑉+ 𝑏𝑐/𝑉 + 𝑏𝑏, 𝑉 + 𝑏𝑙/𝑉 + 𝑏𝑏 and 𝑉 + 𝑐𝑐/𝑉 + 𝑏𝑏 ratios are accounted for independently for the 𝑊- and
𝑍-boson backgrounds.
For top-quark pair production modelling uncertainties, specific initial-state radiation (ISR) and final-state radiation (FSR) Pythia parameters are used to assess the related systematic uncertainties. In addition to the typical scale variations, alternative NLO samples using the MadGraph5_aMC@NLO and Herwig 7 generators were considered. The 𝑡𝑡 normalisation is free in the fit and mainly constrained in the CRs for the 0- and 1-lepton channel. For the 2-lepton channel it is constrained to its nominal predicted value with an uncertainty of 20%. Due to top decays not fully contained within the large-𝑅 jet, the relative number of events where exactly two and where three or more VR track-jets are ghost-associated to the large-𝑅 jet can modify the large-𝑅 jet mass template. This is accounted for by an additional uncertainty estimated from the impact on the 𝑡𝑡 background template of a 20% variation in this relative ratio.
The normalisations, acceptances and shapes of all single-top production processes are constrained to their predictions within the corresponding uncertainties. For the dominant 𝑊 𝑡 channel, ISR/FSR uncertainties as well as alternative generator samples, Herwig 7 and Madgraph5_aMC@NLO, are considered. Since the 𝑊 𝑡 channel has the same flavour composition and a similar shape in the 0- and 1-lepton channels, the modelling uncertainties were studied in the 1-lepton channel and then propagated to the 0-lepton channel. An associated extrapolation uncertainty is taken into account.
To account for the ambiguities in the interference between 𝑡 ¯𝑡 and single-top production, an alternative sample generated with Powheg-Box interfaced to Pythia 8, using the diagram subtraction (DS) scheme, is
used [68]. The difference between the DS and DR schemes for the 𝑊 𝑡 single-top production is accounted
for as an additional systematic uncertainty.
For diboson production, in addition to the scale variations for acceptance, extrapolation and shape systematic uncertainties, alternative diboson samples were generated using Powheg-Box interfaced to Pythia 8 and the difference with respect to the Sherpa nominal samples was used as an additional uncertainty.
8 Results
The results are obtained from a binned maximum-profile-likelihood fit to the data of the 𝑚Jdistribution,
using all the signal and control regions defined in Section5. The fit is performed using the RooStats
framework [106,107]. Signal and background 𝑚Jtemplates are determined from MC simulation (described
in Section3) in all cases except for the multijet background in the 1-lepton channel, which is extracted
from the data as discussed in Section6.
The likelihood function is constructed from the product of the Poisson probabilities of each bin of the mass distributions and auxiliary terms used to model systematic uncertainties. The likelihood function
60 80 100 120 140 160 180 200 [GeV] J m 50 100 150 200 250 300 350 400 Events / 10 GeV Data =0.72) VH µ ( b b → VH, H =0.91) VZ µ Diboson ( t t Wt W+jets Z+jets Uncertainty 2 × b b → VH, H ATLAS -1 = 13 TeV, 139 fb s 1 large-R jets, SR ≥ 0 lep., 400 GeV < V T p ≤ 250 GeV 60 80 100 120 140 160 180 200 [GeV] J m 0.5 1 1.5 Data/Pred. (a) 60 80 100 120 140 160 180 200 220 240 [GeV] J m 10 20 30 40 50 60 70 80 90 Events / 10 GeV Data =0.72) VH µ ( b b → VH, H =0.91) VZ µ Diboson ( t t Wt W+jets Z+jets Uncertainty 2 × b b → VH, H ATLAS -1 = 13 TeV, 139 fb s 1 large-R jets, SR ≥ 0 lep., 400 GeV ≥ V T p 60 80 100 120 140 160 180 200 220 240 [GeV] J m 0.5 1 1.5 Data/Pred. (b) 60 80 100 120 140 160 180 200 [GeV] J m 100 200 300 400 500 Events / 10 GeV Data =0.72) VH µ ( b b → VH, H =0.91) VZ µ Diboson ( t t Wt W+jets Z+jets Multijet Uncertainty 2 × b b → VH, H ATLAS -1 = 13 TeV, 139 fb s 1 large-R jets, SR ≥ 1 lep., 400 GeV < V T p ≤ 250 GeV 60 80 100 120 140 160 180 200 [GeV] J m 0.5 1 1.5 Data/Pred. (c) 60 80 100 120 140 160 180 200 220 240 [GeV] J m 20 40 60 80 100 120 140 160 Events / 10 GeV Data =0.72) VH µ ( b b → VH, H =0.91) VZ µ Diboson ( t t Wt W+jets Z+jets Multijet Uncertainty 2 × b b → VH, H ATLAS -1 = 13 TeV, 139 fb s 1 large-R jets, SR ≥ 1 lep., 400 GeV ≥ V T p 60 80 100 120 140 160 180 200 220 240 [GeV] J m 0.5 1 1.5 Data/Pred. (d) 60 80 100 120 140 160 180 200 [GeV] J m 10 20 30 40 50 Events / 10 GeV Data =0.72) VH µ ( b b → VH, H =0.91) VZ µ Diboson ( Z+jets t t W+jets Uncertainty 2 × b b → VH, H ATLAS -1 = 13 TeV, 139 fb s 1 large-R jets, SR ≥ 2 lep., 400 GeV < V T p ≤ 250 GeV 60 80 100 120 140 160 180 200 [GeV] J m 0.5 1 1.5 Data/Pred. (e) 60 80 100 120 140 160 180 200 220 240 [GeV] J m 0 2 4 6 8 10 12 14 16 18 20 Events / 10 GeV Data =0.72) VH µ ( b b → VH, H =0.91) VZ µ Diboson ( Z+jets Uncertainty 2 × b b → VH, H ATLAS -1 = 13 TeV, 139 fb s 1 large-R jets, SR ≥ 2 lep., 400 GeV ≥ V T p 60 80 100 120 140 160 180 200 220 240 [GeV] J m 0.5 1 1.5 Data/Pred. (f)
Figure 1: The 𝑚Jpost-fit distributions in (a, b) the 0-lepton, (c, d) 1-lepton and (e, f) 2-lepton signal regions for 2-𝑏-tagged events for (a, c, e) 250 GeV < 𝑝𝑉T <400 GeV and (b, d, f) 𝑝𝑉
T ≥ 400 GeV. The low-purity and high-purity categories in the case of the 0-lepton and 1-lepton channels are merged in this figure. The background contributions after the likelihood fit are shown as filled histograms. The Higgs boson signal (𝑚𝐻 = 125 GeV) is shown as a filled histogram on top of the fitted backgrounds normalised to the signal yield extracted from data (𝜇𝑏 𝑏𝑉 𝐻 = 0.72), and unstacked as an unfilled histogram, scaled by the SM prediction times a factor of two. The size of the combined statistical and systematic uncertainty for the sum of the fitted signal and background is indicated by the hatched band. The highest bin in the distributions contains the overflow. The ratio of the data to the sum of the fitted signal and background is shown in the lower panel.
is described in more detail in Ref. [92]. The parameters of interest (POI) are the signal strengths 𝜇, multiplication factors that scale the expected SM Higgs boson signal, in one or more sub-channels, or the
𝑉 𝑍 process. The signal strength parameters are extracted simultaneously with the overall diboson signal
strength 𝜇𝑏 𝑏𝑉 𝑍 by maximising the likelihood.
Systematic uncertainties are modelled in the likelihood function by parameterised variations of the number of signal and background events, and of the templates through nuisance parameters (NP). Systematic variations of the templates that are subject to large statistical fluctuations are smoothed, and systematic
uncertainties that have a negligible impact on the final results are pruned away region-by-region [108]. NPs
corresponding to most uncertainties discussed in Section7are constrained using Gaussian or log-normal
probability density functions as auxiliary terms in the likelihood. The normalisations of the largest backgrounds, 𝑡 ¯𝑡 (in the 0- and 1-lepton channels), 𝑊 +HF and 𝑍 +HF, are left unconstrained in the fit. The background normalisation factor values from the fit correspond to 0.88 ± 0.10 and 0.83 ± 0.09 for 𝑡 ¯𝑡, in the 0- and 1-lepton channels, respectively; 1.12 ± 0.14 for 𝑊 +HF and 1.32 ± 0.16 for 𝑍 +HF and are also
summarised in Table4. The fit model uses a single normalisation factor for 𝑍 +HF and compatible results
were found when using two different factors for the 0- and 2-lepton channels. To account for the uncertainty
due to the limited size of the MC simulation samples, an NP is used for each bin of the templates [109].
Table 4: Factors applied to the nominal normalisations of the 𝑡𝑡, 𝑊 + HF and 𝑍 + HF backgrounds, as obtained from the likelihood fit. The errors represent the combined statistical and systematic uncertainties.
Process and Category Normalisation factor
𝑡 𝑡0-lepton 0.88 ± 0.10
𝑡 𝑡1-lepton 0.83 ± 0.09
𝑊+ HF 1.12 ± 0.14
𝑍+ HF 1.32 ± 0.16
The 𝑚Jdistributions with signal strengths, background normalisations and all NPs set at their best-fit
values, are shown in Figure1for all three channels’ SRs and in Figure2for the CRs. The low-purity and
high-purity categories in the case of the 0-lepton and 1-lepton channels are merged in Figure1. In all SRs
and CRs a good agreement between the data and the prediction is observed.
For a Higgs boson mass of 125 GeV, when all lepton channels are combined, the observed excess with respect to the background-only hypothesis has a significance of 2.1 standard deviations, to be compared
with an expectation of 2.7 standard deviations. The fitted 𝜇𝑉 𝐻𝑏 𝑏 value is:
𝜇𝑏 𝑏
𝑉 𝐻 = 0.72
+0.39
−0.36= 0.72+0.29−0.28(stat.)+0.26−0.22(syst.).
In this result, the largest uncertainties are statistical and include the impact from the floating background normalisations unconstrained in the fit. The latter component is subdominant. The impact of systematic uncertainties is almost as important as the total statistical uncertainty. The dominant source of systematic
uncertainty is experimental and related to the large-𝑅 jet calibration, in particular in the 𝑚Jresolution,
amounting to an impact of approximately 0.13 on 𝜇𝑏 𝑏𝑉 𝐻. The second largest source of systematic uncertainty
is the background modelling, which overall has an impact of approximately 0.10 on the result. The limited size of the MC simulation samples has a non-negligible impact of 0.09. Systematic uncertainties in the signal modelling have an impact of approximately 0.04, on par with uncertainties related to small-𝑅 jets.
60 80 100 120 140 160 180 200 220 [GeV] J m 20 40 60 80 100 120 140 160 180 200 220 Events / 20 GeV Data =0.72) VH µ ( b b → VH, H t t Wt W+jets Z+jets Uncertainty 2 × b b → VH, H ATLAS -1 = 13 TeV, 139 fb s
1 large-R jets, top CR
≥ 0 lep., 400 GeV < V T p ≤ 250 GeV 60 80 100 120 140 160 180 200 220 [GeV] J m 0.5 1 1.5 Data/Pred. (a) 60 80 100 120 140 160 180 200 220 [GeV] J m 50 100 150 200 250 300 350 400 Events / 10 GeV Data =0.72) VH µ ( b b → VH, H t t t, s+t chan Wt W+jets Multijet Uncertainty 2 × b b → VH, H ATLAS -1 = 13 TeV, 139 fb s
1 large-R jets, top CR
≥ 1 lep., 400 GeV < V T p ≤ 250 GeV 60 80 100 120 140 160 180 200 220 [GeV] J m 0.5 1 1.5 Data/Pred. (b) 60 80 100 120 140 160 180 200 220 240 [GeV] J m 5 10 15 20 25 30 35 Events / 20 GeV Data =0.72) VH µ ( b b → VH, H =0.91) VZ µ Diboson ( t t Wt W+jets Z+jets Uncertainty 2 × b b → VH, H ATLAS -1 = 13 TeV, 139 fb s
1 large-R jets, top CR
≥ 0 lep., 400 GeV ≥ V T p 60 80 100 120 140 160 180 200 220 240 [GeV] J m 0.5 1 1.5 Data/Pred. (c) 60 80 100 120 140 160 180 200 220 240 260 [GeV] J m 20 40 60 80 100 Events / 10 GeV Data =0.72) VH µ ( b b → VH, H t t Wt W+jets Multijet Uncertainty 2 × b b → VH, H ATLAS -1 = 13 TeV, 139 fb s
1 large-R jets, top CR
≥ 1 lep., 400 GeV ≥ V T p 60 80 100 120 140 160 180 200 220 240 260 [GeV] J m 0.5 1 1.5 Data/Pred. (d)
Figure 2: The 𝑚J post-fit distributions in the 𝑡 ¯𝑡 control region for (a, b) the 0-lepton channel and the 1-lepton channel for 250 GeV < 𝑝𝑉T <400 GeV and (c, d) the 0-lepton channel and the 1-lepton channel for 𝑝𝑉
T >400 GeV. The background contributions after the likelihood fit are shown as filled histograms. The Higgs boson signal (𝑚𝐻 = 125 GeV) is shown as a filled histogram on top of the fitted backgrounds normalised to the signal yield extracted from data (𝜇𝑏 𝑏𝑉 𝐻 = 0.72), and unstacked as an unfilled histogram, scaled by the SM prediction times a factor of 2. The size of the combined statistical and systematic uncertainty for the sum of the fitted signal and background is indicated by the hatched band. The highest bin in the distributions contains the overflow. The ratio of the data to the sum of the fitted signal and background is shown in the lower panel.
The breakdown of the systematic uncertainties in the measurement of the signal strength are displayed in
Table5.
The 𝑚Jdistribution is shown in Figure3(a)summed over all channels and signal regions, weighted by their
respective values of the ratio of the fitted Higgs boson signal to background yields and after subtraction of all backgrounds except for the 𝑊 𝑍 and 𝑍 𝑍 diboson processes.
Figure3(b)shows the results of: a fit with six 𝑉 𝐻 POIs measuring the individual signal strengths in each
of the three channels and 𝑝𝑉T bins separately; a three 𝑉 𝐻 POI fit measuring the combined signal strengths
in each channel; a two 𝑉 𝐻 POI fit combining all channels in the two 𝑝𝑉T bins separately; and the overall
single 𝑉 𝐻 POI combination.
Table 5: Breakdown of the absolute contributions to the uncertainty in 𝜇𝑉 𝐻𝑏 𝑏 inclusive in 𝑝 𝑉
T. The sum in quadrature of the systematic uncertainties attached to the categories differs from the total systematic uncertainty due to correlations. The reported values represent the average between the positive and negative uncertainties on 𝜇𝑏 𝑏𝑉 𝐻.
Source of uncertainty Avg. impact
Total 0.372 Statistical 0.283 Systematic 0.240 Experimental uncertainties Small-𝑅 jets 0.038 Large-𝑅 jets 0.133 𝐸miss T 0.007 Leptons 0.010 𝑏-tagging 𝑏-jets 0.016 𝑐-jets 0.011 light-flavour jets 0.008 extrapolation 0.004 Pile-up 0.001 Luminosity 0.013
Theoretical and modelling uncertainties
Signal 0.038
Backgrounds 0.100
↩→ 𝑍 + jets 0.048
↩→ 𝑊 + jets 0.058
↩→ 𝑡 ¯𝑡 0.035
↩→ Single top quark 0.027
↩→ Diboson 0.032 ↩→ Multijet 0.009 MC statistical 0.092 𝜇𝑏 𝑏 𝑉 𝑍 = 0.91 +0.29 −0.23 = 0.91 ± 0.15(stat.)+0.24−0.17(syst.),
in agreement with the SM prediction and the 𝑊±𝑍 differential cross-section measurement performed
by ATLAS at high transverse momentum of the 𝑍 boson (𝑝𝑍T > 220 GeV) in the fully leptonic channel
(𝑊±𝑍 → ℓ0𝜈ℓ+ℓ−) [110]. The simultaneous fit tests the performance of the analysis on an irreducible
background, the known 𝑉 𝑍 production, with a topology similar to the 𝑉 𝐻 signal. With all three lepton channels combined, a significance of 5.4 standard deviations is observed for the 𝑉 𝑍 process, compared to
60 80 100 120 140 160 180 200 [GeV] J m 1 − 0 1 2 3 4 5 6
Events / 10 GeV (Weighted, B-subtracted)
Data =0.72) VH µ ( b b → VH, H =0.91) VZ µ Diboson ( B-only uncertainty ATLAS -1 = 13 TeV, 139 fb s 0+1+2 leptons 1 large-R jets, 2 b-tags ≥ 250 GeV ≥ V T p Weighted by S/B (a) 1 − 0 1 2 3 4 5 bb VH µ Comb. 400 GeV ≥ V T Comb.: p <400 GeV V T p ≤ Comb.: 250 2L 400 GeV ≥ V T 2L: p <400 GeV V T p ≤ 2L: 250 1L 400 GeV ≥ V T 1L: p <400 GeV V T p ≤ 1L: 250 0L 400 GeV ≥ V T 0L: p <400 GeV V T p ≤ 0L: 250 0.36 − +0.39 0.72 −0.28, +0.29 −0.22 +0.26 ( ) 0.52 − +0.55 0.99 ( ) −+0.470.45, −+0.290.26 0.44 − +0.48 0.51 ( ) −+0.330.32, −+0.350.30 0.74 − +0.79 -0.10 ( ) −+0.660.60, −+0.430.43 1.10 − +1.29 -0.24 ( ) −+1.190.96, −+0.510.54 0.84 − +0.92 -0.04 ( ) −+0.770.69, −+0.500.47 0.52 − +0.57 1.00 ( ) −+0.430.42, −+0.370.31 0.75 − +0.84 1.46 ( ) −+0.710.66, −+0.450.36 0.67 − +0.71 0.61 ( ) −+0.520.51, −+0.480.44 0.54 − +0.56 0.77 ( ) −+0.430.42, −+0.340.33 0.83 − +0.88 0.80 ( ) −+0.750.69, −+0.450.45 0.66 − +0.68 0.72 ( ) −+0.500.48, −+0.460.44
Tot. ( Stat., Syst. )
Total Stat. ATLAS Boosted VH, H → bb -1 =13 TeV, 139 fb s (b)
Figure 3: (a) 𝑚Jdistribution in data after subtraction of all backgrounds except for the 𝑊 𝑍 and 𝑍 𝑍 diboson processes. The contributions from all lepton channels and signal regions are summed and weighted by their respective values of the ratio of fitted Higgs boson signal and background yields. The expected contribution of the associated 𝑊 𝐻 and 𝑍 𝐻 production of a SM Higgs boson with 𝑚𝐻 = 125 GeV is shown scaled by the measured combined signal strength (𝜇𝑉 𝐻𝑏 𝑏 = 0.72). The diboson contribution is normalised to its best-fit value of 𝜇
𝑏 𝑏
𝑉 𝑍 = 0.91. The size of the combined statistical and systematic uncertainty is indicated by the hatched band. This error band is computed from a full signal-plus-background fit including all the systematic uncertainties defined in Section7, except for the 𝑉 𝐻/𝑉 𝑍 experimental and theory uncertainties. (b) Fitted values of the Higgs boson signal strength parameter, 𝜇𝑉 𝐻𝑏 𝑏 , for 𝑚𝐻 = 125 GeV for the 0-, 1- and 2-lepton channels in different 𝑝
𝑉
T regions separately and for various combinations.
11%. The statistical uncertainties amount to approximately 60% of the total uncertainty. The dominant source of systematic uncertainty is the background modelling, which has an impact of approximately 0.16 on the result. The source of systematic uncertainty related to the large-𝑅 jet reconstruction follows closely,
with an impact of approximately 0.09 on 𝜇𝑏 𝑏𝑉 𝑍.
The cross-sections in the STXS framework are measured separately for 𝑍 𝐻 and 𝑊 𝐻 production in two 𝑝𝑉T
regions, 250 GeV < 𝑝𝑉T <400 GeV and 𝑝𝑉
T ≥ 400 GeV. The analysis closely follows the strategy used in
Ref. [11]. The expected signal distributions and acceptance times efficiencies for each STXS region are
estimated from the simulated signal samples by selecting events using the generator’s ‘truth’ information,
in particular the ‘truth’ 𝑝𝑉T, denoted by 𝑝
𝑉 , 𝑡
T . The likelihood function used is different from the one used to
extract the 𝜇𝑉 𝐻𝑏 𝑏 and 𝜇
𝑏 𝑏
𝑉 𝑍results presented before. It has multiple POIs corresponding to the cross-sections
in the four regions used in the analysis, multiplied by the 𝐻 → 𝑏 ¯𝑏and 𝑉 → leptons branching fractions.
These four regions, i.e. 𝑍 𝐻 and 𝑊 𝐻 production and the two 𝑝
𝑉 , 𝑡
T bins, are known as reduced stage-1.2
regions in the STXS framework [111]. The sources of systematic uncertainty are identical to those defined
in Section7, except for the theoretical cross-section and branching fraction uncertainties, which are not
included in the likelihood function because they affect the signal strength measurements but not the STXS measurements.
The cross-sections are not constrained to be positive in the fit. The measured reduced stage-1.2 𝑉 𝐻 cross-section times branching fraction 𝜎 × 𝐵 in each STXS bin, together with the SM predictions are
Table 6: Measured and predicted 𝑉 𝐻, 𝑉 → leptons reduced stage-1.2 simplified template cross sections times the 𝐻→ 𝑏 ¯𝑏and 𝑉 → leptons branching fractions with corresponding uncertainties. All possible 𝑍 decays into neutral and charged leptons are considered.
STXS region (|𝑦𝐻| < 2.5, 𝐻 → 𝑏 ¯𝑏) SM prediction [fb] Result (Tot.) (Stat.) (Syst.) [fb]
𝑊 → ℓ𝜈; 𝑝𝑊 , 𝑡 T ∈ [250, 400] GeV 5.83 ± 0.26 3.3 +4.8 −4.6 +3.6−3.4 +3.2−3.0 𝑊 → ℓ𝜈; 𝑝𝑊 , 𝑡 T ∈ [400, ∞] GeV 1.25 ± 0.06 2.1 +1.2 −1.1 +1.0−0.9 +0.6−0.5 𝑍 → ℓℓ, 𝜈𝜈; 𝑝𝑍 , 𝑡 T ∈ [250, 400] GeV 4.12 ± 0.45 1.4 +3.1 −2.9 +2.4−2.3 +1.9−1.7 𝑍 → ℓℓ, 𝜈𝜈; 𝑝𝑍 , 𝑡 T ∈ [400, ∞] GeV 0.72 ± 0.05 0.2 +0.7 −0.6 +0.6−0.5 +0.3−0.3
cross-section prediction in each bin. The measurements are also reported in Table6and are in agreement
with the SM predictions from the signal MC sample. The principal sources of systematic uncertainties are
similar to those affecting 𝜇𝑏 𝑏𝑉 𝐻.
These results complement and extend those obtained by the small-𝑅 jets analysis [15] using the same
dataset. The latter provides a more precise measurement of the cross-section in the inclusive 𝑝𝑉T >250 GeV
region. This can be attributed to the larger acceptance at lower 𝑝𝑉T value, the usage of more precise physics
objects calibration and to the use of multivariate analysis techniques. The results obtained by the two analyses in this region are compatible within one standard deviation.
2 − 0 2 4 6 8 10 12 [fb] lep V B × bb H B ×i σ ATLAS -1 =13 TeV, 139 fb s V = W V = Z leptons → , V b b → Boosted VH, H
Observed Tot. unc. Stat. unc. Expected Theo. unc.
< 400 GeV W,t T 250 < p W,t > 400 GeV T p < 400 GeV Z,t T 250 < p Z,t > 400 GeV T p 0 1 2 Ratio to SM
Figure 4: Measured 𝑉 𝐻 reduced stage-1.2 simplified template cross-sections times the 𝐻 → 𝑏 ¯𝑏and 𝑉 → leptons branching fractions.
9 Constraints on anomalous Higgs boson interactions
The STXS results presented in Section8are interpreted in an effective field theory approach where the
scale of new physics is significantly larger than the SM electroweak scale so as to affect the measured observables at the LHC only through effective interactions among SM particles.


![Table 7: Wilson coefficients and their corresponding dimension-6 operators in the Warsaw formulation considered in this analysis [112, 114]](https://thumb-eu.123doks.com/thumbv2/123doknet/14006961.456285/20.892.326.589.199.581/wilson-coefficients-corresponding-dimension-operators-formulation-considered-analysis.webp)