HAL Id: cirad-00845626
http://hal.cirad.fr/cirad-00845626
Submitted on 17 Jul 2013
HAL is a multi-disciplinary open access
archive for the deposit and dissemination of
sci-entific research documents, whether they are
pub-lished or not. The documents may come from
teaching and research institutions in France or
abroad, or from public or private research centers.
L’archive ouverte pluridisciplinaire HAL, est
destinée au dépôt et à la diffusion de documents
scientifiques de niveau recherche, publiés ou non,
émanant des établissements d’enseignement et de
recherche français ou étrangers, des laboratoires
publics ou privés.
Genetic diversity and population structure of an insular
tree, Santalum austrocaledonicum in New Caledonian
archipelago
L. Bottin, D. Verhaegen, J. Tassin, I. Olivieri, A. Vaillant, J.M. Bouvet
To cite this version:
L. Bottin, D. Verhaegen, J. Tassin, I. Olivieri, A. Vaillant, et al.. Genetic diversity and population
structure of an insular tree, Santalum austrocaledonicum in New Caledonian archipelago. Molecular
Ecology, Wiley, 2005, 14, pp.1979-1989. �cirad-00845626�
Molecular Ecology (2005) 14, 1979–1989 doi: 10.1111/j.1365-294X.2005.02576.x
Blackwell Publishing, Ltd.
Genetic diversity and population structure of an insular tree,
Santalum austrocaledonicum
in New Caledonian
archipelago
L . B O T T I N ,* D . V E R H A E G E N ,* J . T A S S I N ,*† I . O L I V I E R I ,‡ A . V A I L L A N T* and J . M . B O U V E T*
*CIRAD, Département Forêt, Unité de Recherche ‘Diversité Génétique et Amélioration des Espèces Forestières’, campus de Baillarguet TA 10C, 34398, Montpellier cedex 5, France, †IAC, Institut Agronomique Néo-Calédonien B.P. 73, 98890, Païta, Nouvelle-Calédonie,
‡Université Montpellier 2, cc065, Institut des Sciences de l’Evolution de Montpellier, Place Eugène Bataillon, 34095 Montpellier cedex 05, France
Abstract
We present a study of the genetic diversity and structure of a tropical tree in an insular system. Santalum austrocaledonicum is endemic to the archipelago of New Caledonia and
is exploited for oil extraction from heartwood. A total of 431 individuals over 17 populations were analysed for eight polymorphic microsatellite loci. The number of alleles per locus ranged from 3 to 33 and the observed heterozygosity per population ranged from 0.01 in Maré to 0.74 in Ile des Pins. The genetic diversity was lowest in the most recent islands, the Loyautés, and highest in the oldest island, Grande Terre, as well as the nearby small Ile des Pins. Significant departures from panmixia were observed for some loci–population combinations (per population F
IS = 0 – 0.03 on Grande-Terre and Ile des Pins, and 0 – 0.67 on
Loyautés). A strong genetic differentiation among all islands was observed (F
ST = 0.22), and
the amount of differentiation increased with geographic distance in Iles Loyauté and in Grande Terre. At both population and island levels, island age and isolation seem to be the main factors influencing the amount of genetic diversity. In particular, populations from recent islands had large average F
IS that could not be entirely explained by null alleles or a
Wahlund effect. This result suggests that, at least in some populations, selfing occurred extensively. Conclusively, our results indicate a strong influence of insularity on the genetic diversity and structure of Santalum austrocaledonicum.
Keywords: conservation, gene flow, insularity, nuclear microsatellites, population genetic structure, sandalwood
Received 28 September 2004; revision received 12 January 2005; accepted 8 March 2005
Introduction
Island systems have long fascinated biologists, in particular since Darwin’s theory of evolution by natural selection led to consider them as ‘evolutionary laboratories’ (Darwin 1859). Islands are strongly attractive environments for studying evolution for various reasons: they present discrete entities; despite their small size, they contain a variety of habitats; and they are often geologically dynamic (Emerson 2002). From a genetic point of view, at the within-island level, populations have been characterized as depauperate,
because of possible recency of the founding event, isolation from source population, and stochastic processes due to their limited size (Carlquist 1980; Crawford et al. 1987, 1988, 1990; Brauner et al. 1992; Elisens 1992; Kwon & Morden 2002). At the among-island level, the presence of oceanic barriers restricts gene flow between populations. Hence populations from different islands are expected to be strongly differentiated, at least at neutral loci.
Although general expectations exist on the impact of island systems on genetic diversity structuring, especially those concerning natural selection and random drift (Barton 1989), empirical evidence is still lacking to confirm or attenuate the general expected pattern on plant species. In particular, the genetic structure of forest tree species is poorly documented in fragmented habitats (Savolainen
Correspondence: L. Bottin, Fax: 04 67 59 37 33; E-mail: bottin@cirad.fr
1980 L . B O T T I N E T A L .
& Kuittinen 2000) and archipelagos (Sheely & Meagher 1996). However there is an increasing number of studies looking for genetic effects in other plants of recent, anthro-pogenic, habitat fragmentation (e.g. Ellstrand & Elam 1993; Gustafsson 2000; Young & Clarke 2000). In most cases, a loss of genetic variability and increased genetic dif-ferentiation of subpopulations through drift are predicted and have been found in some systems (Young et al. 1996; Newman & Pilson 1997; Young & Clarke 2000). Hamrick
et al. (1992) and Hamrick & Godt (1996) studied the genetic diversity in continental forest tree species and underlined the factors influencing differentiation between populations (mating system, life history, distribution area, etc.), but did not consider the influence of insularity (e.g. isolation and size of populations).
In this study we address a number of questions related to the genetic diversity patterns of an insular forest tree species, Santalum austrocaledonicum (sandalwood) in the archipelago of New Caledonia. Santalum austrocaledonicum
is, like all Santalaceae (Malécot et al. 2004) a hemiparasitic forest tree species (Nasi & Ehrhart 1996) endemic to New Caledonia and Vanuatu. It reaches 8 m in height and 30 cm in trunk diameter. It grows in lowlands, preferentially in open areas (Quémin 1988; Ehrhart 1998). As a hemiparasitic plant species, it cannot grow out of the vicinity of other species, particularly nitrogen-fixing species like Acacia
and Casuarina (Quémin 1988; Radomiljac & McComb 1997; Ehrhart 1998). It occurs on all islands of the archipelago at altitudes lower than 200 m (Quémin 1988) as isolated trees or patches of trees of various sizes. Sandalwood reproduc-tion is still poorly documented. The seeds are fleshy and small (about 1 cm) and seem to be disseminated by fru-givorous birds (Columba vitiensis was seen eating fruits) that can travel among islands (Gibbs et al. 2001), and potentially bats (Cox et al. 1991). Santalum austrocaledonicum has been one of the most exploited sandalwood species since the 19th century. Essential oils extracted from heartwood are used in medicine and the perfume industry. Still exploited, some populations, particularly those of the Iles Loyauté, are seriously threatened.
Using eight microsatellite markers specifically devel-oped for the species studied, we compared the pattern of genetic diversity among islands of the archipelago. We then tried to relate the amount of genetic diversity to the size and isolation of islands, and to look for isolation-by-distance patterns among and within islands. We also asked whether there is any evidence for an impact of the last maxi-mum glaciations on the structure of the genetic diversity. The New Caledonia archipelago is a good system to address these questions, as it consists of six islands of various sizes and at various distances from the largest and oldest of them, Grande-Terre. Each island is large enough that it can itself be subdivided into a few geographic regions.
Material and methods
Sampling methodology, DNA extraction and genetic
analysis
Leaves of Santalum austrocaledonicum were collected on individuals growing in natural stands throughout the different islands: Grande Terre (island size: 16 350 km2), Ile
des Pins (152 km2), Iles Loyauté (Ouvéa (132 km2), Lifou
(1196 km2), Maré (650 km2)) (Fig. 1). Population sampling
areas are shown in Table 1. On Grande Terre, the largest island, all known populations were sampled. These popu-lations were far from each other (at least 25 km) and had a small number of individuals so that the sampling was exhaustive. Ouen Toro was an exception as it was densely populated, so in this population individuals sampled were only a subset of the total population. Only populations with more than 10 individuals were conserved for the genetic analysis: Pindaï, Malhec, Païta, Hienghène, Tiéa and Ouen Toro. Hienghène was the only population known on the east coast, where the climate is wetter and the vegetation more luxurious than on the west coast.
On other islands, the situation was quite different: indi-viduals were scattered over the whole area, so like in Ouen Toro, the samples, collected everywhere in the islands, rep-resented a subset of the total population. In order to have population areas more comparable with those of Grande Terre, and to avoid a potential effect of substructuring on the structure indices, we tried to determine subpopulations in these islands according to the spatial distribution of indi-viduals. Samples from Loyauté islands were divided in three populations: north (N), midlands (M) and south (S) for Ouvéa and Lifou, north (N), southeast (SE) and southwest (SW) for Maré. Ile des Pins was subdivided into two areas, north (N) and south (S).
Leaves were collected between February 1998 and November 2003, but each individual, identified by its geographical coordinates, was only sampled once. Leaf specimens were placed in sealed plastic bags containing silica gel, until DNA extraction. Total DNA was extracted from 100 mg of dry leaf material using a MATAB method derived from Bousquet et al. (1990), with one additional chloroform– isoamyl alcohol (24:1) extraction. The genetic analysis was done using eight nuclear microsatellites: mSaCIRE09,
mSaCIRH09, mSaCIRG01, mSaCIRH11, mSaCIRG10,
mSaCIRF04, mSaCIRF10 and mSaCIRH10, designed speci-fically for Santalum austrocaledonicum. Their characteristics and the methods used to obtain them are described else-where (Bottin et al. in press).
Selection of individuals for the analysis
As sandalwood can reproduce by suckering (Quémin 1988), sampling of several individuals in a restricted area
S A N D A L W O O D ’ S G E N E T I C D I V E R S I T Y A N D S T R U C T U R E 1981
runs the risk of collecting the same genetic individuals. In order to avoid this problem we excluded from the following analyses all individuals (but one) with the same genotypes that were less than 100 m apart. We first identified similar genotypes by constructing neighbour-joining (NJ) trees for each population with Darwin 4-4 (Perrier & Jaquemoud-Collet 2003). We then examined their localization on geo-graphical maps where we had placed all the individuals using mapinfo software. Out of 541 individuals, about 100 were eliminated this way, suggesting that suckering occurs frequently. The total number of individuals analysed per population is presented in Table 1.
Analysis of genetic diversity and departure from random
mating
Allele frequencies, observed number of alleles per locus (A), observed heterozygosity (HO) and expected hetero-zygosity (HE) (Nei 1978) per population were computed with genetix 4.03 (Belkhir et al. 2001).
The inbreeding coefficient (FIS) was estimated for each
population and departure from Hardy–Weinberg equilibrium was assessed also using genetix 4.03 by a permutation test with 5000 permutations. P values were corrected using sequential Bonferroni procedure (Rice 1989).
To check if the differences in sample sizes and the various spatial scales over which individuals were pooled into ‘populations’ affected the diversity estimates, we cal-culated the allelic richness per population and island taking into account the dependence on sample size with an adaptation of the rarefaction index of Hurlbert (1971) (El Mousadik & Petit 1996), named ‘R’, using fstat 2.9.3.2 (Goudet 1995). The principle is to estimate the expected number of alleles in a subsample of 2n genes, given that 2N
genes have been sampled (N > n). In fstat, n is fixed as the smallest number of individuals typed for a locus in a sample.
Analyses of population differentiation
Differentiation among all samples and all sample pairs was tested using probability tests (Fisher exact tests), as described by Raymond & Rousset (1995). Wright’s
1982 L . B O T T I N E T A L .
F-statistics FST (Wright 1951) were estimated for all popula-tions and all population pairs by a ‘weighted’ analysis of variance (Cockerham 1973; Weir & Cockerham 1984) with genepop. To investigate the genetic structure of populations, we ran an analysis of molecular variance using arlequin (Schneider et al. 2000) with 1000 permutations (amova, Excoffier et al. 1992) which tests a particular genetic structure by partitioning the total variance into covariance com-ponents due to intraindividual differences, interindividual differences, and/or interpopulation differences. We tested two kinds of structure: among island and among populations within each island. We also tested the differentiation between the ‘Grande Terre and Ile des Pins’ group and the ‘Ile Loyauté’ group.
To relate the dispersal ability of S. austrocaledonicum to its geographical distribution, we ran Mantel tests (Mantel 1967) implemented in genepop 3.4. The procedure assesses the significance of the correlation between pairwise FST/(1 −F
ST) estimates and the logarithm of the Euclidian distance
(in kilometres) between pairs of localities (Rousset 1997), with the Spearman rank coefficient as statistical test, using 5000 random permutations of the matrix. Two tests were used: between populations in Grande Terre and Ile des Pins, and between populations of Iles Loyauté.
Pairwise genetic distances between pairs of populations were computed using Cavalli-Sforza’s chord measure (Cavalli-Sforza & Edwards 1967), obtained from the gendist
program (phylip, version 3.6, Felsenstein 1989, 1993). The distance tree was constructed using the NJ method of Saitou & Nei (1987) using the neighbor program of phylip. The robustness of each node was evaluated by bootstrap-ping data over locus for 1000 replications using the seqboot program of phylip 3.6 and the consensus tree obtained by seqboot (phylip 3.6) was displayed with treeview software (Page 1996).
Results
Within-population genetic diversity and departure from
random mating
The eight microsatellite loci were polymorphic and the number of alleles per locus ranged from 3 for mSaCIRG01
to 33 for mSaCIRG10. Mean numbers of alleles per locus per population (A) ranged from 1.38 in Maré South-east (allelic richness or R in this population: 1.19) to 7.88 in Ile des Pins North (R: 5.14). Forty-two alleles were private, the largest number in one population being 9 in Ile des Pins North. The Pearson correlation coefficient between the number of alleles per locus (A) and the allelic richness corrected with a rarefaction index (R) (Table 2) was 0.96 and was highly significant (Spearman correlation coefficient: 0.935***), which demonstrated a strong relationship between these two parameters.
Population
No. of individuals
Sampling area
[island size] (km2) Latitude Longitude
Ouen Toro 22 0.19 22°30′ 166′45 Pindai 26 3.43 21°31′ 164′96 Malek 37 0.87 20°19′ 164′10 Paita 53 0.67 22°09′ 166′22 Hienghène 20 0.57 20°43′ 164′55 Tiéa 10 0.05 21°08′ 164′56 Grande Terre 168 5.8 [16 350] IP north 26 32.25 22°35′ 167′28 IP south 35 25.25 22°39′ 167′28
Ile des Pins 61 57.5 [152]
Lifou north 36 275.28 20°42′ 167′13 Lifou middle 42 271.81 20°58′ 167′04 Lifou south 15 96.95 21°01′ 167′22 Lifou 93 644 [1196] Mare northwest 21 125.32 21°24′ 167′52 Mare southwest 18 118.91 21°35′ 167′53 Mare East 22 89.18 21°33′ 168′05 Maré 61 333.4 [650] Ouvea north 21 45.87 20°27′ 166′36 Ouvea middle 15 21.40 20°38′ 166′34 Ouvea south 12 20.58 20°43′ 166′25 Ouvéa 48 87.85 [132]
Table 1 Characteristics of the populations of Santalum austrocaledonicum in the archi-pelago of New Caledonia: number of individuals sampled (no. of individuals), sampling area (in Grande Terre individuals are aggregated in populations, whereas they are quite isolated in Loyauté islands), and geographical coordinates of the populations
S A N D A L W O O D ’ S G E N E T I C D I V E R S I T Y A N D S T R U C T U R E 1983
Considering each locus in each population separately, the distribution of allele frequencies was highly unbalanced (results not shown). In 67% of the situations, one allele pre-sented a frequency higher than 0.5.
Observed and expected (in parenthesis) heterozygosity values ranged from 0.01 (0.03) in Maré southeast up to 0.74 (0.74) in Ile des Pins North. The pattern of variation for
A and HO differed among populations within each island (Table 2). For instance within Grande Terre, the mean number of allele varied from 5.13 to 7.5 and mean observed (respectively expected) heterozygosity from 0.61 (0.62) to 0.75 (0.72). Concerning Hardy–Weinberg equilibrium, all results per population are given in Table 2.
A significant heterozygote deficit was detected in each island except Ile des Pins. FIS values varied widely among islands, ranging from 0.14 in Ouvéa to 0.62 in Maré. Within islands, significant FIS values after Bonferroni correction were all positive and varied weakly among populations.
Analyses of population differentiation
All FST values were significant. FST was 0.22 among islands and 0.35 among populations (Table 3). Between the two groups ‘Grande Terre — Ile des Pins’ and ‘Iles Loyauté’, the
FST was 0.24 and in this case FST was 0.39 among populations. Global FST among populations within islands was 0.12, it was around 0.20 within Grande Terre and Maré, around 0.07 within Lifou and Ouvéa and around 0.01 within Ile des Pins. All pairwise FST values were significant at the level α = 0.05 except for the pair Maré north and Maré southeast (FST = 0.01, P = 0.19) and for the pair Ile des Pins North and South (FST = 0.02, P = 0.10) (Table 3).
Populations from Grande Terre and Ile des Pins and from Iles Loyauté were separated by the NJ tree (Fig. 2), and populations of Ile des Pins were clearly related to the group of populations of Grande Terre. The populations of Lifou had an intermediate position between the populations of Maré, Ouvéa and Grande Terre. The populations of the north of Grande Terre (Malek and more specially Hienghène) were closer to Iles Loyauté than the other Grande Terre populations. Mantel tests revealed a significant correlation between geographical and genetic distances considering all the populations (r = 0.31, P < 0.05) (Fig. 3a). There was a signi-ficant association among Iles Loyauté populations (r = 0.65,
P < 0.001) and among Grande Terre populations (r = 0.6, P < 0.05) (Fig. 3b). When Ile des Pins was included in the
model with Iles Loyauté or with Grande Terre, the coeffi-cient was not significant (P > 0.05 in both cases).
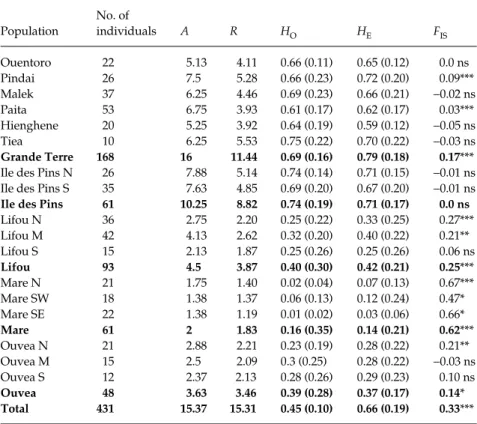
Population No. of individuals A R HO HE FIS Ouentoro 22 5.13 4.11 0.66 (0.11) 0.65 (0.12) 0.0 ns Pindai 26 7.5 5.28 0.66 (0.23) 0.72 (0.20) 0.09*** Malek 37 6.25 4.46 0.69 (0.23) 0.66 (0.21) −0.02 ns Paita 53 6.75 3.93 0.61 (0.17) 0.62 (0.17) 0.03*** Hienghene 20 5.25 3.92 0.64 (0.19) 0.59 (0.12) −0.05 ns Tiea 10 6.25 5.53 0.75 (0.22) 0.70 (0.22) −0.03 ns Grande Terre 168 16 11.44 0.69 (0.16) 0.79 (0.18) 0.17***
Ile des Pins N 26 7.88 5.14 0.74 (0.14) 0.71 (0.15) −0.01 ns Ile des Pins S 35 7.63 4.85 0.69 (0.20) 0.67 (0.20) −0.01 ns
Ile des Pins 61 10.25 8.82 0.74 (0.19) 0.71 (0.17) 0.0 ns
Lifou N 36 2.75 2.20 0.25 (0.22) 0.33 (0.25) 0.27*** Lifou M 42 4.13 2.62 0.32 (0.20) 0.40 (0.22) 0.21** Lifou S 15 2.13 1.87 0.25 (0.26) 0.25 (0.26) 0.06 ns Lifou 93 4.5 3.87 0.40 (0.30) 0.42 (0.21) 0.25*** Mare N 21 1.75 1.40 0.02 (0.04) 0.07 (0.13) 0.67*** Mare SW 18 1.38 1.37 0.06 (0.13) 0.12 (0.24) 0.47* Mare SE 22 1.38 1.19 0.01 (0.02) 0.03 (0.06) 0.66* Mare 61 2 1.83 0.16 (0.35) 0.14 (0.21) 0.62*** Ouvea N 21 2.88 2.21 0.23 (0.19) 0.28 (0.22) 0.21** Ouvea M 15 2.5 2.09 0.3 (0.25) 0.28 (0.22) −0.03 ns Ouvea S 12 2.37 2.13 0.28 (0.26) 0.29 (0.23) 0.10 ns Ouvea 48 3.63 3.46 0.39 (0.28) 0.37 (0.17) 0.14* Total 431 15.37 15.31 0.45 (0.10) 0.66 (0.19) 0.33***
No. of individuals; A, number of alleles per locus; HO, observed heterozygosity; HE, expected heterozygosity; FIS, fixation index; R, corrected allelic richness. N, North; M, Midlands; E, East; W, West; S, South.
P values: ns; P > 0.05, *; P < 0.05, **; P < 0.01, ***; P < 0.001 (P values were adjusted using
sequential Bonferroni procedure).
Table 2 Summary of genetic diversity esti-mates obtained with eight nuclear micro-satellites for Santalum austrocaledonicum. Results presented for each population and each island
1984 L . B O T T I N E T A L .
Discussion
Diversity
In this study we used different parameters to assess genetic diversity. The parameters using the number of alleles (A and R) are complementary of those using allele frequencies (H), specially for analyses raising conservation issues (El Moussadik & Petit 1996). Here we used the allelic richness corrected by the rarefaction index (R) to take into account the differences in sample size of the populations (from 10 to 53 individuals). Our result showed a very high correlation between A and R (Pearson coefficient: 0.96, Spearman coefficient: 0.935) demonstrating that the correction with the rarefaction index has no effect on diversity assessment. This also suggests that rare alleles (which strongly influence measures of allelic richness) have not a more scattered distribution than the other alleles.
Many tree species exhibit regional structuring (Morand
et al. 2002), particularly when gene flow is limited by
bar-riers such as mountains or oceans. Our analysis confirmed this principle, as it revealed great differences in diversity parameters between islands throughout the archipelago. The broad range in observed heterozygosity (HO) values
resulted from the broad variation in the mean number of alleles per locus (A) and follows the pattern found in other microsatellite studies of tropical tree species. For example, Dayanandan et al. (1999) found A values between 2 and 15, and HO values between 0.13 and 0.93 in Carapa guianensis.
Our diversity parameters (A = 2–16, mean = 15.37; HE = 0.14–0.79, mean = 0.66) were comparable to those of other tree species analysed with microsatellites. They were higher than those of Vitellaria paradoxa (A = 3.4–4.2, HE = 0.38–0.44) (Kelly et al. 2004), Vouacapoua americana (A = 3.2–5.1, HE = 0.34–0.52) (Dutech et al. 2004), Grevillea macleayana (A = 3.2– 4.2, HE = 0.42–0.53) (England et al. 2002), and lower than those of Melaleuca alternifolia (A = 20–27, HE = 0.13–0.92) (Rossetto et al. 1999) and Symphonia globulifera (mean A = 3.7–16, mean HE = 0.67–0.85) (Aldrich et al. 1998).
Populations of Iles Loyauté had a lower genetic diver-sity, particularly Maré (mean observed heterozygosity
HO = 0.156, mean number of alleles A = 2), compared to Ile des Pins (HO = 0.74, A = 10.25) and Grande Terre (HO = 0.69,
A = 16). Genetic variability was not correlated positively
with population size (r = −0.47, not significant with a two-tailed Pearson correlation test with α = 0.05: P > 0.025), it was lower in Iles Loyauté than in Grande Terre and Ile des Pins (for example, mean number of allele per locus per km2
Table 3 Results of the amova testing the genetic structure among islands, among two groups (‘Grande Terre-Ile des Pins’ and ‘Iles Loyauté’) and among population within islands. For each analysis, we figured the percentage of the total differentiation attributable to the variation among groups (if there are some), among populations and within populations. Moreover, we figured the FST between population within island
Group Source of variation d.f.
Percentage
of variation FST
Among islands Among islands 4 22.11 0.35***†
Among populations within islands 12 12.36‡
Within populations 845 65.53
Total 861
Between ‘Grande Terre-Ile des Among groups 1 23.58 0.39***†
Pins’ and ‘Iles Loyauté’ groups Among populations within groups 15 15.47‡
Within populations 845 60.96
Within Grande Terre Among populations 5 19.51 0.20***
Within populations 330 80.49
Total 335
Within Ile des Pins Among populations 1 1.36 0.01***
Within populations 120 98.64
Total 121
Within Mare Among populations 2 19.77 0.2***
Within populations 119 80.23
Total 121
Within Lifou Among populations 2 6.69 0.07***
Within populations 183 93.31
Total 185
Within Ouvea Among populations 2 6.68 0.07***
Within populations 93 93.32
Total 95
†The FST represents the differentiation among populations within the total population. ‡The percentage represents the differentiation among populations within island (group).
S A N D A L W O O D ’ S G E N E T I C D I V E R S I T Y A N D S T R U C T U R E 1985
was 0.006 in Maré and 2.16 in Grande Terre). The higher genetic diversity in Grande Terre can be related to its higher number of populations and its larger area. But it can also simply result from the history of sandalwood colon-ization throughout the archipelago. Grande Terre and Ile des Pins are the most ancient islands of the archipelago and in major part comprise sedimentary and volcanic forma-tions from the Permian (225–280 million years ago) to the Tertiary (1.5–65 Ma). Their same geological origin and their connection during the last glaciation between 14 000 and 9000 years bp (Stevenson et al. 2001) could explain their similarity concerning genetic diversity, which is also reflected by their proximity in the genetic tree. The Eastern arc of the Iles Loyauté rests on old volcanoes, that were gradually drowned under the sea, whereas the coral grew in height, forming a ring which evolved into an atoll when the volcanic island disappeared under the sea. In the Qua-ternary period (1.8 Ma) these filled lagoons were raised, giving the current limestone islands (Picard 1999).
Given the different ages of the islands, it is very likely that sandalwood arrived first on Grande Terre and Ile des Pins, then differentiated into the species Santalum
austrocal-edonicum, and then colonized the Loyautés. Frankham (1997)
established comparisons between mainland and island diversity of many organisms, and found that in most cases mainland populations were more diverse. Given their
large size, Grande Terre and Ile des Pins can be likened to mainland, and lower diversity in the Iles Loyauté can be explained by the island colonization process and restricted gene flow.
The very low diversity in Mare (A = 2, HE = 0.14) can be explained by a stepping-stone model (Kimura & Weiss 1964) if we consider that there was no colonization from the east side of Grande Terre to the Iles Loyauté, and that there was two paths of colonization, one from north Grande Terre to Ouvéa then Lifou, and then Maré, the other from south Grande Terre and Ile des Pins to Maré. Hence Maré could be the end of the path and would have received less genetic diversity.
Heterozygote deficit
Our study revealed a strong heterozygote deficit in each island, and high values of FIS particularly in Iles Loyauté. At least four explanations may account for this deficit.
The first is the occurrence of null alleles (alleles that are never amplified because of mutations in the flanking primer sequences (Callen et al. 1993)). This could explain the departure from Hardy–Weinberg equilibrium of loci
mSaCIRE09, mSaCIRG10 and mSaCIRF04. But this seems
unlikely because amplification failures that would reflect null/null homozygotes were rare (maximum of 5.6% for
Fig. 2 Neighbour-joining phylogram based on the Cavalli-Sforza chord method for
Santalum austrocaledonicum. Ile des Pins 1 =
North, 2 = South; Lifou and Ouvéa 1 = North, 2 = Midlands, 3 = South; Maré 1: Northwest, 2 = Southwest, 3 = Southeast.
1986 L . B O T T I N E T A L .
locus G-10). One means to test their absence would be to design sets of new primers located upstream and down-stream from the original ones, to see if the individuals pre-viously scored as homozygote remain as such when using the new primers, as did Gibbs et al. (1997). We decided not to search for null alleles as the analyses gave similar results with and without the three loci previously mentioned.
A second explanation is the Wahlund effect, which occurs when a subdivided population contains fewer hetero-zygotes than predicted despite the fact that all subdivi-sions are in Hardy–Weinberg equilibrium. This effect may explain a part of the heterozygote deficit of the whole island population. For example, Ouvéa shows a high and significant FIS (0.14*) (high heterozygote deficit), but when divided into three populations, two of them do not show heterozygote deficit (Ouvéa Midland FIS = −0.03 ns, Ouvéa South FIS = 0.1 ns). Similarly, in Grande Terre (FIS = 0.17***), in which populations are more isolated, all populations but Pindaï (FIS = 0.09*) showed no significant departure from panmixia.
Two characteristics of S. austrocaledonicum may contrib-ute to the creation of a Wahlund effect. First, the suckering from adventitious buds on roots following disturbance,
which has permitted sandalwood to subsist after the dramatic cuttings in the 19th century and the frequent fires in the archipelago. This asexual way of reproduction leads to clones in a small perimeter. We clearly observed this phenomenon throughout the archipelago, as close individuals often had the same genotype (cf. Material and methods). Mating among individuals belonging to the same clone is akin to selfing, and will similarly create departure from Hardy–Weinberg expectations.
Second, a low seed and/or pollen dispersal can create a clustering of genetically related trees around a mother tree. This is the case for Vouacapoua americana (Dutech et al. 2004) whose seeds are heavy (around 30 g) and dispersed by small rodents which bury them usually less than 10 m from their source. Unlike V. americana, S. austrocaledonicum’s seeds are not very large (8 mm × 5 mm) so they can easily be disseminated by birds over large distances. However, if pollinators are lacking, it is very likely that trees reproduce by selfing. Selfing will also happen when tree density is low and pollinators tend to stay on the same tree. Selfing seems to be the most logical explanation for heterozygote deficiency in situations such as Maré where mean observed heterozygosity is extremely low, FIS is very strong and significant (0.62), and subdivision of the island into three populations does not improve the results (FIS all significant and around 0.5).
The Wahlund effect can be not only spatial but also temporal (Morand et al. 2002): when flowering dates are consistently different among trees, as with S.
austrocaledon-icum, reproduction is restricted to the individuals flowering
at the same time, hence creating a cluster of trees. How-ever, this hypothesis assumes that ‘populations’ of trees flowering at the same time keep the same flowering dates from one year to another and are of finite size. Moreover, it supposes that these populations have evolved different allelic frequencies at microsatellite loci, or that there was an initial disequilibrium between neutral markers and loci involved in homogamy that are affected by a heterozygote deficit.
Differentiation between populations
The degree of differentiation between populations is both influenced by drift, which increases differentiation, and gene flow, which reduces it. Gene flow through pollen is expected to be low in S. austrocaledonicum as it is insect-pollinated, but seed dispersal through bird ingestion can occur over long distances and may allow gene flow between islands.
Both FST values and percentage of variance obtained with the amova indicated a strong differentiation between islands (FST = 0.22***) and a lower differentiation between populations within island (intra island FST = 0.16 repre-senting 12% of the total variance). This result was expected in an island system, where ocean barriers limit gene flow
Fig. 3 Relationship between genetic differences [FST/(1 – FST)] and geographical distances for (a) all populations pairs (r = 0.31), and (b) pairs of populations of Iles Loyauté only (black triangles) (significant relationship, r = 0.65), pairs of populations of Grande Terre only (open triangles) (significant relationship, r = 0.60), pairs of populations of Ile des Pins and Loyautés (each part of the pair being a population of Ile des Pins, the other being a population of Loyautés) (black dots) (not significant) and pairs of populations of Ile des Pins and Grande Terre (each part of the pair being a population of Ile des Pins, the other being a population of Grande Terre (open dots) (not significant).
S A N D A L W O O D ’ S G E N E T I C D I V E R S I T Y A N D S T R U C T U R E 1987 between populations (MacArthur & Wilson 1967), and
confirms the first results obtained for tree species with similar geographical patterns, for example Pterocarpus officinalis, which revealed a strong differentiation between islands with AFLP markers (Rivera-Ocasio et al. 2002).
As expected with the isolation of its populations, Grande Terre had a high FST (0.2***). The high FST value in Maré (0.2***) was harder to explain, but the possible more inbred mating system in this island may have influenced the cal-culation as effective size is reduced in selfing populations. Because of its large size, Grande Terre was the most suit-able island for comparisons of population structure with continental species.
Our within-island results are similar to those of Santalum
spicatum which had an FST of 0.09 (Byrne et al. 2003), but the markers used for this analysis were RFLP, which may affect the result compared to what would be obtained with microsatellites, RFLP marker mutation rate being lower than that of microsatellite markers.
To our knowledge, there is no study of continental tree species using microsatellites with similar patterns of dis-persal. The majority of trees studied are insect pollinated, but have seed dispersal over small distances from the mother tree [barochorous, zoochorous (by small animals), or anemochorous over a small distance], so their gene flow is potentially lower than that of species dispersed by birds, hence their FST is expected to be higher. However, exam-ples of those tree species studied on a similar geographical scale showed a lower differentiation than on Grande Terre: with Caryocar brasiliense, Collevatti et al. (2001) found an
FST of 0.11 and Swietenia macrophylla exhibited a FST of 0.1 in the Brazilian Amazon (Lemes et al. 2003), and 0.11 in Central America (Novick et al. 2003). This result indicates that gene flow in S. austrocaledonicum on Grande Terre is lower than expected considering its large dispersal distance. The tree representing genetic distances between popu-lations confirmed the emergence of two distinct groups: Iles Loyauté and Grande Terre/Ile des Pins. Ile des Pins popu-lations were genetically very close to Grande Terre ones, as already suspected from their geographical connectivity during the last glaciations (Stevenson et al. 2001), but could be explained simply by their geographical proximity.
The case of Hienghène is interesting, as it is the only known population on the east coast of Grande Terre. First, our analysis revealed that it was the genetically closest to Iles Loyauté, which suggests a genetic exchange between them, probably through birds. Second, Grande Terre island is crossed from north to south by a chain of mountains, which constitutes a geographical barrier to gene flow, given that S. austrocaledonicum only occurs at low altitudes. That obstacle may explain the genetic isolation between western and eastern populations. Finally, it is known that Caledonian sandalwood exploitation, which reached its peak in the 1850s, concerned all the Iles Loyauté and the
eastern part of Grande Terre. Thus, Hienghène may be a remnant of a larger number of populations, decimated by human exploitation, the witness of a past gene flow between the east coast of Grande Terre and the Iles Loyauté.
Our results indicate that S. autrocaledonicum populations are differentiated by a process of isolation by distance. This hypothesis is supported by a significant Mantel test (r = 0.31*) between a matrix of pairwise FST and a matrix of geographical distances. Ile des Pins showed no isolation by distance with the Loyautés nor with Grande Terre to which it is very close. This points out the absence of current gene flow between Ile des Pins and South Grande Terre.
Conservation implications
Santalum austrocaledonicum is threatened throughout its
natural range as a result of two waves of over-exploitation, the first after the discovery of New Caledonia in the 1840s by Edouard Foxhall du Camden which led to shortage in 1865, the second at the end of 19th century. It is only since 1988 that cuttings have been regulated and new trees planted. Our study provides tracks that could help to design con-servation and management policies to maintain the diver-sity of this valuable species. Both the high level of genetic variation within populations and the isolation by distance suggest that in situ conservation strategies, like the creation of reserves, could be designed to preserve large areas to minimize the loss of diversity due to genetic drift, and to conserve maximally the regional genotypic diversity.
Our study allows us to define two molecular ESUs (evolutionary significant units, Ryder 1986) that we can consider as provenance zone (in the forestry sense) for
S. austrocaledonicum: ‘Grande Terre and Ile des Pins’ and ‘Iles
Loyauté’, which are differentiated by an FST of 0.24. The term ESU was devised in a practical way to approach the conservation of genetic resources, given the broad recogni-tion of the importance of genetic diversity in conservarecogni-tion policy and the frequent inadequacy of existing taxonomy to describe it (Moritz 1994). The criterion for identification of an ESU has been defined as reciprocal monophyly for organelle haplotypes and significant divergence of allele frequencies at nuclear loci (Moritz 1994). Crandall et al. (2000) have pointed out that ESUs based on neutral mole-cular criteria will not address many of the real problems of conservation. Ecological factors, such as frequency-dependent mating and pollinator interactions, must also be taken into account. It is likely that the best strategy lies in concordance between neutral genetic and adaptive information (Moritz 2002) but, as a starting point, identi-fication of molecular ESUs provides a valuable practical framework (Cavers et al. 2003). The study of the genetic diversity of chloroplast microsatellites we are now con-ducting on S. austrocaledonicum will permit us to define these molecular ESUs.
1988 L . B O T T I N E T A L .
Acknowledgments
We would like to thank Alexandre Vaillant and Pierre Sire for laboratory work and Alexandre Lagrange for field work in New Caledonia. Many thanks go to IAC (Institut Agronomique néo-Calédonien) and to the Development Services of the Provinces of Islands, North and South. We also acknowledge MEED (Ministère de L’Ecologie et du Développement Durable) for financial support.
References
Aldrich PR, Preston R, Hamrick JL, Chavarriaga P, Kochert G (1998) Microsatellite analysis of demographic genetic structure in fragmented populations of the tropical tree Symphonia
globu-lifera. Molecular Ecology, 7 (8), 933–944.
Barton NH (1989) Founder effect speciation. In: Speciation and Its
Consequences (eds D Otte, JA Endler), pp. 229–256. Sinauer
Associates, Sunderland, Massachusetts.
Belkhir K, Borsa P, Chikhi L, Raufaste N, Bonhomme F (2001)
GENETIX 4.03, logiciel sous Windows™ pour la génétique des populations.
Laboratoire Génome, Populations, Interactions, CNRS UMR 5000, Université de Montpellier II, Montpellier, France. Bottin L, Vaillant A, Sire P, Cardi C, Bouvet JM (2004) Isolation and
characterization of microsatellite loci in Santalum
austrocaledon-icum, Santalaceae. Molecular Ecology Notes (in press).
Bousquet J, Simon L, Lalonde M (1990) DNA amplification from vegetative and sexual tissue of trees using polymerase chain reaction. Canadian Journal of Forestry Research, 20, 254–257. Brauner S, Crawford DJ, Stuessy TF (1992) Ribosomal DNA and
RAPD variation in the rare plant family Lactoridaceae. American
Journal of Botany, 79, 1436–1439.
Byrne M, MacDonald B, Broadhorst L, Brand J (2003) Regional genetic differentiation in Western Australian sandalwood
(San-talum spicatum) as revealed by nuclear RFLP analysis. Theoretical and Applied Genetics, 107, 1208–1214.
Callen DF, Thompson AD, Shen Y et al. (1993) Incidence and origin of ‘null’ alleles in the (AC)n microsatellite markers. American Journal of Human Genetics, 7, 922–927.
Carlquist S (1980) Hawaii: A Natural History. Geology, Climate, Native
Flora and Fauna Above the Shoreline, 2nd edn. Pacific Tropical
Botanical Garden, Lawa’i Hawaii.
Cavalli-Sforza LL, Edwards AWF (1967) Phylogenetic analysis: models and estimation procedures. Evolution, 32, 550–570. Cavers S, Navarro C, Lowe AJ (2003) A combination of molecular
markers identifies evolutionarily significant units in Cedrela odorata L. (Meliaceae) in Costa Rica. Conservation Genetics, 4, 571–580. Cockerham CC (1973) Analysis of gene frequencies. Genetics, 74,
679–700.
Collevatti RG, Grattapaglia D, Day JD (2001) Population genetic structure of the endangered tropical tree species Caryocar brasiliense, based on variability at microsatellite loci. Molecular Ecology, 10, 349–356.
Cox PA, Elmqvist T, Pierson ED, Rainey WE (1991) Flying foxes as strong interactors in South Pacific islands ecosystems: a con-servation hypothesis. Concon-servation Biology, 5, 448–454. Crandall KA, Bininda-Edmonds ORP, Mace GM, Wayne RK
(2000) Considering evolutionary processes in conservation biology. Trends in Ecology & Evolution, 15, 290–295.
Crawford DJ, Stuessy TF, Lammers TG, Silva OM, Pacheco P (1990) Allozyme variation and evolutionary relationships among three species of Wahlenbergia (Campanulaceae) in the Juan Fernandez Islands. Botanical Gazette, 151, 119–124.
Crawford DJ, Stuessy TF, Silva OM (1987) Allozyme divergence and the evolution of Dendroseris (Compositae. Lactuceae) on the Juan Fernandez Islands. Systematic Botany, 12, 435–443. Crawford DJ, Stuessy TF, Silva OM (1988) Allozyme variation in
Chenopodium santae-clare, an endemic of the Juan Fernandez
Islands, Chile. Biochemical and Systematic Ecology, 16, 279–284. Darwin C (1859) On the Origin of Species by Means of Natural Selection
(reprint of 1st edn 1950). Watts, London.
Dayanandan S, Dole J, Bawa K, Kesseli R (1999) Population structure delineated with microsatellite markers in fragmented populations of a tropical tree, Carapa guianensis (Meliaceae).
Molecular Ecology, 8, 1585–1592.
Dutech C, Joly HI, Jarne P (2004) Gene flow, historical population dyn-amics and genetic diversity within French Guiana populations of a rainforest tree species, Vouacapoua americana. Heredity, 92, 69–77. Ehrhart Y (1998) Descriptions of some sandal tree populations in the Southwest Pacific: consequences for the silviculture of these species and provenances. In: Proceeding for the International Seminar
‘Sandal and its Products’ Held on 18–19 December 1997. Australian
Centre for International Agricultural Research, Canberra. El Mousadik A, Petit RJ (1996) High level of genetic differentiation
for allelic richness among populations of the argan tree (Argania
spinosa (L.) Skeels) endemic to Morocco. Theoretical and Applied Genetics, 92, 832–839.
Elisens WJ (1992) Genetic divergence in Galvezia (Scrophular-iaceae). evolutionary and biogeographic relationships among South American and Galapagos species. American Journal of
Botany, 79, 198–206.
Ellstrand N, Elam D (1993) Population genetic consequences of small population size: implications for plant conservation.
Annual Review of Ecology and Systematics, 24, 217–242.
Emerson BC (2002) Evolution on oceanic islands: molecular phylo-genetic approaches to understanding pattern and processes.
Molecular Ecology, 11, 951–966.
England P, Phillip R, Usher, Annette V, Whelan, Robert J., Ayre, David J (2002) Microsatellite diversity and genetic structure of fragmented populations of the rare, fire-dependent shrub
Grevillea macleayana. Molecular Ecology, 11 (6), 967–977.
Excoffier L, Smouse PE, Quattro JM (1992) Analysis of molecular variance inferred from metric distances among DNA haplotypes: application to human mitochondrial DNA restriction data.
Genetics, 131, 479–491.
Felsentstein J (1993) PHYLIP: Phylogenetic inference package, Version 3.573c. University of Washington, Seattle, WA.
Frankham R (1997) Do island populations have less genetic vari-ation than mainland populvari-ations? Heredity, 78, 311–327. Gibbs D, Barnes E, Cox J (2001) Pigeons and Doves: A Guide to the
Pigeons and Doves of the World. Pica Press, Sussex.
Gibbs HL, Prior KA, Weatherhead PJ, Johnson G (1997) Genetic structure of populations of the threatened eastern massasauga rattlesnake, Sistrurus c. catenatus: evidence from microsatellite DNA markers. Molecular Ecology, 6, 1123–1132.
Goudet J (1995) FSTAT (vers. 1.2): a computer program to calculate
F-statistics. Journal of Heredity, 86, 485–486.
Gustafsson S (2000) Patterns of genetic variation in Gymnadenia
conopsea, the fragrant orchid. Molecular Ecology, 9, 1863–1872.
Hamrick JL, Godt MJW (1996) Effects of life history traits on genetic diversity in plant species. Philosophical Transactions of the Royal
Society of London. Series B, Biological Sciences, 351, 1291–1298.
Hamrick JL, Godt MJW, Sherman-Broyles SL (1992) Factors influencing levels of genetic diversity in woody plant species.
S A N D A L W O O D ’ S G E N E T I C D I V E R S I T Y A N D S T R U C T U R E 1989
Hurlbert SH (1971) The non-concept of species diversity: a critique and alternative parameters. Ecology, 52, 577–586.
Kelly B, Hardy O, Bouvet JM (2004) Temporal and spatial genetic structure in Vitellaria paradoxa (shea tree) in an agroforestry system in southern Mali. Molecular Ecology, 13, 1231–1240.
Kimura M, Weiss GH (1964) The stepping-stone model of popu-lation structure and the decrease of genetic correpopu-lation with distance. Genetics, 49, 561–576.
Kwon JA, Morden CW (2002) Population genetic structure of two rare tree species (Colubrina oppositifolia and Alphitonia ponderosa, Rhamnaceae) from Hawaiian dry and mesic forests using ran-dom amplified polymorphic DNA markers. Molecular Ecology,
11, 991–1001.
Lemes MR, Gribel R, Proctor J, Grattapaglia D (2003) Population genetic structure of mahagany (Swietenia macrophylla King, Meliaceae) across the Brazilian Amazon, based on variation at microsatellite loci: implication for conservation. Molecular
Ecol-ogy, 12, 2875–2883.
MacArthur RH, Wilson EO (1967) The Theory of Island Biogeography. Princeton University Press, Princeton, New Jersey.
Malécot V, Nickrent DL, Baas P, van den Oever L, Lobreau-Callen D (2004) A morphological cladistic analysis of Olacaceae. Systematic
Botany, 29, 569–586.
Mantel N (1967) The detection of disease clustering and a generalized regression approach. Cancer Research, 27, 209–220.
Morand M-E, Brachet S, Rossignol P, Dufour J, Frascaria-Lacoste N (2002) A generalized heterozygote deficiency assessed with microsatellites in French common ash populations. Molecular
Ecology, 11, 377–385.
Moritz C (1994) Defining ‘evolutionary significant units’ for con-servation. Trends in Ecology & Evolution, 9, 373–375.
Moritz C (2002) Strategies to protect biological diversity and the evolutionary processes that sustain it. Systematic Biology, 51, 238–254.
Nasi R, Ehrhart Y (1996) Le santal un parfum de prospérité. 1ère partie — une longue histoire. Bois et Forêts Des Tropiques, 247, 5– 19.
Nei M (1978) Estimation of average heterozygosity and genetic distance from a small number of individuals. Genetics, 89, 583– 590.
Newman D, Pilson D (1997) Increased probability of extinction due to decreased genetic effective population size: experimental populations of Clarkia pulchella. Evolution, 512, 354–362. Novick RR, Dick CD, Lemes MR, Navarro C, Caccone A,
Bermingham E (2003) Genetic structure of Mesoamerican popu-lation of big-leaf mahogany (Swietenia macrophylla) inferred from microsatellite analysis. Molecular Ecology, 12, 2885– 2893.
Page RDM (1996) treeview: an application to display phylogenetic trees on personal computers. Computer Applications in the
Biosciences, 12, 357–358.
Perrier X, Flori A, Bonnot F (2003) Data analysis methods. In: Hamon P, Seguin M, Perrier X, Glaszmann JC Ed, Genetic diversity
of cultivated tropical plants Enfield, Science Publishers Montpellier
pp. 43–76.
Picard M (1999) L’archipel. Néo-Calédonien. Centre de Documenta-tion Pédagogique Nouvelle-Calédonie, Nouméa.
Quémin C (1988) Etudes sur le Santal. (Santalum Austrocaledonicum).
Mémoire de 3ème année. Ecole Nationale des Ingénieurs de
Travaux des Eaux et Forêts.
Radomiljac AM, McComb JA (1997) Nitogen-fixing and non-nitrogen-fixing woody host influences on the growth of the root
hemi-parasite Santalum album L. Sandal and its products. Inter-national Seminar, Bangalore, India, 18–19 December 1997.
ACIAR Proceedings, 84, 54–57.
Raymond M, Rousset F (1995) genepop (version 3.2a): population genetics software for exact tests and ecumenism, Journal of
Heredity, 86, 248–249.
Rice WR (1989) Analyzing tables of statistical tests. Evolution, 43, 223–225.
Rivera-Ocasio E, Aide TM, McMillan MO (2002) Patterns of genetic diversity and biogeographical history of the tropical wetland tree, Pterocarpus officinalis ( Jacq.), in the Caribbean basin. Molecular Ecology, 11, 675–683.
Rossetto M, Slade RW, Baverstock PR, Henry RJ, Lee LS (1999) Microsatellite variation and assessment of genetic structure in a tea tree (Melaleuca alternifolia — Myrtaceae). Molecular Ecology,
8, 633–643.
Rousset F (1997) Genetic differentiation and estimation of gene flow from F-statistics under isolation by distance. Genetics, 145, 1219–1228.
Ryder OA (1986) Species conservation and systematics: the dilemna of subspecies. Trends in Ecology & Evolution, 1, 9–10. Saitou N, Nei M (1987) The neighbor-joining method: a new
method for reconstructing phylogenetic trees. Molecular Biology
and Evolution, 4, 406–425.
Savolainen O, Kuittinen H (2000) Small population processes. In: Forest Conservation Genetics: Principles and Practice (Young A, Boshier D, Boyle T), pp. 91–100, CABI Publishing, United Kingdom. Schneider S, Roessli D, Excoffier L (2000) ARLEQUIN: a software for population genetics data analysis. User manual version 2.0.
Genetics and Biometry Laboratory, Department of Anthropology, University of Geneva, Switzerland. Free program distributed by the authors over internet from lgb.unige.ch/arlequin/ Sheely DL, Meagher TR (1996) Genetic diversity in Micronesian
island populations of the tropical tree Campnosperma
brevipetio-lata (Anacardiaceae). American Journal of Botany, 83, 1571–1579.
Stevenson J, Dobson JR, Prosser IP (2001) A late quaternary record of environmental change and human impact from New Caledonia.
Palaeography, Palaeoclimatology, Palaeoecology, 168, 97–123.
Weir BS, Cockerham CC (1984) Estimating F-statistics for the ana-lysis of population structure. Evolution, 38, 1358–1370. Wright S (1951) The genetical structure of populations. Annals of
Eugenics, 15, 323–354.
Young AG, Boyle T, Brown AHD (1996) The population genetic consequences of habitat fragmentation for plants. Trends in Ecology
& Evolution, 11, 413–418.
Young AG, Clarke GM (2000) Genetics, Demography and Viability of
Fragmented Populations. Cambridge University Press, Cambridge,
UK.
These results are part of Lorraine Bottin’s PhD thesis on the analysis of genetic diversity of Santalum austrocaledonicum. This study was one of the tasks of the sandalwood project founded by the French Ministry of Ecology and Sustainable Development involving Isabelle Olivieri working on evolutionary genetics at ISEM, University of Montpellier. Laboratory work and analyses were done in Forest Department of CIRAD where Jean-Marc Bouvet is the responsible of the ‘Forest genetics’ research unit. Daniel Verhaegen is a molecular biologist and Jacques Tassin is an ecologist positioned in New-Caledonia working in the same research unit.