HAL Id: hal-00144286
https://hal.archives-ouvertes.fr/hal-00144286
Submitted on 2 May 2007
HAL is a multi-disciplinary open access
archive for the deposit and dissemination of
sci-entific research documents, whether they are
pub-lished or not. The documents may come from
teaching and research institutions in France or
abroad, or from public or private research centers.
L’archive ouverte pluridisciplinaire HAL, est
destinée au dépôt et à la diffusion de documents
scientifiques de niveau recherche, publiés ou non,
émanant des établissements d’enseignement et de
recherche français ou étrangers, des laboratoires
publics ou privés.
Ge(1-x)Mn(x) nano-columns
Thibaut Devillers, Matthieu Jamet, André Barski, Valier Poydenot, Pascale
Bayle-Guillemaud, Edith Bellet-Amalric, Salia Cherifi, Joel Cibert
To cite this version:
Thibaut Devillers, Matthieu Jamet, André Barski, Valier Poydenot, Pascale Bayle-Guillemaud, et
al.. Structure and magnetism of self-organized Ge(1-x)Mn(x) nano-columns. Physical Review B:
Condensed Matter and Materials Physics (1998-2015), American Physical Society, 2007, 76, pp.205306.
�10.1103/PhysRevB.76.205306�. �hal-00144286�
hal-00144286, version 1 - 2 May 2007
Structure and magnetism of self-organized Ge
1−xMn
xnano-columns
T. Devillers,∗ M. Jamet,† A. Barski, V. Poydenot, P. Bayle-Guillemaud, and E. Bellet-Amalric CEA-Grenoble/DSM/DRFMC/SP2M,
17 rue des Martyrs, 38054 Grenoble Cedex 9, France
S. Cherifi and J. Cibert
Institut N´eel, CNRS, BP166,
38042 Grenoble Cedex 9, France. (Dated: May 4, 2007)
We report on the structural and magnetic properties of thin Ge1−xMnx films grown by molecular
beam epitaxy (MBE) on Ge(001) substrates at temperatures (Tg) ranging from 80◦C to 200◦C, with
average Mn contents between 1 % and 11 %. Their crystalline structure, morphology and composi-tion have been investigated by transmission electron microscopy (TEM), electron energy loss spec-troscopy and x-ray diffraction. In the whole range of growth temperatures and Mn concentrations, we observed the formation of manganese rich nanostructures embedded in a nearly pure germanium matrix. Growth temperature mostly determines the structural properties of Mn-rich nanostructures. For low growth temperatures (below 120◦C), we evidenced a two-dimensional spinodal
decomposi-tion resulting in the formadecomposi-tion of vertical one-dimensional nanostructures (nanocolumns). Moreover we show in this paper the influence of growth parameters (Tg and Mn content) on this
decomposi-tion i.e. on nanocolumns size and density. For temperatures higher than 180◦C, we observed the
formation of Ge3Mn5 clusters. For intermediate growth temperatures nanocolumns and
nanoclus-ters coexist. Combining high resolution TEM and superconducting quantum interference device magnetometry, we could evidence at least four different magnetic phases in Ge1−xMnx films: (i)
paramagnetic diluted Mn atoms in the germanium matrix, (ii) superparamagnetic and ferromag-netic low-TC nanocolumns (120 K ≤ TC ≤170 K), (iii) high-TC nanocolumns (TC ≥400 K) and
(iv) Ge3Mn5 clusters.
PACS numbers: 75.50.Pp, 75.75.+a, 61.46.-w
I. INTRODUCTION
In the past few years, the synthesis of ferromagnetic semiconductors has become a major challenge for spin-tronics. Actually, growing a magnetic and semiconduct-ing material could lead to promissemiconduct-ing advances like spin injection into non magnetic semiconductors, or electrical manipulation of carrier induced magnetism in magnetic semiconductors [1, 2]. Up to now, major efforts have focused on diluted magnetic semiconductors (DMS) in which the host semiconducting matrix is randomly sub-stituted by transition metal (TM) ions such as Mn, Cr, Ni, Fe or Co [3]. However Curie temperatures (TC) in
DMS remain rather low and TM concentrations must be drastically raised in order to increase TCup to room
tem-perature. That usually leads to phase separation and the formation of secondary phases. It was recently shown that phase separation induced by spinodal decomposi-tion could lead to a significant increase of TC [4, 5]. For
semiconductors showing TC higher than room
tempera-ture one can foresee the fabrication of nanodevices such as memory nanodots, or nanochannels for spin injection.
∗Electronic address: thibaut.devillers@cea.fr †Electronic address: matthieu.jamet@cea.fr
Therefore, the precise control of inhomogeneities appears as a new challenge which may open a way to industrial applications of ferromagnetism in semiconductors.
The increasing interest in group-IV magnetic semicon-ductors can also be explained by their potential compati-bility with the existing silicon technology. In 2002, carrier mediated ferromagnetism was reported in MBE grown Ge0.94Mn0.06 films by Park et al. [6]. The maximum
critical temperature was 116 K. Recently many publica-tions indicate a significant increase of TC in Ge1−xMnx
material depending on growth conditions [7, 8, 9]. Cho et al. reported a Curie temperature as high as 285 K [10]. Taking into account the strong tendency of Mn ions to form intermetallic compounds in germanium, a detailed investigation of the nanoscale structure is re-quired. Up to now, only a few studies have focused on the nanoscale composition in Ge1−xMnx films. Local
chemical inhomogeneities have been recently reported by Kang et al. [11] who evidenced a micrometer scale seg-regation of manganese in large Mn rich stripes. Ge3Mn5
as well as Ge8Mn11 clusters embedded in a germanium
matrix have been reported by many authors. However, Curie temperatures never exceed 300 K [12, 13, 14, 15]. Ge3Mn5 clusters exhibit a Curie temperature of 296 K
[16]. This phase frequently observed in Ge1−xMnxfilms
is the most stable (Ge,Mn) alloy. The other stable com-pound Ge8Mn11 has also been observed in
nanocrystal-lites surrounded with pure germanium [17]. Ge8Mn11
and Ge3Mn5 phases are ferromagnetic but their
metal-lic character considerably compmetal-licates their potential use as spin injectors. Recently, some new Mn-rich nanostruc-tures have been evidenced in Ge1−xMnxlayers. Sugahara
et al. [18] reported the formation of high Mn content (between 10 % and 20 % of Mn) amorphous Ge1−xMnx
precipitates in a Mn-free germanium matrix. Mn-rich co-herent cubic clusters were observed by Ahlers et al. [15] which exhibit a Curie temperatures below 200 K. Finally, high-TC (> 400 K) Mn-rich nanocolumns have been
evi-denced [19] which could lead to silicon compatible room temperature operational devices.
In the present paper, we investigate the structural and magnetic properties of Ge1−xMnx thin films for low
growth temperatures (< 200◦C) and low Mn
concentra-tions (between 1 % and 11 %). By combining TEM, x-Ray diffraction and SQUID magnetometry, we could identify different magnetic phases. We show that de-pending on growth conditions, we obtain either Mn-rich nanocolumns or Ge3Mn5 clusters embedded in a
ger-manium matrix. We discuss the structural and mag-netic properties of these nanostructures as a function of manganese concentration and growth temperature. We also discuss the magnetic anisotropy of nanocolumns and Ge3Mn5 clusters.
II. SAMPLE GROWTH
Growth was performed using solid sources molecular beam epitaxy (MBE) by co-depositing Ge and Mn evap-orated from standard Knudsen effusion cells. Deposition rate was low (≈ 0.2 ˚A.s−1). Germanium substrates were
epi-ready Ge(001) wafers with a residual n-type doping and resistivity of 1015
cm−3and 5 Ω.cm respectively.
Af-ter thermal desorption of the surface oxide, a 40 nm thick Ge buffer layer was grown at 250◦C, resulting in a 2 × 1
surface reconstruction as observed by reflection high en-ergy electron diffraction (RHEED) (see Fig. 1a). Next, 80 nm thick Ge1−xMnx films were subsequently grown
at low substrate temperature (from 80◦C to 200◦C). Mn
content has been determined by x-ray fluorescence mea-surements performed on thick samples (≈ 1 µm thick) and complementary Rutherford Back Scattering (RBS) on thin Ge1−xMnx films grown on silicon. Mn
concen-trations range from 1 % to 11% Mn.
For Ge1−xMnx films grown at substrate temperatures
below 180◦C, after the first monolayer (ML) deposition,
the 2 × 1 surface reconstruction almost totally disap-pears. After depositing few MLs, a slightly diffuse 1 × 1 streaky RHEED pattern and a very weak 2 × 1 re-construction (Fig. 1b) indicate a predominantly two-dimensional growth. For growth temperatures above 180◦C additional spots appear in the RHEED pattern
during the Ge1−xMnx growth (Fig. 1c). These spots
may correspond to the formation of very small secondary phase crystallites. The nature of these crystallites will be
discussed below.
Transmission electron microscopy (TEM) observations were performed using a JEOL 4000EX microscope with an acceleration voltage of 400 kV. Energy filtered trans-mission electron microscopy (EFTEM) was done using a JEOL 3010 microscope equipped with a Gatan Image Fil-ter . Sample preparation was carried out by standard me-chanical polishing and argon ion milling for cross-section investigations and plane views were prepared by wet etch-ing with H3PO4-H2O2 solution [20].
FIG. 1: RHEED patterns recorded during the growth of Ge1−xMnxfilms: (a) 2 × 1 surface reconstruction of the
ger-manium buffer layer. (b) 1 × 1 streaky RHEED pattern ob-tained at low growth temperatures (Tg<180◦C). (c) RHEED
pattern of a sample grown at Tg=180◦C. The additional spots
reveal the presence of Ge3Mn5 clusters at the surface of the
film.
III. STRUCTURAL PROPERTIES
In samples grown at 130◦C and containing 6 % Mn,
we can observe vertical elongated nanostructures i.e. nanocolumns as shown in Fig. 2a. Nanocolumns ex-tend through the whole Ge1−xMnxfilm thickness. From
the high resolution TEM image shown in Fig. 2b, we deduce their average diameter around 3 nm. Moreover in Fig. 2b, the interface between the Ge buffer layer and the Ge1−xMnx film is flat and no defect propagates
from the interface into the film. The Ge1−xMnx film is
a perfect single crystal in epitaxial relationship with the substrate. In Fig. 2c is shown a plane view micrograph of the same sample confirming the presence of nanocolumns in the film. From this image, we can deduce the size and density of nanocolumns. The nanocolumns density is 13000 µm−2 with a mean diameter of 3 nm which is
coherent with cross-section measurements. In order to es-timate the chemical composition of these nanocolumns, we further performed chemical mapping using EFTEM. In Fig. 2d we show a cross sectional Mn chemical map of the Ge1−xMnx film. This map shows that the
forma-tion of nanocolumns is a consequence of Mn segregaforma-tion. Nanocolumns are Mn rich and the surrounding matrix is Mn poor. However, it is impossible to deduce the Mn concentration in Ge1−xMnx nanocolumns from this
cross section. Indeed, in cross section observations, the columns diameter is much smaller than the probed film thickness and the signal comes from the superposititon of the Ge matrix and Mn-rich nanocolumns. In order to quantify Mn concentration inside the nanocolumns and inside the Ge matrix, EELS measurements (not shown here) have been performed in a plane view geometry
3
FIG. 2: Transmission electron micrographs of a Ge1−xMnx
film grown at 130◦C and containing 6 % of manganese. (a)
cross-section along the [110] axis : we clearly see the presence of nanocolumns elongated along the growth axis. (b) High res-olution image of the interface between the Ge1−xMnxfilm and
the Ge buffer layer. The Ge1−xMnx film exhibits the same
diamond structure as pure germanium. No defect can be seen which could be caused by the presence of nanocolumns. (c) Plane view micrograph performed on the same sample con-firms the columnar structure and gives the density and size distribution of nanocolumns. (d) Mn chemical map obtained by energy filtered transmission electron microcopy (EFTEM). The background was carefully substracted from pre-edge im-ages. Bright areas correspond to Mn-rich regions.
[19]. These observations revealed that the matrix Mn content is below 1 % (detection limit of our instrument). Measuring the surface occupied by the matrix and the nanocolumns in plane view TEM images, and consider-ing the average Mn concentration in the sample (6 %), we can estimate the Mn concentration in the nanocolumns. The Mn concentration measured by EELS being between 0% and 1%, we can conclude that the Mn content in the nanocolumns is between 30 % and 38 %.
For samples grown between 80◦C and 150◦C cross section
and plane view TEM observations reveal the presence of Mn rich nanocolumns surrounded with a Mn poor Ge ma-trix. In order to investigate the influence of Mn concen-tration on the structural properties of Ge1−xMnx films,
ten samples have been grown at 100◦C and at 150◦C with
Mn concentrations of 1.3 %, 2.3 %, 4 %, 7 % and 11.3 %. Their structural properties have been investigated by plane view TEM observations.
For samples grown at 100◦C with Mn concentrations
below 5 % the nanocolumns mean diameter is 1.8±0.2 nm. The evolution of columns density as a fonction of Mn concentration is reported in figure 3b. By increasing
FIG. 3: Nanocolumns size and density as a function of growth conditions. Samples considered have been grown at 100◦C
and 150◦C respectively. (a) Mn concentration dependence of
the size distribution. (b) columns density as a function of Mn concentration. (c) Volume fraction of the nanocolumns as a function of Mn concentration.
the Mn concentration from 1.3 % to 4 % we observe a significant increase of the columns density from 13000 to 30000 µm−2. For Mn concentrations higher than 5 % the
density seems to reach a plateau corresponding to 35000 µm−2 and their diameter slightly increases from 1.8 nm
at 4 % to 2.8 nm at 11.3 %. By plotting the volume frac-tion occupied by the columns in the film as a funcfrac-tion of Mn concentration, we observe a linear dependence for Mn contents below 5 %. The non-linear behavior above 5 % may indicate that the mechanism of Mn incorpora-tion is different in this concentraincorpora-tion range, leading to an increase of Mn concentration in the columns or in the matrix. For samples grown at 100◦C, nanocolumns are
always fully coherent with the surrounding matrix (Fig. 4a).
Increasing the Mn content in the samples grown at 150◦C from 1.3 % to 11.3 % leads to a decrease of the
columns density (fig 3b). Moreover, their average di-ameter increases significantly and size distributions be-come very broad (see Fig. 3a). For the highest Mn con-centration (11.3 %) we observe the coexistence of very small columns with a diameter of 2.5 nm and very large columns with a diameter of 9 nm. In samples grown at 150◦C containing 11.3 % of Mn, the crystalline structure
TEM micrographs, one can see columns exhibiting sev-eral different crystalline structures. We still observe some columns which are fully coherent with the Ge matrix like in the samples grown at lower temperature. Nevertheless, observations performed on these samples grown at 150◦C
and with 11.3% Mn reveal some uniaxially [19] or fully relaxed columns exhibiting a misfit of 4 % between the matrix and the columns and leading to misfit dislocations at the interface between the column and the matrix (see fig. 4b). Thus we can conclude that coherent columns are probably in strong compression and the surround-ing matrix in tension. On the same samples (Tg=150◦C,
11.3% Mn), we also observe a large number of highly dis-ordered nanocolumns leading to an amorphous like TEM contrast(fig. 4c).
FIG. 4: Plane view high resolution transmission electron mi-crographs of different types of nanocolumns : (a) typical structure of a column grown at 100◦C. The crystal
struc-ture is exactly the same as germanium . (b) Partially re-laxed nanocolumn. One can see dislocations at the interface between the columns and the matrix leading to stress relax-ation. (c) Amorphous nanocolumn. These columns are typi-cal in samples grown at 150◦C with high Mn contents.
In conclusion, we have evidenced a complex mecha-nism of Mn incorporation in Mn doped Ge films grown at low temperature. In particular Mn incorporation is highly inhomogeneous. For very low growth tempera-tures (below 120◦C) the diffusion of Mn atoms leads to
the formation of Mn rich, vertical nanocolumns. Their density mostly depends on Mn concentration and their mean diameter is about 2 nm. These results can be com-pared with the theoretical predictions of Fukushima et al. [5]: they proposed a model of spinodal decomposi-tion in (Ga,Mn)N and (Zn,Cr)Te based on layer by layer growth conditions and a strong pair attraction between Mn atoms which leads to the formation of nanocolumns. This model may also properly describe the formation of Mn rich nanocolumns in our samples. Layer by layer growth conditions can be deduced from RHEED pattern evolution during growth. For all the samples grown at low temperature, RHEED observations clearly indicate two-dimensional growth. Moreover, Ge/Ge1−xMnx/Ge
heterostructures have been grown and observed by TEM (see Fig. 5). Ge1−xMnx/Ge (as well as Ge/Ge1−xMnx)
interfaces are very flat and sharp thus confirming a two-dimensional, layer by layer growth mode. Therefore we can assume that the formation of Mn rich nanocolumns is a consequence of 2D-spinodal decomposition.
For growth temperatures higher than 160◦C, cross
sec-FIG. 5: Cross section high resolution micrograph of a Ge/Ge1−xMnx/Ge/Ge1−xMnx/Ge heterostructure. This
sample has been grown at 130◦C with 6% Mn. Ge
1−xMnx
layers are 15 nm thick and Ge spacers 5 nm thick. We clearly see the sharpness of both Ge1−xMnx/Ge and Ge/Ge1−xMnx
interfaces. Mn segregation leading to the columns formation already takes place in very thin Ge1−xMnx films.
tion TEM and EFTEM observations (not shown here) re-veal the coexistence of two Mn-rich phases: nanocolumns and Ge3Mn5 nanoclusters embedded in the germanium
matrix. A typical high resolution TEM image is shown in figure 6. Ge3Mn5 clusters are not visible in RHEED
patterns for temperatures below 180◦C. To investigate
the nature of these clusters, we performed x-ray diffrac-tion in θ − 2θ mode. Diffracdiffrac-tion scans were acquired on a high resolution diffractometer using the copper Kα
radi-ation and on the GMT stradi-ation of the BM32 beamline at the European Synchrotron Radiation Facility (ESRF). Three samples grown at different temperatures and/or annealed at high temperature were investigated. The two first samples are Ge1−xMnx films grown at 130◦C
and 170◦C respectively. The third one has been grown at
130◦C and post-growth annealed at 650◦C. By analysing
x-ray diffraction spectra, we can evidence two different crystalline structures. For the sample grown at 130◦C,
the θ − 2θ scan only reveals the (004) Bragg peak of the germanium crystal, confirming the good epitaxial rela-tionship between the layer and the substrate, and the absence of secondary phases in the film in spite of a high dynamics of the order of 107
. For both samples grown at 170◦C and annealed at 650◦C, θ−2θ spectra are identical.
In addition to the (004) peak of germanium, we observe three additional weak peaks. The first one corresponds to the (002) germanium forbidden peak which probably comes from a small distortion of the germanium crystal, and the two other peaks are respectively attributed to the (002) and (004) Bragg peaks of a secondary phase. The c lattice parameter of Ge3Mn5 hexagonal crystal is
5.053 ˚A [21] which is in very good agreement with the values obtained from diffraction data for both (002) and (004) lines assuming that the c axis of Ge3Mn5 is along
5 the [001] direction of the Ge substrate.
FIG. 6: Cross section high resolution transmission elec-tron micrograph of a sample grown at 170◦C. We observe
the coexistence of two different Mn-rich phases: Ge1−xMnx
nanocolumns and Ge3Mn5 clusters.
In summary, in a wide range of growth tempera-tures and Mn concentrations, we have evidenced a two-dimensional spinodal decomposition leading to the for-mation of Mn-rich nanocolumns in Ge1−xMnx films.
This decomposition is probably the consequence of: (i) a strong pair attraction between Mn atoms, (ii) a strong surface diffusion of Mn atoms in germanium even at low growth temperatures and (iii) layer by layer growth con-ditions. We have also investigated the influence of growth parameters on the spinodal decomposition: at low growth temperatures (100◦C), increasing the Mn content leads to
higher columns densities while at higher growth temper-atures (150◦C), the columns density remains nearly
con-stant whereas their size increases drastically. By plotting the nanocolumns density as a function of Mn content, we have shown that the mechanism of Mn incorporation in Ge changes above 5 % of Mn. Finally, using TEM observations and x-ray diffraction, we have shown that Ge3Mn5 nanoclusters start to form at growth
tempera-tures higher than 160◦C.
IV. MAGNETIC PROPERTIES
We have thoroughly investigated the magnetic prop-erties of thin Ge1−xMnx films for different growth
tem-peratures and Mn concentrations. In this section, we focus on Mn concentrations between 2 % and 11 %. We could clearly identify four different magnetic phases in Ge1−xMnx films : diluted Mn atoms in the germanium
matrix, low TC nanocolumns (TC ≤ 170 K), high TC
nanocolumns (TC ≥ 400 K) and Ge3Mn5 clusters (TC
≈ 300 K). The relative weight of each phase clearly de-pends on the growth temperature and to a lesser extend on Mn concentration. For low growth temperature (<
120◦C), we show that nanocolumns are actually made
of four uncorrelated superparamagnetic nanostructures. Increasing Tg above 120◦C, we first obtain continuous
columns exhibiting low TC (< 170 K) and high TC (>
400 K) for Tg ≈130◦C. The larger columns become
fer-romagnetic i.e. TB > TC. Meanwhile Ge3Mn5 clusters
start to form. Finally for higher Tg, the magnetic
contri-bution from Ge3Mn5 clusters keeps increasing while the
nanocolumns signal progressively disappears.
FIG. 7: (a) Temperature dependence of the saturation mag-netization (in µB/Mn) of Ge0.93Mn0.07 samples for different
growth temperatures. The magnetic field is applied in the film plane. The inset shows the temperature dependence of a sample grown at 130◦C and annealed at 650◦C for 15
min-utes. After annealing, the magnetic signal mostly arises from Ge3Mn5 clusters. (b) ZFC-FC measurements performed on
Ge0.93Mn0.07samples for different growth temperatures. The
in-plane applied field is 0.015 T. The ZFC peak at low tem-perature (≤150 K) can be attributed to the superparamag-netic nanocolumns. This peak widens and shifts towards high blocking temperatures when increasing growth temperature. The second peak above 150 K in the ZFC curve which in-creases with increasing growth temperature is attributed to superparamagnetic Ge3Mn5clusters. The increasing ZFC-FC
irreversibility at ≈ 300 K is due to the increasing contribution from large ferromagnetic Ge3Mn5clusters. The nanocolumns
signal completely vanishes after annealing at 650◦C for 15
minutes.
In Fig. 7a, the saturation magnetization at 2 Tesla in µB/Mn of Ge1−xMnx films with 7 % of Mn is plotted
as a function of temperature for different growth tem-peratures ranging from Tg=90◦C up to 160◦C. The inset
shows the temperature dependence of the magnetization at 2 Tesla after annealing at 650◦C during 15 minutes.
Figure 7b displays the corresponding Zero Field Cooled - Field Cooled (ZFC-FC) curves recorded at 0.015 Tesla. In the ZFC-FC procedure, the sample is first cooled down to 5 K in zero magnetic field and the susceptibility is subsequently recorded at 0.015 Tesla while increasing the temperature up to 400 K (ZFC curve). Then, the suscep-tibility is recorded under the same magnetic field while decreasing the temperature down to 5 K (FC curve).
Three different regimes can be clearly distinguished. For Tg≤120◦C, the temperature dependence of the
sat-uration magnetization remains nearly the same while increasing growth temperature. The overall magnetic signal vanishing above 200 K is attributed to the nanocolumns whereas the increasing signal below 50 K originates from diluted Mn atoms in the surrounding ma-trix. The Mn concentration dependence of the saturation magnetization is displayed in figure 8. For the lowest Mn concentration (4 %), the contribution from diluted Mn atoms is very high and drops sharply for higher Mn con-centrations (7 %, 9 % and 11.3 %). Therefore the frac-tion of Mn atoms in the diluted matrix decreases with Mn concentration probably because Mn atoms are more and more incorporated in the nanocolumns. In parallel, the Curie temperature of nanocolumns increases with the Mn concentration reaching 170 K for 11.3 % of Mn. This behavior may be related to different Mn compositions and to the increasing diameter of nanocolumns (from 1.8 nm to 2.8 nm) as discussed in section III.
FIG. 8: Temperature dependence of the saturation magneti-zation (in µB/Mn) of Ge1−xMnxfilms grown at 100◦C plotted
for different Mn concentrations: 4.1 %; 7 %; 8.9 % and 11.3 %.
ZFC-FC measurements show that the nanocolumns are superparamagnetic. The magnetic signal from the di-luted Mn atoms in the matrix is too weak to be detected in susceptibility measurements at low temperature. In samples containing 4 % of Mn, ZFC and FC curves su-perimpose down to low temperatures. As we do not ob-serve hysteresis loops at low temperature, we believe that at this Mn concentration nanocolumns are superparam-agnetic in the whole temperature range and the blocking temperature cannot be measured. For higher Mn con-tents, the ZFC curve exhibits a very narrow peak with a maximum at the blocking temperature of 15 K what-ever the Mn concentration and growth temperature (see Fig. 7b). Therefore the anisotropy barrier distribution is narrow and assuming that nanocolumns have the same magnetic anisotropy, this is a consequence of the very narrow size distribution of the nanocolumns as observed
by TEM. To probe the anisotropy barrier distribution, we have performed ZFC-FC measurements but instead of warming the sample up to 400 K, we stopped at a lower temperature T0.
FIG. 9: Schematic drawing of the anisotropy barrier distribu-tion n(EB) of superparamagnetic nanostructures. If magnetic
anisotropy does not depend on the particle size, this distri-bution exactly reflects their magnetic size distridistri-bution. In this drawing the blocking temperature (TB) corresponds to
the distribution maximum. At a given temperature T0 such
that 25kBT0falls into the anisotropy barrier distribution, the
largest nanostructures with an anisotropy energy larger than 25kBT0 are blocked whereas the others are
superparamag-netic.
If this temperature falls into the anisotropy barrier dis-tribution as depicted in Fig. 9, the FC curve deviates from the ZFC curve. Indeed the smallest nanostructures have become superparamagnetic at T0and when
decreas-ing again the temperature, their magnetization freezes along a direction close to the magnetic field and the FC susceptibility is higher than the ZFC susceptibility. Therefore any irreversibility in this procedure points at the presence of superparamagnetic nanostructures. The results are given in Fig. 10a. ZFC and FC curves clearly superimpose up to T0=250 K thus the nanocolumns are
superparamagnetic up to their Curie temperature and no Ge3Mn5clusters could be detected. Moreover for low T0
values, a peak appears at low temperature in FC curves which evidences strong antiferromagnetic interactions be-tween the nanocolumns [22].
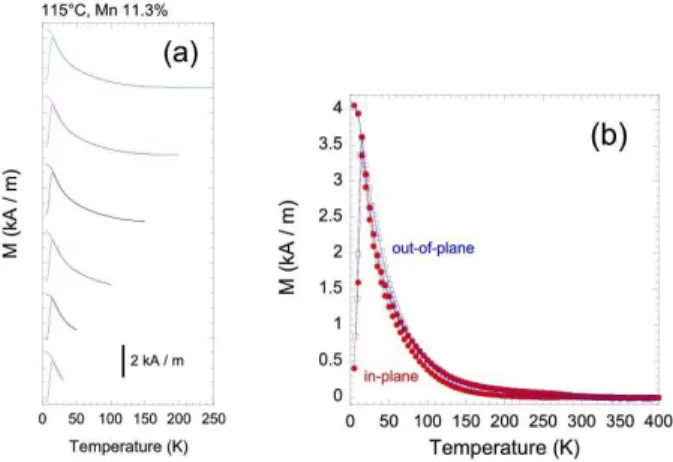
In order to derive the magnetic size and anisotropy of the Mn-rich nanocolumns embedded in the Ge ma-trix, we have fitted the inverse normalized in-plane (resp. out-of-plane) susceptibility: χ−1k (resp. χ−1⊥ ). The cor-responding experimental ZFC-FC curves are reported in Fig. 10b. Since susceptibility measurements are per-formed at low field (0.015 T), the matrix magnetic sig-nal remains negligible. In order to normalize suscepti-bility data, we need to divide the magnetic moment by the saturated magnetic moment recorded at 5 T. How-ever the matrix magnetic signal becomes very strong at 5 T and low temperature so that we need to sub-tract it from the saturated magnetic moment using a
7
FIG. 10: (a) ZFC-FC measurements performed on a
Ge0.887Mn0.113sample grown at 115◦C. The in-plane applied
field is 0.015 T. Magnetization was recorded up to different T0 temperatures: 30 K, 50 K, 100 K, 150 K, 200 K and 250
K. Curves are shifted up for more clarity. (b) ZFC-FC curves for in-plane and out-of-plane applied fields (0.015 T).
simple Curie function. From Fig. 10b, we can con-clude that nanocolumns are isotropic. Therefore to fit experimental data we use the following expression well suited for isotropic systems or cubic anisotropy: χ−1k = χ−1⊥ ≈ 3kBT /M (T ) + µ0Hef f(T ). kB is the
Boltz-mann constant, M = Msv is the magnetic moment of a
single-domain nanostructure (macrospin approximation) where Ms is its magnetization and v its volume. The
in-plane magnetic field is applied along [110] or [−110] crystal axes. Since the nanostructures Curie tempera-ture does not exceed 170 K, the temperatempera-ture dependence of the saturation magnetization is also accounted for by writting M (T ). Antiferromagnetic interactions between nanostructures are also considered by adding an effec-tive field estimated in the mean field approximation [23]: µ0Hef f(T ). The only fitting parameters are the
max-imum magnetic moment (i.e. at low temperature) per nanostructure: M (in Bohr magnetons µB) and the
maxi-mum interaction field (i.e. at low temperature): µ0Hef f.
In Fig. 11, the best fits lead to M ≈1250 µB
and µ0Hef f ≈102 mT for in-plane susceptibility and
M ≈1600 µB and µ0Hef f ≈98 mT for out-of-plane
sus-ceptibility. It gives an average magnetic moment of 1425 µB per column and an effective interaction field of 100
mT. Using this magnetic moment and its temperature dependence, magnetization curves could be fitted us-ing a Langevin function and M (H/T ) curves superim-pose for T <100 K. However, from the saturated mag-netic moment of the columns and their density (35000 µm−2), we find almost 6000 µ
B per column. Therefore,
for low growth temperatures, we need to assume that nanocolumns are actually made of almost four indepen-dent elongated magnetic nanostructures. The effective field for antiferromagnetic interactions between nanos-tructures estimated from the susceptibility fits is at least
FIG. 11: Temperature dependence of the inverse in-plane (open circles) and out-of-plane (open squares) normalized sus-ceptibilities of a Ge0.887Mn0.113sample grown at 115◦C. Fits
were performed assuming isotropic nanostructures or cubic anisotropy. Dashed line is for in-plane susceptibility and solid line for out-of-plane susceptibility.
one order of magnitude larger than what is expected from pure magnetostatic coupling. This difference may be due to either an additional antiferromagnetic coupling through the matrix which origin remains unexplained or to the mean field approximation which is no more valid in this strong coupling regime. As for magnetic anisotropy, the nanostructures behave as isotropic magnetic systems or exhibit a cubic magnetic anisotropy. First we can confirm that nanostructures are not amorphous other-wise shape anisotropy would dominate leading to out-of-plane anisotropy. We can also rule out a random distri-bution of magnetic easy axes since the nanostructures are clearly crystallized in the diamond structure and would exhibit at least a cubic anisotropy (except if the ran-dom distribution of Mn atoms within the nanostructures can yield random easy axes). Since the nanostructures are in strong in-plane compression (their lattice param-eter is larger than the matrix one), the cubic symmetry of the diamond structure is broken and magnetic cubic anisotropy is thus unlikely. We rather believe that out-of-plane shape anisotropy is nearly compensated by in-out-of-plane magnetoelastic anisotropy due to compression leading to a pseudo cubic anisotropy. From the blocking tempera-ture (15 K) and the magnetic volume of the nanostruc-tures , we can derive their magnetic anisotropy constant using Kv = 25kBTB: K≈10 kJ.m−3which is of the same
order of magnitude as shape anisotropy.
For growth temperatures Tg≥120◦C and Mn
concen-trations ≥ 7 %, samples exhibit a magnetic signal above 200 K corresponding to Ge3Mn5 clusters (see Fig. 7a).
As we can see, SQUID measurements are much more sen-sitive to the presence of Ge3Mn5 clusters, even at low
concentration, than TEM and x-ray diffraction used in section III. We also observe a sharp transition in the ZFC curve (see Fig. 7b, Fig. 12a and 12b): the peak becomes very large and is shifted towards high
block-FIG. 12: (a) ZFC-FC measurements performed on a Ge0.93Mn0.07 sample grown at 122◦C. The in-plane applied
field is 0.015 T. Magnetization was recorded up to different T0 temperatures: 50 K, 100 K, 150 K, 200 K and 250 K.
Curves are shifted up for more clarity. (b) ZFC-FC curves for in-plane and out-of-plane applied fields (0.015 T).
ing temperatures (the signal is maximum at T =23 K). This can be easily understood as a magnetic percolation of the four independent nanostructures obtained at low growth temperatures into a single magnetic nanocolumn. Therefore the magnetic volume increases sharply as well as blocking temperatures. At the same time, the size distribution widens as observed in TEM. In Fig. 12a, we have performed ZFC-FC measurements at different T0temperatures. The ZFC-FC irreversibility is observed
up to the Curie temperature of ≈120 K meaning that a fraction of nanocolumns is ferromagnetic (i.e. TB≥ TC).
In Fig. 12b, in-plane and out-of-plane ZFC curves nearly superimpose for T ≤150 K due to the isotropic mag-netic behavior of the nanocolumns: in-plane magnetoe-lastic anisotropy is still compensating out-of-plane shape anisotropy. Moreover the magnetic signal above 150 K corresponding to Ge3Mn5 clusters that start to form in
this growth temperature range is strongly anisotropic. This perpendicular anisotropy confirms the epitaxial re-lation: (0002) Ge3Mn5 k (002) Ge discussed in Ref.[12].
The magnetic easy axis of the clusters lies along the hexagonal c-axis which is perpendicular to the film plane. For growth temperatures Tg≥145◦C the cluster
mag-netic signal dominates (Fig. 13b). Superparamag-netic nanostructures are investigated performing ZFC-FC measurements at different T0 temperatures (Fig.
13a). The first ZFC peak at low temperature i.e. ≤ 150 K is attributed to low-TC nanocolumns (TC ≈130 K).
This peak is wider than for lower growth temperatures and its maximum is further shifted up to 30 K. These re-sults are in agreement with TEM observations: increas-ing Tg leads to larger nanocolumns (i.e. higher
block-ing temperatures) and wider size distributions. ZFC-FC irreversibility is observed up to the Curie temperature due to the presence of ferromagnetic columns. The
sec-FIG. 13: (a) ZFC-FC measurements performed on a Ge0.887Mn0.113sample grown at 145◦C. The in-plane applied
field is 0.015 T. Magnetization was recorded up to different T0 temperatures: 50 K, 100 K, 150 K, 200 K, 250 K and 300
K. Curves are shifted up for more clarity. (b) ZFC-FC curves for in-plane and out-of-plane applied fields (0.015 T).
ond peak above 180 K in the ZFC curve is attributed to Ge3Mn5clusters and the corresponding ZFC-FC
irre-versibility persisting up to 300 K means that some clus-ters are ferromagnetic. We clearly evidence the out-of-plane anisotropy of Ge3Mn5 clusters and the isotropic
magnetic behavior of nanocolumns (Fig. 13b). In this growth temperature range, we have also investigated the Mn concentration dependence of magnetic properties.
FIG. 14: Temperature dependence of the saturation magneti-zation (in µB/Mn) of Ge1−xMnxfilms grown at 150◦C plotted
for different Mn concentrations: 2.3 %; 4 %; 7 %; 9 %; 11.3 %. (b) ZFC-FC measurements performed on Ge1−xMnxfilms
grown at 150◦C. The in-plane applied field is 0.025 T for 2.3
% and 4 % and 0.015 T for 8 % and 11.3 %.
In Fig. 14a, for low Mn concentrations (2.3 % and 4 %) the contribution from diluted Mn atoms in the germanium matrix to the saturation magnetization is very high and nearly vanishes for higher Mn concentra-tions (7 %, 9 % and 13 %) as observed for low growth temperatures. Above 7 %, the magnetic signal mainly comes from nanocolumns and Ge3Mn5 clusters. We can
9 (Fig. 14b). Indeed, for 2.3 % of Mn, ZFC and FC curves
nearly superimpose down to low temperature meaning that nanocolumns are superparamagnetic in the whole temperature range. Moreover the weak irreversibility arising at 300 K means that some Ge3Mn5 clusters
have already formed in the samples even at very low Mn concentrations. For 4 % of Mn, we can observe a peak with a maximum at the blocking temperature (12 K) in the ZFC curve. We can also derive the Curie temperature of nanocolumns: ≈45 K. The irresversibil-ity arising at 300 K still comes from Ge3Mn5 clusters.
Increasing the Mn concentration above 7 % leads to: higher blocking temperatures (20 K and 30 K) due to larger nanocolumns and wider ZFC peaks due to wider size distributions in agreement with TEM observations (see Fig. 3a). Curie temperatures also increase (110 K and 130 K) as well as the contribution from Ge3Mn5
clusters.
Finally when increasing Tg above 160◦C, the
nanocolumns magnetic signal vanishes and only Ge3Mn5 clusters and diluted Mn atoms coexist. The
overall magnetic signal becomes comparable to the one measured on annealed samples in which only Ge3Mn5
clusters are observed by TEM (see Fig. 7a).
The magnetic properties of high-TC nanocolumns
ob-tained for Tg close to 130◦C are discussed in detail in
Ref.[19].
In conclusion, at low growth temperatures (Tg≤120◦C),
nanocolumns are made of almost 4 independent elon-gated magnetic nanostructures. For Tg ≥120◦C, these
independent nanostructures percolate into a single nanocolumn sharply leading to higher blocking tempera-tures. Increasing Tgleads to larger columns with a wider
size distribution as evidenced by ZFC-FC measurements and given by TEM observations. In parallel, some Ge3Mn5 clusters start to form and their contribution
increases when increasing Tg. Results on magnetic
anisotropy seems counter-intuitive. Indeed Ge3Mn5
clusters exhibit strong out-of-plane anisotropy whereas nanocolumns which are highly elongated magnetic structures are almost isotropic. This effect is probably due to compensating in-plane magnetoelastic coupling (due to the columns compression) and out-of-plane shape anisotropy.
V. CONCLUSION
In this paper, we have investigated the structural and magnetic properties of thin Ge1−xMnx films grown by
low temperature molecular beam epitaxy. A wide range of growth temperatures and Mn concentrations have been explored. All the samples contain Mn-rich nanocolumns as a consequence of 2D-spinodal decomposition. However their size, crystalline structure and magnetic properties depend on growth temperature and Mn concentration. For low growth temperatures, nanocolumns are very small (their diameter ranges between 1.8 nm for 1.3 % of Mn and 2.8 nm for 11.3 % of Mn), their Curie tempera-ture is rather low (< 170 K) and they behave as almost four uncorrelated superparamagnetic nanostructures. In-creasing Mn concentration leads to higher columns densi-ties while diameters remain nearly unchanged. For higher growth temperatures, the nanocolumns mean diameter increases and their size distribution widens. Moreover the 4 independent magnetic nanostructures percolate into a single magnetic nanocolumn. Some columns are ferromagnetic even if Curie temperatures remain quite low. In this regime, increasing Mn concentration leads to larger columns while their density remains nearly the same. In parallel, Ge3Mn5 nanoclusters start to form
in the film with their c-axis perpendicular to the film plane. In both temperature regimes, the Mn incorpora-tion mechanism in the nanocolumns and/or in the matrix changes above 5 % of Mn and nanocolumns exhibit an isotropic magnetic behaviour due to the competing ef-fects of out-of-plane shape anisotropy and in-plane mag-netoelastic coupling. Finally for a narrow range of growth temperatures around 130◦C, nanocolumns exhibit Curie
temperatures higher than 400 K. Our goal is now to inves-tigate the crystalline structure inside the nanocolumns, in particular the position of Mn atoms in the distorted diamond structure, which is essential to understand mag-netic and future transport properties in Ge1−xMnxfilms.
VI. AKNOWLEDGEMENTS
The authors would like to thank Dr. F. Rieutord for grazing incidence x-ray diffraction measurements per-formed on the GMT station of BM32 beamline at the European Synchrotron Radiation Facility.
[1] H. Ohno, D. Chiba, F. Matsukura, T. Omiya, E. Abe, T. Dietl, Y. Ohno, and K. Ohtani, Nature 408, 944 (2000).
[2] H. Boukari, P. Kossacki, M. Bertolini, D. Ferrand, J. Cib-ert, S. Tatarenko, A. Wasiela, J. A. Gaj, and T. Dietl,
Phys. Rev. Lett. 88, 207204 (2002).
[3] T. Dietl, Semicond. Sci. Technol. 17, 377 (2002). [4] T. Dietl, Nature Mat. 5, 673 (2006).
[5] T. Fukushima, K. Sato, H. Katayama-Yoshida, and P. H. Dederichs, Jpn. J. Appl. Phys 45, L416 (2006).
[6] Y. D. Park, A. T. Hanbicki, S. C. Erwin, C. S. Hellberg, J. M. Sullivan, J. E. Mattson, T. F. Ambrose, A. Wilson, G. Spanos, and B. T. Jonker, Science 295, 651 (2002). [7] N. Pinto, L. Morresi, M. Ficcadenti, R. Murri,
F. D’Orazio, F. Lucari, L. Boarino, and G. Amato, Phys. Rev. B 72, 165203 (2005).
[8] A. P. Li, J. F. Wendelken, L. C. Feldman, J. R. Thomp-son, and H. H. Weitering, Appl. Phys. Lett. 86, 152507 (2005).
[9] F. Tsui, L. He, L. Ma, A. Tkachuk, Y. S. Chu, K. Naka-jima, and T. Chikyow, Phys. Rev. Lett. 91, 177203 (2003).
[10] S. Cho, S. Choi, S. C. Hong, Y. Kim, J. B. Ketterson, B.-J. Kim, Y. C. Kim, and J. H. Jung, Phys. Rev. B 66, 033303 (2002).
[11] J.-S. Kang, G. Kim, S. C. Wi, S. S. Lee, S. Choi, S. Cho, S. Han, K. H. Kim, H. J. Song, H. J. Shin, et al., Phys. Rev. Lett. 94, 147202 (2005).
[12] C. Bihler, C. Jaeger, T. Vallaitis, M. Gjukic, M. S. Brandt, E. Pippel, J. Woltersdorf, and U. G¨osele, Appl. Phys. Lett. 88, 112506 (2006).
[13] L. Morresi, J. Ayoub, N. Pinto, M. Ficcadenti, R. Murri, A. Ronda, and I. Berbezier, Mat. Sci. Semicond. Process 9, 836 (2006).
[14] M. Passacantando, L. Ottaviano, F. D’Orazio, F. Lucari, M. D. Biase, G. Impellizzeri, and F. Priolo, Phys. Rev.
B 73, 195207 (2006).
[15] S. Ahlers, D. Bougeard, N. Sircar, G. Abstreiter, A. Trampert, M. Opel, and R. Gross, Phys. Rev. B 74, 214411 (2006).
[16] T. B. Massalski, Binary Alloy Phase Diagrams, vol. 2 (American Society for Metals, Metals Park, OH, 1990). [17] Y. D. Park, A. Wilson, A. T. Hanbicki, J. E. Mattson,
T. Ambrose, G. Spanos, and B. T. Jonker, Appl. Phys. Lett. 78, 2739 (2001).
[18] S. Sugahara, K. L. Lee, S. Yada, and M. Tanaka, Jpn. J. Appl. Phys. 44, 1426 (2005).
[19] M. Jamet, A. Barski, T. Devillers, V. Poydenot, R. Du-jardin, P. Bayle-Guillemaud, J. Rothman, E. Bellet-Amalric, A. Marty, J. Cibert, et al., Nature Mat. 5, 653 (2006).
[20] S. Kagawa, T. Mikawa, and T. Kaneda, Jpn. J. Appl. Phys. 21, 1616 (1982).
[21] J. B. Forsyth and P. J. Brown, J. Phys.: Condens. Matter 2, 2713 (1990).
[22] R. W. Chantrell, N. Walmsley, J. Gore, and M. Maylin, Phys. Rev. B 63, 024410 (2000).
[23] O. Fruchart, P.-O. Jubert, C. Meyer, M. Klaua, J. Barthel, and J. Kirschner, J. Magn. Magn. Mat. 239, 224 (2002).