HAL Id: hal-02421845
https://hal.inria.fr/hal-02421845
Submitted on 20 Dec 2019HAL is a multi-disciplinary open access archive for the deposit and dissemination of sci-entific research documents, whether they are pub-lished or not. The documents may come from teaching and research institutions in France or abroad, or from public or private research centers.
L’archive ouverte pluridisciplinaire HAL, est destinée au dépôt et à la diffusion de documents scientifiques de niveau recherche, publiés ou non, émanant des établissements d’enseignement et de recherche français ou étrangers, des laboratoires publics ou privés.
Optimal integration of microalgae production with
photovoltaic panels: environmental impacts and energy
balance
Marjorie Morales, Arnaud Hélias, Olivier Bernard
To cite this version:
Marjorie Morales, Arnaud Hélias, Olivier Bernard. Optimal integration of microalgae production with photovoltaic panels: environmental impacts and energy balance. Biotechnology for Biofuels, BioMed Central, 2019, 12 (1), pp.239. �10.1186/s13068-019-1579-4�. �hal-02421845�
Optimal integration of microalgae production with photovoltaic panels: environmental
1
impacts and energy balance
2 3
Marjorie Moralesa*, Arnaud Héliasb,c and Olivier Bernarda.
4
a INRIA BIOCORE, BP 93 06902 Sophia Antipolis Cedex, France.
5
b Laboratoire de Biotechnologie de l’Environnement, Montpellier SupAgro, INRA, Univ Montpellier,
6
2 Place Pierre Viala, 34060 Montpellier Cedex 1, France 7
c Elsa, Research Group for Environmental Life cycle Sustainability Assessment, Montpellier, France.
8 9
* Corresponding autor: marjorie-alejandra.morales@inria.fr. Tel. +33(0)492387180 10
Email: A. Hélias: arnaud.helias@supagro.fr; O. Bernard: olivier.bernard@inria.fr 11
12
Abstract
13
Background: Microalgae are 10 to 20 times more productive than the current agricultural biodiesel 14
producing oleaginous crops. However, they require larger energy supplies, so that their environmental 15
impacts remain uncertain, as illustrated by the contradictory results in the literature. Besides, during 16
most of the year, solar radiation is too high relative to the photosynthetic capacity of microalgae. This 17
leads to photosaturation, photoinhibition, overheating and eventually induces mortality. Shadowing 18
microalgae with solar panels would therefore be a promising solution for both increasing productivity 19
during hotter periods and producing local electricity for the process. The main objective of this study 20
is to measure, via LCA framework, the energy performance and environmental impact of microalgae 21
biodiesel produced in a solar greenhouse, alternating optimal microalgae species and photovoltaic 22
panel (PV) coverage. A mathematical model is simulated to investigate the microalgae productivity in 23
raceways under meteorological conditions in Sophia Antipolis (south of France) at variable coverture 24
percentages (0% to 90%) of CIGS solar panels on greenhouses constructed with low-emissivity (low-25
E) glass. 26
Results: A trade-off must be met between electricity and biomass production, as a larger photovoltaic 27
coverture would limit microalgae production. From an energetic point of view, the optimal 28
configuration lies between 10% and 20% of PV coverage. Nevertheless, from an environmental point 29
of view, the best option is 50% PV coverage. However, the difference between impact assessments 30
obtained for 20% and 50% PV is negligible, while the NER is 48% higher for 20% PV than for 50% 31
PV coverage. Hence, A 20% coverture of photovoltaic panels is the best scenario from an energetic 32
and environmental point of view. 33
Conclusions: In comparison with the cultivation of microalgae without PV, the use of photovoltaic 34
panels triggers a synergetic effect, acting both as a source of electricity and in reducing climate 35
change impacts. Considering an economic approach, low photovoltaic panel coverage would probably 36
be more attractive. However, even with a 10% area of photovoltaic panels, the environmental 37
footprint would already significantly decrease. It is expected that significant improvements in 38
microalgae productivity or more advanced production processes should rapidly enhance these 39
performances. 40
Keywords: Biodiesel; Chlorococcum sp.; Desmodesmus sp.; Life cycle assessment; Raceway; 41 Renewable energy. 42 43 44 45 46 47 48 49 50 51 52 53
Background
54 55
Renewable liquid fuels are expected to play an essential role in reaching targets to replace petroleum-56
derived transportation fuels with a viable alternative, and to contribute to the reduction of GHG 57
emissions. Although biodiesel from oleaginous crops and bioethanol from sugarcane are being 58
produced in increasing amounts as renewable liquid fuels, their production cannot sustainably address 59
the demand [1]. Hence, alternative sources of biomass are required to supply this increasing demand. 60
Microalgae-based oil is currently being considered as a promising alternative raw material for 61
biodiesel [2]. 62
Microalgae are photosynthetic microorganisms that transform sunlight, water and carbon dioxide into 63
chemical energy. This energy is stored as chemical bound energy, especially into lipids, carbohydrates 64
and proteins. Oil extracted from microalgae species can then be converted into biodiesel [3]. In turn, 65
biodiesel is a form of solar energy. Conventional agricultural oil crops are widely used to produce 66
biodiesel; however, the oil fraction is very low (around 5% of total biomass basis) compared with 67
certain species of microalgae whose oil content can exceed 60% of dry weight [1]. 68
Microalgae has several advantages over land-based crops in terms of oil production: high biomass 69
productivity, no competition with feed crops, possibility to uptake industrial sources of CO2 and
70
reduced competition for land [2]. Microalgae has the possibility to grow on marginal land by using 71
brackish or seawater avoiding its competition for resources with conventional agriculture. Their 72
simple unicellular structure and high photosynthetic efficiency allow for a potentially higher oil yield 73
per area than the best oilseed crops [4] and its culture do not require herbicides nor pesticides [5]. 74
Despite these advantages, microalgae-based fuels are still not widely produced, mainly due to their 75
current cost of production [4]. Simultaneous algae biomass production and lipid accumulation is one 76
of the main economic and technological bottlenecks [6]. Productive microalgae species and optimized 77
culture conditions allowing for the production of strains with a simultaneously high growth rate and 78
lipid content are necessary. The high cost and energy demand of harvesting diluted algae cells also 79
remain a major challenge. 80
The use of microalgae for generating energy requires large-scale, low-cost production. This implies 81
cheap, scalable reactor designs with high algal productivity. Many different algal cultivation systems 82
have been developed, which can be divided into two main categories, open and closed. Closed 83
systems, consist of containers, tubes or transparent plastic bags of various sizes closed to the 84
atmosphere [7], while open systems consist of natural or agitated artificial ponds and containers open 85
to the atmosphere. 86
To date, most commercial production have taken place in open ponds, thanks to their low cost and 87
ease of construction and operation [7]. The most common technical design is the raceway pond: an 88
oblong, looped pond mixed with a paddlewheel. However, some disadvantages of open systems have 89
been detected, such as high evaporation rates, diffusion of CO2 to the atmosphere, contamination with
90
competing species and low control of solar radiation and temperature [7]. Ponds enclosed in glass 91
houses or plastic-covered greenhouses which allow a better control of the growth environment [8]. 92
Climate control in greenhouses contributes to maintain a better-adapted temperature for growth and 93
therefore enhances the productivity. In addition, it reduces water losses through evaporation as well as 94
the risk of contamination by other algal species or grazers [9]. 95
Light and temperature influence algal biomass productivity and lipid cell content [10-12]. High 96
irradiance and high temperature generate an increase in triglyceride synthesis, with a more saturated 97
fatty acid composition compared to conditions at low irradiance and/or temperature [13]. Since light 98
and temperature vary seasonally, these factors are crucial for learning the lipid composition and 99
accumulation in outdoor cultivation systems. Microalgae species should be alternated during the year 100
to best adapt to the season, and thus improve yearly production. Hence, the seasonal variation of lipid 101
productivity results from several processes, which need to be accounted for in order to accurately 102
estimate the algal oil yield 103
Moreover, solar radiation is, for most of the year, too high relative to the photosynthetic capacity of 104
microalgae, thus leading to photosaturation, photoinhibition, also leading to overwarming eventually 105
significantly increasing mortality [9]. Shadowing the microalgae with solar panels therefore turns out 106
to be a promising solution for both increasing productivity during hotter periods and producing local 107
electricity for the process. Jez, Fierro [14] demonstrated an increase in economic competitiveness for 108
microalgae biofuels when photovoltaic panels were used as a source of electricity in the facility. It is 109
also a noteworthy option for producing algal biofuel in remote areas (typically deserts) that are long-110
distance or difficult access to the electric grid. 111
Solar photovoltaic panels (PV) provide energy security, reduce medium temperature and avoid 112
photoinhibition in microalgae cultures [15]. However, building PV also produces greenhouse gas 113
emissions due to energy consumption during the manufacturing processes. Investment costs on PV 114
technology are still relatively high [16] but they are constantly decreasing due to both technology 115
improvements and increases in production scales [17]. The most common PV technology is 116
Crystalline silicon (single-crystalline sc-Si and multi-crystalline mc-Si), followed by Cadmium-117
Telluride (CdTe) and Copper Indium Gallium (di) Selenide (CIGS) [17]. Therefore, the viability of PV 118
panels combined with biomass production strongly depends on the geographical location, on local 119
sunlight radiation and on electricity costs. 120
Coupling biomass production with photovoltaic electricity represents an ideal opportunity for 121
significantly reducing environmental impacts and electrical demands for biodiesel production systems. 122
Although this solution is technologically appealing, its sustainability can be questionable as there is a 123
clear trade-off between electricity and biomass production, as a larger photovoltaic panels coverture 124
would limit microalgae production. The large seasonal variations in biomass production alter the value 125
chain as well as its environmental impacts. Quantification of the environmental impacts of algal oil 126
production is therefore necessary. Life cycle assessment (LCA) is a standardized tool that provides a 127
quantitative and scientific analysis of the environmental impacts of products and their industrial 128
systems [18]. The functional unit (FU) considered is 1 MJ of algal methyl ester (biodiesel), used in a 129
conventional internal combustion automobile engine. The system boundary is defined as a set of 130
criteria specifying which unit processes are part of a product system, while the life cycle inventory is a 131
list of input and output components at each step of the production process [19]. 132
The main objective of this study is to measure, via LCA framework, the energy performance and 133
environmental impacts of microalgae-based biodiesel produced in a solar greenhouse, alternating 134
optimal microalgae species and photovoltaic panel coverture percentages, to determine the optimal 135
energetic environmental configuration. This prospective assessment is carried out with an eco-design 136
approach to tackle the main features of the system. In addition, four references cases complying with 137
similar system boundaries and allocation approaches have been provided, only as benchmarking 138
systems and not for purposes of comparative assertion. A mathematical model is simulated to 139
investigate the microalgae productivity in raceways under meteorological conditions in Sophia 140
Antipolis (south of France) at variable coverture percentages (0% to 90%) of CIGS solar panels on 141
greenhouses. Biomass productivity and electricity production results are used as input in a process 142
sequence of a virtual facility for biodiesel production over 145 ha, and thereafter, as input to a life 143
cycle inventory implemented into SimaPro 8 software [20]. Three aspects of microalgae production 144
were analyzed: potential environmental impacts, energy and carbon balance. 145 146 Methods 147 148 System description 149
From a ‘pond to wheel” point of view, the scope of the system encompasses the production of 150
biomass, process conversion and its combustion in a middle-sized car. The construction, dismantling 151
and final disposal of the infrastructure and machinery were also included, as well as the production of 152
chemicals and their transport. The process is divided into six main areas, also called sub-systems. 153
Figure 1 illustrates the general schematic of the system boundaries and subsystems. 154
Subsystem 1 considers raceway systems for microalgae biomass production coupled with upstream 155
inoculum production operations. Subsystem 2 includes harvesting and dewatering steps, which help to 156
increase the biomass solid content for processing through subsequent conversion operations to obtain 157
biodiesel: oil extraction (Subsystem 3) and oil conversion (Subsystem 4). The design also includes the 158
combustion of microalgae biodiesel (Subsystem 6) and photovoltaic electricity production (Subsystem 159
5). The infrastructure construction and machinery production and dismantling are also considered. 160
161
Figure 1 around here 162
The size of the facility is assessed for a total production area of 145 ha (including inoculum ponds and 164
downstream processes). The overall site layout assumes that ponds are grouped into unit “modules” of 165
about 5 ha (50 868 m2) each. Each module represents a standard greenhouse, constructed with
low-166
emissivity (low E) glass (KGlassTM from Pilkington: thickness=4 mm, transmittance=82%, density=
167
10 kg·m-2, lifespan= 30 years) [21] for walls and roof, supported by a steel frame. Low E is an
168
essential contributor to energy conservation, since it reflects energy back into the greenhouse, 169
achieving much lower heat loss than ordinary glass [21], and eventually extending the production 170
period. The greenhouse structure also includes a climate control system through ventilation. It allows 171
for medium temperatures to be maintained close to the optimal growth temperature of the microalgae. 172
The ventilation system consists in favoring air flow by opening and closing the windows (flow rates 173
fixed to 50 m3·s-1·greenhouse-1 and 500 m3·s-1·greenhouse-1, windows are closed and open,
174
respectively). 175
The layout of the greenhouses within the overall facility footprint along with the pipelines and roads 176
required for on-site circulation and transport of materials is detailed in the Additional material 2.1. 177
The full facility contains 122 ha of biomass production raceways grouped into 24 individual 178
greenhouses (including 2 for inoculum ponds) connected via a network of pipelines and roadways. 179
The greenhouses form a uniform grid of four columns by six rows. The rows comprise the raceway 180
pond modules as well as the inoculum ponds. The facility also includes a dewatering section, a 181
nutrient and freshwater storage section, and algal biomass conversion sections. Roads with access to 182
all modules are 2 m wide between columns and 2 m wide between rows. The module dimensions 183
include spacing for piping, electricity and roads on the border for access to the ponds. The nutrient 184
and freshwater storage section provides bulk storage for water and nutrient inputs, while biodiesel is 185
stored in the esterification section. 186
The production facility is located in Southern Europe (Sophia Antipolis - France, 43°36′56″N, 187
7°03′18″E), close enough to the Mediterranean coast to allow access to seawater. The geographic 188
location of facility has the highest impact on biomass productivity. The climatic conditions of the 189
chosen location should allow for high biomass productivity throughout the year. The main factors 190
affecting biomass productivity are the average annual irradiance level and temperature. Ideally, the 191
temperature should be around 25°C with minimum diurnal and seasonal variations [8]. Other 192
considerations also have to be taken into account, such as humidity and rainfall, the possibility of 193
storms and flood events and the presence of dust and other atmospheric pollutants [8]. Meteorological 194
data were collected at INRA PACA, Sophia Antipolis in 2015. These data were used to simulate the 195
dynamics of temperature and light in the cultivation medium, for the various tested designs. 196
Access to carbon dioxide and water of suitable quality are important. The algae culture and its 197
transformation should both take place at the same site. The facility is assumed to be established on an 198
initially shrub land and is modelled as an industrial area with vegetation. 199
200
Co-product consideration in the assessment 201
If more than one product is delivered from the system processes, all system flows must be weighted 202
and divided proportionally to the energy content of the products, and to the mass or market value. 203
This division is called allocation. Another approach consists in substitution, which takes into account 204
all products that can be replaced by the co-products; the system therefore receives credits for having 205
cut down on the use of the initial product. The choice of performing co-product management 206
approaches is a fundamental step in LCA and can lead to completely different results [22]. Several co-207
products can be generated in the system during three steps: i) oil extraction, ii) transesterification and 208
iii) photovoltaic shading. The oil extraction process produces high value lipids (algal oil) and residual 209
dry biomass (oilcake). Transesterification yields glycerine as a co-product while photovoltaic panels 210
obviously produce electricity. 211
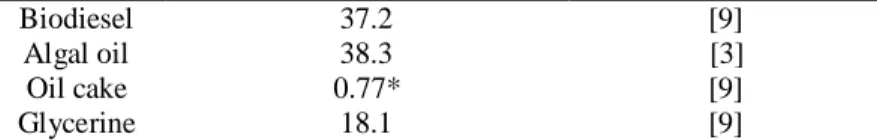
The impacts of co-products are based on an allocation approach according to their energy content 212
[23], which is measured by their lower heating values (LHV). The co-products include surplus 213
electricity, extraction residue (oilcake) and glycerine. Oilcake and glycerine have an energetic content 214
(Table 1) and can be valorised as a source of energy, animal feed for oilcake and as heat source for 215
glycerine [9]. Crude oil and oil cake differ in their carbon and energetic content, similarly to 216
glycerine and biodiesel. 217
Table 1. Lower heating value (LHV) for co-products
218
Biodiesel 37.2 [9]
Algal oil 38.3 [3]
Oil cake 0.77* [9]
Glycerine 18.1 [9]
* Composed by 95% water, 5% biomass (content around 70% carbohydrates and 30% protein), LHV based in composition.
219 220
A three-stage allocation scheme is carried out: First the impacts on electricity production, from a 221
photovoltaic system (Subsystem-5) to electricity injected into the facility and exported electricity 222
(surplus electricity). Secondly, the impacts incurred due to the production of oilcake and algae oil in 223
the oil extraction subsystem (Subsystem-3) and thirdly the apportioned impacts of glycerine 224
production in the oil conversion subsystem (subsystem-4). Table 2 presents the average annual 225
allocations for different photovoltaic coverture ratios and consumption/production of electricity (see 226
seasonal variations in the Additional file 8). 227
228
Table 2. Allocation factors used for biodiesel and co-products
229
Percentage of coverture of photovoltaic panels
0% 10% 20% 30% 40% 50% 60% 70% 80% 90% Allocation S5 Electricity from PV panels into facility 0% 84% 55% 36% 26% 20% 17% 14% 11% 9% Electricity exported (surplus) 0% 16% 45% 64% 74% 80% 83% 86% 89% 91%
Allocation S3 Algal oil 65% 65% 64% 64% 64% 63% 63% 63% 63% 63%
Oilcake 35% 35% 36% 36% 36% 37% 37% 37% 37% 37%
Allocation S4 Biodiesel 91% 91% 91% 91% 91% 91% 91% 91% 91% 91%
Glycerine 9% 9% 9% 9% 9% 9% 9% 9% 9% 9%
230
Substitution is also proposed as an alternative allocation method. Produced oilcake can be employed 231
as animal feed in the same manner as soymeal can be used as a co-product from biodiesel. The protein 232
content of soymeal is 48% [24], while it is around 30% in oilcake. Thus, 1 kg oilcake from algae 233
replaces 0.6 kg of soybean for animal feed. The credits for not having to produce 0.6 kg soymeal for 234
every kg algae oilcake produced are subtracted from the total upstream processes and emissions 235
associated with the algal biodiesel production. Algal oilcake co-product replaces the soymeal 236
production from a soybean crude oil production plant located in United States. Glycerine and surplus 237
electricity co-products are respectively assumed to replace petroleum glycerine from an 238
epichlorohydrine European plant and electricity production from a European mix, respectively. 239
240
Microalgae specification 241
The analysis considers Chlorococcum sp. and Desmodesmus sp, since both species can achieve 242
efficient trade-off between growth rate, lipid accumulation and ease of cultivation [25, 26]. Data are 243
not consistent enough in the literature to accurately describe the variations in lipid profiles due to 244
seasonal light and temperature variations. As a consequence, a constant TAG rate for each species is 245
assumed according to nitrogen starvation conditions [27]. Additional file 1 provides general 246
information on the biomass as well as compositional details. The analysis considers a 47% and 53.8% 247
lipid content (of dry basis content biomass), for Chlorococcum sp. and Desmodesmus sp., 248 respectively. 249 250 Cultivation 251
Microalgae cultivation in a module consists of 5 raceways of 8348 m2 (2504.5 m3 total volume)mixed
252
with a paddlewheel (more information in Additional file 2.2). The 5 raceways are grouped into 1 253
greenhouse; each greenhouse contains feed and harvest pipes between individual raceways and 254
common headers, with the harvest lines drawn off raceways controlled by slide gates and valves and 255
delivered to primary de-watering (in –ground gravity settlers). Paddlewheel mixing is considered in 256
each raceway, which may be viewed as a standard basis for commercial scale facilities [28] (more 257
information in Additional file 2.3). The inoculum generally represents around 10% of the operating 258
volume of the raceway. The inoculum grows in the same medium as the production raceway (see 259
more information in Additional file 2.4). It is produced after an exponential phase prior to 260
inoculation, within a small-sized raceway [29]. 261
The process begins with algal biomass growth and harvesting from the raceways. Biomass is 262
harvested at a seasonally variable culture density for processing through primary settling. The 263
plumbing is a critical factor as it covers a large land footprint. Each pipeline is equipped with a valve 264
for opening or closing the circulation of water, nutrients and/or inoculum in each raceway and 265
inoculum pond. The piping and pumping systems involve five independent pipelines, detailed in the 266
Additional file 3.1. 267
The residence time is 10 days, harvesting is performed once a day for each raceway, representing 10% 268
of the total volume (volume extracted by raceway is 218.4 m3·d-1) [1]. The raceway is fed with fresh
medium at a specified flow rate. The feed point is typically located just before the paddlewheel. 270
During feeding, the algal culture is either withdrawn or harvested from the raceway at a rate equal to 271
the feed flow rate. Feeding and harvesting only occur during daylight and stop at night; otherwise the 272
biomass could flush out the raceway overnight. 273
CO2 is supplied from a nearby fossil fuel power plant by direct injection of flue gas. Distribution is
274
ensured thanks to a blower system, under moderate pressure using sufficiently thick HDPE pipes. 275
Carbon requirements depend on biomass growth rate and concentration. The efficiency of the 276
microalgae inorganic carbon uptake was assumed to be 75% [30], while, the percentage of C in the 277
biomass can vary according to the microalgae species (see Additional file 6.2). 278
In addition to carbon dioxide, algal growth requires nitrogen (N) and phosphorous (P) as principal 279
nutrients [31]. Nutrient requirements for the inoculum ponds and raceways are assumed to be met 280
using diammonium phosphate (DAP, 18% N, 20.2% P) for phosphorous requirements, and 281
ammonium nitrate (NH4NO3, 35%N) for nitrogen requirements at 20% w/w each. Percentages of N
282
and P in biomass vary depending on the species of microalgae. In the case of N, a fraction of the 283
element is also provided by DAP. 284
The fertilizer requirements in the inoculum ponds and raceways were calculated according to the 285
species. For Chlorococcum sp. the nitrogen and phosphorous fertilizers are 0.0093 kg NH4NO3/kg
286
algae biomass DW (0.026 kg N/kg algae biomass dry weight) and 0.0030 kg DAP/kg algae biomass 287
DW (0.0053 kg P/ kg algae biomass dry weight). For Desmodesmus sp. 0.0066 kg NH4NO3/kg algae
288
biomass DW (0.018 kg N/kg algae biomass dry weight) was assumed and 0.0022 kg DAP/kg algae 289
biomass DW (0.0038 kg P/ kg algae biomass dry weight). These values (0.026 and 0.018 kg N/kg 290
algae biomass dry weight), for Chlorococcum sp. and Desmodesmus sp., respectively are similar to 291
those reported by Collet, Lardon [9] for biodiesel production using Nannochloropsis occulata at 292
nitrogen starvation (0.04 kg N/kg algae biomass dry weight). The areal fertilizer requirements in the 293
raceways fluctuate according to the biomass productivity, and thus to the season (detailed in 294
Additional file 6.1). 295
Whatever the location, the freshwater supply is insufficient to support any substantial scale production 296
of algal fuels anywhere. The supply in brackish water is also relatively limited. Therefore, the use of 297
seawater and marine algae would be a convenient option for producing algal fuels. Unfortunately, the 298
use of seawater for algae culture, does not totally eliminate the need for freshwater. Freshwater is still 299
necessary for compensating evaporative losses and the consequent increase in culture salinity. 300
Evaporative loss depends on the local climatic conditions, particularly on the irradiance levels, air 301
temperature, wind velocity and absolute humidity [8]. Water is transported to the facility by pipeline 302
from a nearby local marine water resource, while freshwater is originates outside of the facility 303
boundaries. The transport of water used in the facility has been ignored in the study. Seawater is used 304
in the cultivation and inoculum ponds, while freshwater is used for fertilizer dilution and for 305
compensating water losses (mainly via pond evaporation). The blowdown volume was assumed to be 306
equal to the water requirement. For inoculum ponds, there is no blowdown; however dilution water in 307
the fertilizer varies according to biomass productivity, while the evaporation volume is seasonally 308
variable (see Additional file 6.1). 309
310
Pond emissions 311
The volatile compounds emitted by raceways and inoculum ponds are CO2, N2O and NH3. These
312
emissions highly depend on operating conditions, such as dissolved oxygen concentration, pH, mixing 313
rate, gas transfer coefficient, nitrate concentrations, etc. [9]. Further experimental data are required to 314
provide reliable emission factors. Nevertheless, due to lack of information, an average loss emission 315
for each compound was inferred. These are correlated with other LCA studies [9]. 316
The efficiency of the CO2 injection system is low in raceways, resulting in re-emission of a large
317
fraction of flue gas. A 25% emission of injected CO2 was considered (250 g CO2 kg-1 CO2 injected).
318
Nitrogen emissions (N2O and NH3) to the environment have been scarcely taken into account in the
319
literature, even though these emissions present harmful effects (causing, amongst others, acidification, 320
eutrophication and global warming). Indeed, N2O is a greenhouse gas with a much higher GWP
321
(Global Warming Potential) than CO2 (298 kg CO2eq·kg-1 at a temporal horizon of 100 years).
322
Especially during nighttime anoxic conditions, microalgae cultures have proved to generate both 323
direct and indirect N2O emissions. Direct N2O emissions are related to the denitrification process,
324
which reduces nitrate (NO3-) to nitrogen gas through a multistep process, with N2O as an intermediate
product [32]. Complete denitrification involves the production and consumption of N2O which can be
326
partially released into the atmosphere. N2O emissions represent 0.003% of the nitrogen fertilizer
327
applied to a fully oxic culture (raceway case) and 0.4% for a microalgae culture that is anoxic during 328
dark periods (photobioreactor case) [32]. In the present study a 0.003% emission (0.0298 g N2O·kg-1
329
N) was considered. 330
Indirect N2O emissions are the long-term fate of nitrogen fertilizers [33]. Indeed, by providing
331
substrate for microbial nitrification and denitrification after application in the soil, fertilizers indirectly 332
generate N2O which then volatilizes [33]. In the present study, an emission of 1.6 g N2O·kg-1 N [33]
333
and 120 g NH3·kg-1 N was considered [9].
334 335
Algae harvesting 336
Harvesting refers to the removal of algal biomass from the pond, as well as, occasionally, to the 337
primary concentration step. Dewatering is a secondary concentration step [28]. As algal biomass 338
dewatering technologies are still under investigation and development, the best strategy is still 339
difficult to assess. The present model is based on the technology analysed by NREL [28], offering an 340
advantageous trade-off between dewatering performance (power demand, retention efficiency, etc.) 341
and cost (capital and operating costs). Furthermore, this process avoids the addition of chemicals (i.e. 342
flocculants or metal ions), thus maintaining biomass purity for downstream flexibility. 343
Biomass is harvested from the ponds and concentrated through three dewatering steps comprising 344
gravity settlers, membranes and centrifugation to a final concentration of 200 g·L-1. Clarified water
345
from each step is recycled towards the cultivation raceways, excluding a small fraction that is 346
removed as blowdown to mitigate the build-up of salts and other inorganics. 347
The dewatering process begins with the primary settling ponds, for which energy demand is low since 348
only pumps are required. The settler trenches have a trapezoidal profile with a volume of 364.1 m3 (50
349
m in length, 1.7 m deep, 8.5 m wide at the top and 0.34 m wide in the bottom). There are a total of 22 350
settler ponds with a 4 h residence time. The biomass is removed from these trenches by positive 351
displacement pumps (assuming a negligible energy demand). The material harvested from gravity 352
settling is transferred to membranes, while clarified effluent is redirected back towards the raceways 353
through feed pipes, along with additional recycled water from membranes and centrifuges through 3-354
inch diameter DI pipelines. The settler ponds concentrate the algal biomass from 0.5 to 10 kg·m-3,
355
with 90% efficiency (i.e. 10% of the biomass returns to the ponds in the clarified water stream) and 356
reduce the volume of water by a factor of 20. 357
The second dewatering process uses hollow fibre membranes. This technology was selected for its 358
favourable performance and costs at a commercial scales, such as high reliability, direct scalability 359
and simple thermal, mechanical and chemical management [28]. Maintenance and fouling are not 360
problematic or costly, based on a daily cleaning protocol for the membrane modules. The hollow fibre 361
membrane units received biomass at 10 kg·m-3 from the settling ponds and concentrate the biomass to
362
130 kg·m-3, with an efficiency of biomass retention close to 100% (assumed here at 99.5%).
363
Centrifugation takes place after the hollow fibre membranes, during the final dewatering step. It leads 364
to a high biomass concentration [28]. The centrifuge concentrates biomass between 130 kg/m3 and
365
200 kg/m3, with a dewatering efficiency of 97% (3% of biomass is removed with the clarified water).
366
The 99.8% of the total water inlet in the subsystem is dewatered during all three steps. Table 3 367
summarizes the parameters of the selected technologies. 368
369
Table 3. Various parameters considered for study.
370
Unit process Assumptions Ref.
Algae cultivation Algae growth
Algae strains: Chlorococcum sp. and Desmodesmus F2 sp: 47% and 53.8% lipid content for Chlorococcum sp. and Desmodesmus sp.
Velocity culture: 0.3 m·s-1 for raceways and 0.25 m·s-1 for inoculum ponds.
HRT: 10 days. Raceways: 110 units of 310 m long x 30 m weight x
0.3 m height (2,184.3 m3 volume medium). Inoculum ponds: 40 units of raceways of 160 m long x 15 m weight x 0.35 m height (656 m3 volume medium).
Facility: 145 ha area. Operating time facility: 330 days ·year-1 (90%).
Paddlewheels: 0.11 W/m2, time functioning: 12 h·d-1. One unit per raceways and inoculum pond.
Blower system: 22.2 Wh·kg-1 CO2, time functioning: 12 h·d-1. One unit per raceways and inoculum pond. 14% v/v CO2 concentration in flue gas.
Water loss (evaporation): daily variable (ranging between 0.01 and
0.34 cm·d-1).
Inoculum input Pumping system: Power: 10 kW, 22 units, time
functioning: 0.8 h h·d-1 . Electricity consumption: around 0.07 kWh·m-3
Nutrients/water loss pumping system: 24 units (22 for raceways and
2 for inoculum ponds), time functioning: 12 h·d-1 . Electricity consumption: negligible.
[26]; [25]; [34]; [35]; [36]
Algae
Harvesting
(De-Settlers ponds: 22 units, Energy demand: negligible, Efficiency: 90%,
Outlet concentration: 10 g/L. Capacity: 364.1 m3. Residence time: 4
watering) hours.
Membranes: 22 units, Power: 2 kW, Energy demand (variable): 0.03
to 0.2 kWh·m-3, Efficiency: 99.5%, Outlet concentration: 130 g/L. Capacity: 2.3 m3·h-1, Time functioning: 12 h·d-1.
Centrifuges: 22 units, Power: 6 kW, Energy demand (variable): 0.9 to
5.05 kWh·m-3, Efficiency: 97%, Outlet concentration: 200 g/L. Time functioning: 12 h·d-1.
Overall harvesting process: 20% wt outlet concentration. Efficiency:
86.9%. Percentage of water volume reduced: 99.9%.
Harvesting Pumping system: 22 units, Power: 7.7 kW, Energy
demand: 0.08 kWh·m-3, time functioning: 12 h/day.
Recirculation pumping system: 22 units, Power: 7.7 kW, Energy
demand: 0.08 kWh·m-3, time functioning: 12 h/day.
Oil extraction Sonication: 2 units, Power: 16 kW, Energy demand: 0.013 kWh·kg-1 algae-DW, Capacity: 12 m3·h-1, Time functioning (variable): 1.5 to 8.8 h/day.
Static mixer: 1 unit, Power: 6 kW, Energy demand: negligible,
Efficiency lipid extraction: 90%, Capacity: 12 m3·h-1, time functioning: 1.5 to 8.8 h/day. Hexane input: 10:1 mass ratio, 0.05% hexane losses.
Biomass solvent separator: 1 unit, Power: 6 kW, Energy demand:
0.005 kWh·kg-1 algae-DW, Efficiency: 99.9%. Capacity: 5.7 m3·h-1 time functioning (variable): 3 to 19 h/day.
Distillation column: 2 units, Energy demand (variable): 0.09 to 0.55
kWh·kg-1 oil, Capacity: 15.2 m3·h-1 time functioning (variable): 2.7 to 16 h/day.
[30]
Oil conversion Transesterification reactor: 1 unit, Power: 15 kW, Energy demand:
0.03 kWh·kg-1biodiesel, Time functioning (variable): 2.7 to 16 h/day. Chemical consumption: methanol 1.1 kg·kg-1 biodiesel, Sodium methoxide 0.11 kg·kg-1 biodiesel, HCl 0.014 kg·kg-1 biodiesel, NaOH 0.008 kg·kg-1 biodiesel, Natural gas 0.063 L·kg-1 biodiesel.
[37]
371
Algae transformation 372
The extraction step involves addition of hexane that dissolves the oil and strips it from the algae. The 373
solvent recovery phase recovers the hexane from the oil. The current model is based on the oil 374
extraction processes documented by Rogers, Rosemberg [30] for a biodiesel plant production at 375
commercial scale. Yield extraction, hexane volume and associated heat and electricity consumptions 376
have been adapted to match the data of this analysis. A 16 kW sonicator was used for cell disruption, 377
processing up to 12 m3/h. The lipid extraction was then performed on the 20% wt slurry in a static
378
mixer. The static mixer combines the solvent and algal biomass during lipid extraction. A solvent to 379
algae-DW mass ratio of 10:1 was assumed, with an 80% extraction efficiency and without any 380
electricity requirement. A daily solvent loss of 0.005% was assumed. In order to separate the oil cake 381
(biomass + water) from the hexane-oil mix, the current model uses a biomass-solvent separator. This 382
separator operates at 6 kW, processing 5.7 m3·h-1. In order to recover the solvent, a distillation column
383
with a maximal capacity of 15.2 m3·h-1 was used. The recovered hexane is re-circulated towards the
static mixer and is mixed with the new hexane flux to compensate for hexane emission losses, while 385
the oil continues onwards to the next transesterification subsystem. 386
Algal oil with higher phospholipid contents are less suitable for biofuel, since phosphorous reduces 387
the efficiency of the alkaline catalysts used in the transesterification process [37]. Phospholipids are of 388
primary concern within the polar lipid fraction for their propensity to form gums and deactivate 389
catalysts. For this reason, it is prudent to include a lipid clean up step to remove these impurities. The 390
following two assumptions were made for the oil obtained from the distillation column: the 391
phospholipid and free fatty acid contents are negligible in the algal oil [37], and the oil contains 392
traces of water and hexane [38]. 393
Transesterification is assumed for the conversion of algal oil into biodiesel. The current model is 394
inspired from the process proposed by Haas, McAloon [37], for a production of 37854.1 m3
395
biodiesel·y-1 (52158.8 ton·y-1). This design was based on the use of crude, degummed soybean oil
396
with negligible phospholipid and free fatty acid content as feedstock. The process involves three 397
processing sections: i) transesterification unit where the vegetable oil is subjected to chemical 398
transesterification to produce fatty acid methyl esters (biodiesel) and co-product glycerol, ii) a 399
biodiesel purification section where the methyl esters were refined to meet biodiesel specifications 400
and iii) a glycerol recovery section. The final product obtained is biodiesel with a lower than 0.005% 401 (v/v) water content. 402 403 Combustion emissions 404
The emissions associated with combustion are assumed to be equivalent to rapeseed-based biodiesel 405
emissions. The emission factors refer to a EURO-3 middle-sized vehicle. They are extracted from the 406
Ecoinvent database [39], assuming a fuel consumption of 0.42 km per MJ of biodiesel. Conventional 407
diesel engines are considered to have the same consumption (see combustion emissions factors in 408 Additional file 9). 409 410 Photovoltaic system 411
The core of a photovoltaic system is the solar cells converting light energy into electricity. Electricity 412
then generates an electromotive force when the radiation reaches a semiconductor plate presenting a 413
potential gap [40]. Copper indium gallium diselenide (Cu(In,Ga)Se2, CIGS) is a mixed alloy of copper
414
indium diselenide (CuInSe2,CIS) and copper gallium diselenide (CuGaSe2,CGS) semiconductors [41].
415
In comparison to traditional silicon-based technologies, CIGS is appealing because of its competitive 416
cell efficiency and performance in diverse environments [42]. Furthermore, although current 417
efficiencies for CIGS cells average 14%, technological advancements presently contribute to the 418
improvement of cell efficiencies with records up to 23% [42], potentially rendering CIGS increasingly 419
competitive compared with current silicone-based cells. This study considers a conservative 420
efficiency of 15% and a 30-year lifespan for 1 m2 area module. The PV production inventory
421
considers mass and energy flows over the whole production process starting from material extraction 422
to the final panel assemblage, use and end of life. The CIGS technology data from Wurth Solar 423
(Germany) was used [43]. Different layers of CIGS thin film cells are necessary. The required 424
sequence layers are deposited in a number of subsequent production steps. The active layer consists of 425
a specific copper-indium-selenium configuration deposited by a vaporization process directly over a 426
large area of window glass (substrate material). It is usually airtight sealed with a second glass plate. 427
The modules have a size of 1.2 m by 0.6 m and a weight of 12.6 kg [43]. In Additional file 16, the 428
monthly electricity production is plotted as a function of the percentage coverture of photovoltaic. 429
These data have been obtained from the Sophia Antipolis meteorological database (France). 430
431
Energy assessment 432
A cradle-to-gate life cycle energy analysis was performed, including the production of raw materials 433
and the production process of biodiesel. The Fossil Energy Ratio (FER) and Net Energy Ratio (NER) 434
were estimated according to the input and output energy for 1 MJ of biodiesel. There are no 435
allocations in energy balance. FER is defined as: 436 437 𝐹𝐸𝑅 =𝑅𝑒𝑛𝑒𝑤𝑎𝑏𝑙𝑒 𝑒𝑛𝑒𝑟𝑔𝑦 𝑜𝑢𝑡𝑝𝑢𝑡 𝑓𝑜𝑠𝑠𝑖𝑙 𝑒𝑛𝑒𝑟𝑔𝑦 𝑖𝑛𝑝𝑢𝑡 = 𝐿𝐻𝑉 𝐶𝐸𝐷 438
439
The FER only included fossil (non-renewable) energy in the denominator. NER includes total energy 440
input in the denominator, including renewable sources of energy, such as wind and solar. NER, rather 441
than FER, is used as an indicator of energy efficiency [44]. 442
LHV (low heating value) is the life cycle energy output (MJ), determined using the following 443 equation: 444 445 𝐿𝐻𝑉 = 𝐸𝑃𝑏𝑖𝑜𝑑𝑖𝑒𝑠𝑒𝑙 + 𝐸𝑃𝑜𝑖𝑙𝑐𝑎𝑘𝑒+ 𝐸𝑃𝑔𝑙𝑦𝑐𝑒𝑟𝑖𝑛+ 𝐸𝑃𝑠𝑢𝑟𝑝𝑙𝑢𝑠 𝑒𝑙𝑒𝑐𝑡𝑟𝑖𝑐𝑖𝑡𝑦 446 447
EP represents the Energy for each co-product (MJ), each being defined as: 448 449 𝐸𝑃𝑏𝑖𝑜𝑑𝑖𝑒𝑠𝑒𝑙 = 1 (Functional unit) 450 451 𝐸𝑃𝑔𝑙𝑦𝑐𝑒𝑟𝑖𝑛𝑒 = 𝑀𝑎𝑠𝑠 𝑔𝑙𝑦𝑐𝑒𝑟𝑖𝑛𝑒 ( 𝑘𝑔 𝑀𝐽 𝑏𝑖𝑜𝑑𝑖𝑒𝑠𝑒𝑙) ∙ 𝐿𝐻𝑉𝑔𝑙𝑦𝑐𝑒𝑟𝑖𝑛𝑒( 𝑀𝐽 𝑘𝑔) 452 453 𝐸𝑃𝑜𝑖𝑙𝑐𝑎𝑘𝑒= ∑ 𝑃𝑜𝑖𝑙𝑐𝑎𝑘𝑒,𝑛∙ 𝐿𝐻𝑉𝑛 𝑖 454 455 𝐸𝑃𝑠𝑢𝑟𝑝𝑙𝑢𝑠 𝑒𝑙𝑒𝑐𝑡𝑟𝑖𝑐𝑖𝑡𝑦 = 𝑠𝑢𝑟𝑝𝑙𝑢𝑠 𝑒𝑙𝑒𝑐𝑟𝑡𝑖𝑐𝑖𝑡𝑦 (𝑒𝑥𝑝𝑜𝑟𝑡𝑒𝑑) 𝑓𝑟𝑜𝑚 𝑝ℎ𝑜𝑡𝑜𝑣𝑜𝑙𝑡𝑎𝑖𝑐 𝑝𝑎𝑛𝑒𝑙𝑠 (MJ) 456 457
Where, 𝑃𝑜𝑖𝑙𝑐𝑎𝑘𝑒,𝑛 is the percentage of component n in the oilcake (%, e.g. carbohydrates, lipids,
458
proteins, etc.) and 𝐿𝐻𝑉𝑛 is the lower heating value of component n (MJ/kg).
459
Cumulative energy demand (CED) represents the life cycle total energy consumption (in MJ), which 460
is represented by the following equation: 461 462 𝐶𝐸𝐷 = ∑ ∑ 𝐸𝐸𝑖,𝑗 ∙ 𝑗 𝑖 𝑃𝐸𝑗+ ∑ ∑ 𝑀𝑖,𝑛 ∙ 𝑃𝐸𝑛 𝑛 𝑖 463 464
Where, 𝐸𝐸𝑖,𝑗 is the jth process energy consumption during stage i (MJ), 𝑃𝐸𝑗 is the total energy use for
465
process j production (MJ/MJ) (renewable and non-renewable for NER and non-renewable for FER) 466
𝑀𝑖,𝑛 is the nth material consumption during stage i (kg). 𝑃𝐸𝑛 is the life cycle total (renewable and
467
non-renewable for NER and non-renewable for FER) energy use for material n production 468
(kg/MJ).Values of CED for material and energy used in the various processes are obtained from the 469
CED method v1.09 (see Additional file 7). 470
471
Environmental assessment 472
The standard framework of Life Cycle Assessment (LCA) described by ISO 14040:2006 was selected 473
to assess the ecological burdens and energy balance. An attributional LCA is used in the analysis, 474
which considers only physical relationships between each process, different to a consequential LCA 475
where economic relations are also assessed [9]. LCA software SimaPro v8.3 [18] was used for 476
modelling the data, by using the characterization factors from the midpoint (H) ReCiPe 2008 method 477
v1.3 [44]. Full LCI data source are available as supplemental information (Additional file 7) [45]. 478
The impact categories considered were: Climate Change (CC), Ozone Depletion (OD), Human 479
Toxicity (HT), Photochemical Oxidation formation (POF), Particulate matter formation (PMF), 480
Terrestrial Acidification (TA), Freshwater Eutrophication (FE), Marine Eutrophication (ME), 481
Terrestrial Ecotoxicity (TET), Freshwater Ecotoxicity (FET), Marine Ecotoxicity (MET), Ionising 482
radiation (IR), Natural land transformation (NLT), Urban Land Occupation (Urban LO), Agricultural 483
Land Occupation (Agri LO), Water Depletion (WD), Metal depletion (MD) and Fossil Depletion 484
(FD). The endpoint (H) ReCiPe 2008 method is also used to assess the system at a more aggregated 485
level through the three areas of protection (AoP): Human Health, Ecosystems and Resources. 486
487
Mathematical model for predicting monthly productivities 488
The model predicting temperature in the raceway ponds was based on the heat balance presented by 489
Béchet, Shilton [46], which was initially developed for an open raceway pond and validated at a large 490
scale [49]. In the Béchet model, a total of eight heat fluxes were considered: 491
- Solar radiation; 492
- Long-wave air radiation; 493
- Long-wave pond radiation; Convection with the air flowing at the pond top surface; 494
- Evaporation from the pond surface; 495
- Conduction with the soil beneath the pond; 496
- Heat flux associated with the water inflow; and 497
- Heat flux associated with rain. 498
The model developed by Béchet, Shilton [46], still needed to be significantly modified as the presence 499
of the greenhouse significantly impacts the expression of most of these heat fluxes: 500
- Solar and air radiation are partly shaded by the greenhouse; 501
- Pond radiation is partly reflected back towards the pond by the greenhouse. 502
- Convection and evaporation are "natural" in a greenhouse as there is no wind to force these 503
transfer mechanisms; 504
- Rain heat flux is obviously inexistent in a closed greenhouse; 505
- Conduction and inflow heat fluxes were, however, expressed similarly to the case of an open 506
pond. 507
The greenhouse is assumed to be of rectangular shape and condensation on the greenhouse walls was 508
neglected. All opaque surfaces were considered as diffuse grey, except for the greenhouse walls that 509
were considered as partly transparent. For the reflected radiative heat fluxes, only single reflection 510
was accounted for. Finally, the temperature and relative humidity in the greenhouse are considered 511
homogenous. 512
The air temperatures inside and outside the greenhouse are different. As the air temper ature above the 513
pond impacts both evaporation and convection at the pond surface, the air temperature inside the 514
greenhouse needs to be assessed in parallel to the pond temperature. A heat balance on the air in the 515
greenhouse was therefore computed to determine the air temperature at each time step of the 516
simulation. The greenhouse walls emit inward long-wave radiation, a fraction of each being absorbed 517
by the pond. The temperature of the greenhouse walls was therefore evaluated at each simulation time 518
step through a heat balance on the greenhouse walls. 519
This heat balance is relatively complex due to the high number of radiative interactions between the 520
greenhouse and its surrounding environment. Indeed, the pond, the ground inside the greenhouse and 521
the ground outside the greenhouse emit long-wave radiations that are partly absorbed by the 522
greenhouse. The long-wave radiation emitted by a grey body depends on its temperature and as a 523
result, the temperatures of the inside and outside ground surfaces were determined simultaneously 524
through two additional heat balances. It is not straightforward to determine the ground surface 525
temperature as it depends on the conductive properties of the soil. Indeed, ground surface temperature 526
decreases when the ability of the soil to conduct heat in deeper ground layers increases. This 527
conductive heat flux is a function of the soil thermal properties but also of the temperature gradient 528
within the soil. Therefore, to determine the internal and external ground surface temperatures, the 529
temperature profiles in the soil first need to be assessed. In summary, to determine the pond 530
temperature in the greenhouse, a total of five different heat balances were solved simultaneously 531
during the simulations. 532
533
Results and discussion
534 535
Dynamic seasonal growth modeling is an important step that critically impacts results. Monthly 536
variations in the life cycle inventory depend on the monthly biomass productivity, which in turn 537
affects lipid and biodiesel productivity. Large differences in assumptions on the productivity potential 538
have directly contributed to the large variance in LCA results from various studies [47]. The high lipid 539
yields reported in literature are typically the result of speculation for future productivity potentials 540
based on the linear scaling of laboratory data [47]. This highlights the importance in developing 541
realistic dynamic productivity models based on experimentally validated biological models integrated 542
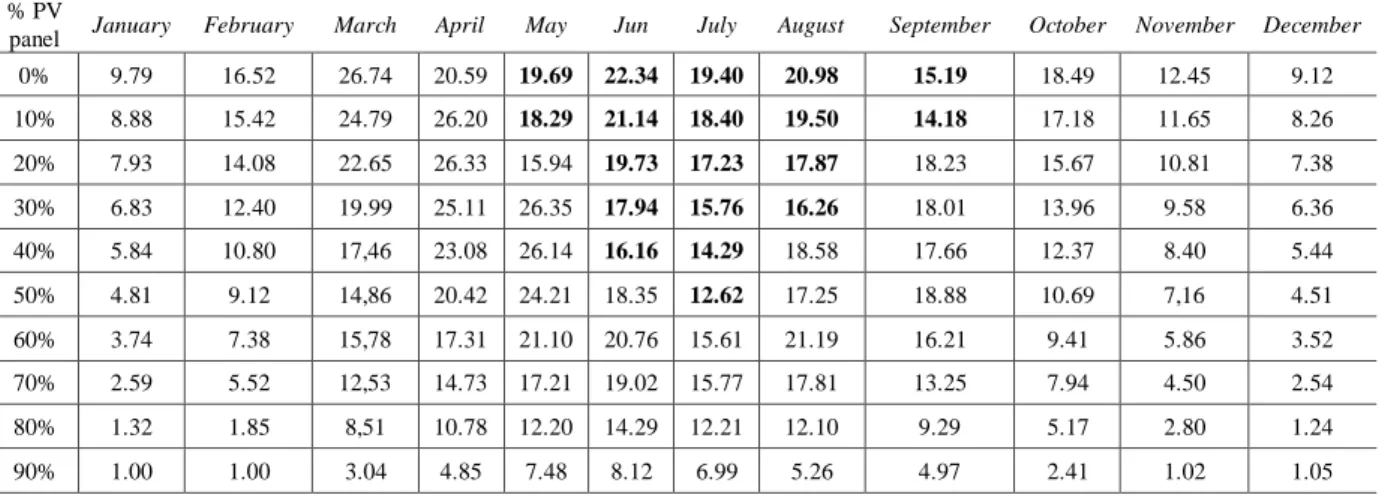
with local and seasonal meteorological data [48]. Table 4 shows the evolution of the microalgae 543
biomass productivity, respectively, for each species, obtained from the mathematical model based on 544
Mediterranean conditions (Sophia Antipolis, France). According to simulation results, Chlorococcum 545
sp. was chosen for the cold months and Desmodesmus sp. for the warm months, depending on the
coverture fraction of photovoltaic panels. When the coverture is greater than 60%, only 547
Chlorococcum sp. was chosen because Desmodesmus sp. had a very low productivity at low light (< 1
548
g·m-2·d-1). 549
Ten conditions are detailed in this interpretation: absence of photovoltaic panel (0% coverture), and 550
greenhouse roof coverage from 10% to 90%. 100% coverture was not considered since it would 551
hinder any biological productivity. 552
553
Table 4. Monthly biomass productivity (g·m-2·d-1). Chlorococcum and Desmodesmus sp. (bold text). 554
% PV
panel January February March April May Jun July August September October November December
0% 9.79 16.52 26.74 20.59 19.69 22.34 19.40 20.98 15.19 18.49 12.45 9.12 10% 8.88 15.42 24.79 26.20 18.29 21.14 18.40 19.50 14.18 17.18 11.65 8.26 20% 7.93 14.08 22.65 26.33 15.94 19.73 17.23 17.87 18.23 15.67 10.81 7.38 30% 6.83 12.40 19.99 25.11 26.35 17.94 15.76 16.26 18.01 13.96 9.58 6.36 40% 5.84 10.80 17,46 23.08 26.14 16.16 14.29 18.58 17.66 12.37 8.40 5.44 50% 4.81 9.12 14,86 20.42 24.21 18.35 12.62 17.25 18.88 10.69 7,16 4.51 60% 3.74 7.38 15,78 17.31 21.10 20.76 15.61 21.19 16.21 9.41 5.86 3.52 70% 2.59 5.52 12,53 14.73 17.21 19.02 15.77 17.81 13.25 7.94 4.50 2.54 80% 1.32 1.85 8,51 10.78 12.20 14.29 12.21 12.10 9.29 5.17 2.80 1.24 90% 1.00 1.00 3.04 4.85 7.48 8.12 6.99 5.26 4.97 2.41 1.02 1.05 555 Energy flows 556
The use of energy for each step of the process was derived from algal productivity, dewatering, oil 557
extraction and transesterification (see Table 3). Figure 2 illustrates the energy requirements in the 558
different case studies. The main energy requirement is issued from water pumps used for harvesting 559
and recirculating flows from de-watering processes, followed by paddlewheel engines (more details in 560
Additional file 2.3, 3.2, 4.2 and 4.3). The biomass productivity decreases when the coverture fraction 561
of photovoltaic panels increases at a variation rate below 5% and between 0% and 30% photovoltaic 562
coverture; however, at 70% photovoltaic coverture this variation rate increases to more than 15% 563
(reaching almost 50% less biomass productivity at 90% with a 80% photovoltaic coverture). 564
565
Figure 2 around here 566
The NER and FER results are depicted in Additional file 17. Allocation issues do not affect this 568
evaluation, i.e. all production processes are considered as a whole. The total set of products represents 569
an amount of energy (in terms of LHV) ranging from 1.70 MJLHV without PV up to 9.82 MJLHV with
570
90% photovoltaic coverture. The total energy investment, CED (renewable + non-renewable energy), 571
ranges from 0.90 (without PV) up to 9.93 for 90% PV. This implies a favourable NER over the whole 572
year, i.e. even in the absence of photovoltaic panels: 1.99 and FER: 2.92. Without PV panels, the 573
electricity should be supplied by the European electricity matrix. In comparison with other similar 574
LCA studies on algal biodiesel, the NER for biodiesel from microalgae using fossil fuel electricity 575
sources are usually slightly greater than 1 [3, 49, 50], although some cases can be lesser than 1, as 576
reported by Lardon, Hélias [3] and Yang, Xiang [51]. 577
With photovoltaic panels, the highest NER (larger than 5.0) are obtained during the hottest months 578
(April to September) (see Additional file 10). Indeed, during the summer period, the electricity 579
production is higher (large electricity production in comparison to the facility requirements). 580
However, despite optimal energetic performance resulting from the use of photovoltaic panels, the 581
relevance of renewable biofuels rather becomes a matter of producing storable and renewable energy. 582
The production of biodiesel from microalgae is an efficient way to store a fraction of renewable 583
energy. The optimal percentage of photovoltaic panels depends on the month: i.e. during the cold 584
months (October to March), the optimal coverture is 10%, while for hot months (April to September) 585
the optimum is 20% coverture. 586
Comparison of NER and FER between the case studies, first generation biodiesel and conventional 587
diesel, is illustrated in Figure 3. The reference cases are obtained from the Ecoinvent database for 588
biodiesel [39] and conventional fossil diesel [52], complying with similar limits for the system and for 589
the allocation of this study. The biodiesel reference scenarios are soybean diesel (US), palm tree 590
diesel (Malaysia) and rapeseed diesel (European average) (more details about comparative cases can 591
be found in Additional file 15). A 10% and 20% coverture fraction of photovoltaic panels are the 592
most optimal configurations that obtain highest FER and NER, respectively. The presence of 10% and 593
20% photovoltaic panel favors a higher NER than for first generation and fossil diesel. However, FER 594
presents better results in the cases of soybean and palm tree biodiesel, despite the use of photovoltaic 595
panels to improve the energy balance. 596
597
Figure 3 around here 598
599
Environmental impacts 600
First generation biodiesels and fossil diesel are compared in Additional file 18, which illustrates the 601
endpoint characterization results for the combustion of 1 MJ of biodiesel in a medium-sized car for 602
various fractions of photovoltaic panel coverture. The lowest impact is obtained for a 50% coverture, 603
with equivalent performances from 30% to 60%. The main subsystem contributors are the culture, 604
followed by the photovoltaic subsystem, in the case of human health and resources, or combustion in 605
the case of ecosystem category. Biodiesel from microalgae has the following characteristics: 606
- Algal biofuel leads to significant reductions in the Human Health and Ecosystem categories 607
compared to other biodiesels, but is still higher than conventional diesel. 608
- Significant reductions in the Resources impact category are obtained relative to conventional 609
diesel; however, the impact is higher than for soybean diesel and palm tree diesel. 610
Additional file 19 presents the contribution of each process to climate change, accounting for 611
production of electricity using PV panels. Results for midpoint categories are detailed in the 612
Additional file 12. The data in Table 5 make it possible to compare the impact results of algae 613
biodiesel to those obtained by fossil diesel and first generation biodiesels. These overall results on 614
comparisons with others scenarios are coherent with the study by Collet, Lardon [9]. It is important to 615
note that some categories increase for a large coverage of photovoltaic panels (> 80% coverture), such 616
as POF, PMF, TA, ME, or FET. However, the absence of photovoltaic panels either increases or 617
reduces certain impacts, such as IR, mainly due to the electricity requirement or MD due to the 618
production of photovoltaic panels, respectively. 619
620
Table 5. Comparison of LCA results between algae biodiesel and conventional or first-generation biodiesels
621
Algae biodiesel in comparison to: Impact category Conventional
fossil Diesel Palmtree Biodiesel Rapeseed Biodiesel Soybean Biodiesel
Ozone depletion - + - -/+
Human Toxicity + + -/+ +
Photochemical Oxidation Formation - -/+ - -/+
Particulate Matter Formation -/+ -/+ -/+ +
Terrestrial Acidification -/+ -/+ - +
Freshwater Eutrophication + + -/+ -/+
Marine Eutrophication -/+ - - -
Ionizing Radiation -/+ + -/+ -/+
Water Depletion + + + +
Metal Resources Depletion + + -/+ +
Fossil Resources Depletion - + -/+ +
Natural Land Transformation - - - -
Agricultural Land Occupation + - - -
Urban Land Occupation -/+ -/+ - -/+
Terrestrial Ecotoxicity + - - -
Freshwater Ecotoxicity + -/+ - +
Marine Ecotoxicity + + -/+ +
- Impact reduction for algae biodiesel; + Impact increase for algae biodiesel 622
-/+ Impact reduction or increase for algae biodiesel, depending of percentage of photovoltaic panel coverture 623
624
The overall results highlight the contribution of the culture, infrastructure production and use. This is 625
coherent with results from contribution analyses in others studies [3, 9]. Culture (Subsystem-1) is the 626
main contribution for most of the assessed impacts (CC, PMF, TET, TA, OD, FD, HT, Nat LO, Agri 627
LO and Urban LO). For the remaining categories, culture is classified as a second contributor, 628
preceded by the photovoltaic system (Subsystem-5) in the case of FET, MET, IR, FE and MD, or 629
combustion (Subsystem-6) in POF and ME. 630
The infrastructure in the culture (Subsystem-1) has a significant effect in terms of CC, PMF, OD, FD, 631
HT, Nat LO, Agri LO and Urban LO, due to the production of materials (mainly steel, PVC, HDPE, 632
aluminium and concrete) used in the greenhouse, and to machinery and pipe productions. In addition, 633
pond emissions from culture mainly contribute to TA and TET through volatilized ammonium and 634
N2O. Although nitrogen fertilizer requirements are reduced (the culture system works under
nitrogen-635
limiting conditions to improve the lipid contents in microalgae), nitrogen-based fertilizer production 636
remains the main contributor in these categories. 637
The different metals and energy used to build the CIGS system highly contribute to the impacts of the 638
photovoltaic system (Subsystem-5). Silver used for screen manufacturing contributes to MD, CC, TA, 639
PMF and HT. This is mainly due to the impacts generated by the extraction and processing of silver, 640
including also its high requirement in fossil energy (which strongly contributes to IR). In addition, 641
extraction/manufacturing of stainless silver (substrate) essentially impacts OD, while water used for 642