HAL Id: hal-01021779
https://hal-enac.archives-ouvertes.fr/hal-01021779
Submitted on 31 Oct 2014
HAL is a multi-disciplinary open access
archive for the deposit and dissemination of
sci-entific research documents, whether they are
pub-lished or not. The documents may come from
L’archive ouverte pluridisciplinaire HAL, est
destinée au dépôt et à la diffusion de documents
scientifiques de niveau recherche, publiés ou non,
émanant des établissements d’enseignement et de
Phase noise in GNSS transmission / reception system
Emilie Rebeyrol, Christophe Macabiau, Lionel Ries, Jean-Luc Issler, Michel
Bousquet, Marie-Laure Boucheret
To cite this version:
Emilie Rebeyrol, Christophe Macabiau, Lionel Ries, Jean-Luc Issler, Michel Bousquet, et al.. Phase
noise in GNSS transmission / reception system. ION NTM 2006, National Technical Meeting of The
Institute of Navigation, Jan 2006, Monterey, United States. pp 698 - 708. �hal-01021779�
Phase Noise in GNSS Transmission/Reception
System
Emilie Rebeyrol, ENAC/TeSA Christophe Macabiau, ENAC Lionel Ries, Jean-Luc Issler, CNES
Michel Bousquet, SUPAERO Marie-Laure Boucheret, ENSEEIHT
BIOGRAPHY
Emilie Rebeyrol graduated as a telecommunications engineer from the INT (Institut National des Télécommunications) in 2003. She is now a Ph.D student at the satellite navigation lab of the ENAC. Currently she carries out research on Galileo signals and their generation in the satellite payload in collaboration with the CNES (Centre National d’Etudes Spatiales), in Toulouse.
Christophe Macabiau graduated as an electronics engineer in 1992 from the ENAC (Ecole Nationale de l’Aviation Civile) in Toulouse, France. Since 1994, he has been working on the application of satellite navigation techniques to civil aviation. He received his Ph.D. in 1997 and has been in charge of the signal processing lab of the ENAC since 2000.
Lionel Ries is a navigation engineer in the "Transmission Techniques and Signal Processing Department", at CNES since June 2000. He is responsible of research activities on GNSS2 signals, including BOC modulations and modernised GPS signals (L2C & L5). He graduated from the Ecole Polytechnique de Bruxelles, at Brussels Free University (Belgium) and then specialized in space telecommunications systems at Supaero (ENSAE), in Toulouse (France).
Jean-Luc Issler is head of the Transmission Techniques and signal processing department of CNES, whose main tasks are signal processing, air interfaces and equipments in Radionavigation, Telecommunication, TT&C, High Data Rate TeleMetry, propagation and spectrum survey. He is involved in the development of several spaceborne receivers in Europe, as well as in studies on the European RadioNavigation projects, like GALILEO and the Pseudolite Network. With DRAST and DGA, he represents France in the GALILEO Signal Task Force of the European Commission. With Lionel Ries and Laurent Lestarquit , he received the astronautic prize 2004
of the French Aeronautical and Astronautical Association (AAAF) for his work on Galileo signal definition.
Michel Bousquet is a Professor at SUPAERO (French Aerospace Engineering Institute of Higher Education), in charge of graduate and post-graduate programs in aerospace electronics and communications. He has over twenty five years of teaching and research experience, related to many aspects of satellite systems (modulation and coding, access techniques, onboard processing, system studies...). He has authored or co-authored many papers in the areas of digital communications and satellite communications and navigation systems, and textbooks, such as “Satellite Communications Systems” published by Wiley.
Marie-Laure Boucheret graduated from the ENST Bretagne in 1985 (Engineering degree in Electrical Engineering) and from Telecom Paris in 1997 (PhD degree). She worked as an engineer in Alcatel Space from 1986 to 1991 then moved to ENST as an Associated Professor then a Professor. Her fields of interest are digital communications (modulation/coding, digital receivers, multicarrier communications …), satellite on-board processing (filter banks, DBFN …) and navigation system.
ABSTRACT
Recently the GPSIIR-M and the experimental Galileo satellites (GIOVE-A) were launched making the first step in the orbit-validation of the GPS modernization system and of the Galileo system. The new signals generated by the GPSIIR-M satellite and the Galileo system require modulations which are more complex than the QPSK modulation used in the current GPS system. These new modulations could be a source of distortions for the received signal and require analyses and optimisation.
Indeed, in the Galileo system, the Alternate Binary Offset Carrier modulation (ALTBOC) is an innovative
modulation proposed for the transmission of the E5 band signal and the Composite Binary Coded Symbol (CBCS) is an innovative signal proposed to optimize the L1 Open service (OS) signal. All the Galileo signals have a constant envelope modulation, thereby allowing the use of saturated power amplifiers with limited signal distortion. However the signals have 8 phase “scattered” plots in the modulation diagram and a deviation of the modulation plots, with respect to the nominal constellation, could reduce the performance of the tracking loops in the receiver. This deviation of modulation plots constellation could be induced by the Amplitude-Modulation to Phase-Modulation (AM/PM) distortions of the amplifier in the payload. But it could also be resulting from the phase noise created by the instabilities of the payload and receiver clocks.
The aim of this paper is to evaluate the impact of the phase noise due to the SSPA (Solid State Power Amplifier) and to the payload and receiver clocks instabilities, on the receiver tracking performance. The case of the Galileo E5 signal will be studied considering a classical payload scheme.
The transmission scheme can be described as follows. In the payload unit, the signals are first digitally generated, then converted by a digital-to-analog device, up-converted, and then amplified by the SSPA before being transmitted in their respective frequency bands. In the receiver part, the signals are down-converted, then go through the analog-to-digital converter, and are finally tracked by the Phase Lock Loop and the Delay Lock Loop. The evaluation of the performance in reception is based on the phase error estimated in the Phase Lock Loop.
In a first part the way the phase noise affects the signals through the payload assuming a typical performance of the on-board clock generation unit is studied. In this part the phase noise introduced by the SSPA is also investigated and compared to the phase noise introduced by the atomic clock instabilities. Then, the power spectral density of the phase noise due to the receiver clock and its effects on the received signal during the down-conversion and the analog-to-digital conversion are presented. The effect of the incoming signal phase noise on the phase estimation in the Phase Lock Loop is also studied. Finally, to conclude, the impact of the SSPA phase noise and payload/receiver clocks phase noise on the receiver performance are summarized.
I. INTRODUCTION
With the development of the Galileo system and the modernization of the GPS, the phase noise contribution is an essential factor in the characterization of the signals
because it limits the absolute precision of satellite positioning.
The phase noise can be introduced by the satellite and receiver clocks oscillators. At the satellite level, very stable clocks such as Rubidium and Hydrogen Maser atomic clocks are used to reduce the phase noise as much as possible. However, these clocks are disturbed by unavoidable processes such as random noise. The receiver clocks are usually less stable than the satellite clocks and they depend greatly on the receiver design and cost.
But the phase noise could also be induced by the non-linear payload amplifier which entails distortions because of a non-constant Amplitude-Modulation to Phase-Modulation (AM/PM) curve. This phase noise could affect the modulation constellation plot and thus lead to errors on the pseudo-range measurement.
The aim of this paper is to analyze the phase noise due to payload amplifier, payload and receiver clocks instabilities and evaluate its impact on the receiver performance, particularly on the phase error estimation in the receiver Phase Lock Loop (PLL). In the first part we will present in details a description of the phase noise and its frequency and time domain characterization. The second part will first examine the phase noise generated in the payload and then the phase noise generated in the receiver. To conclude Matlab simulations results which permit to evaluate the phase error estimation in the receiver PLL for a Galileo E5 Alternate Binary Offset Carrier (ALTBOC) signal will be presented.
II. PHASE NOISE CHARACTERIZATION
The output signal of real oscillators, if we assume negligible amplitude noise, can be expressed thanks to the following model which permits to study the random phase and frequency fluctuations ([Rutman and Walls, 1991]):
( )
(
2
)
(1)
sin
)
(
t
A
0t
t
V
=
⋅
πν
+
φ
The frequency noise is a random process defined by:
( )
dt
t
d
t
v
t
v
φ
π
ν
2
1
)
(
)
(
≡
−
0=
∆
(2)where (t) is the random process of interest, the phase noise,
0 the nominal carrier frequency, and
v(t) is the time dependent instantaneous frequency of the oscillator defined by:
( )
(
2
)
(3)
2
1
)
(
dt
0t
t
d
t
v
πν
φ
π
+
=
We can also define the dimensionless frequency fluctuations: 0
)
(
)
(
ν
t
v
t
y
=
∆
(4) From these expressions two sets of parameters which are used to characterize the oscillators can be introduced:- the spectral densities of phase and frequency fluctuations, in the Fourier frequency domain - the variance (or standard deviation) of the
averaged frequency fluctuations in the time domain
Frequency Domain
In the Fourier frequency domain, phase and frequency fluctuations can be characterized by the respective one-sided spectral densities, S (f) and S (f) which are related by the simple law:
)
(
)
(
f
f
2S
f
S
∆ν=
⋅
φ (5) which corresponds to the time derivative relationship between (t) and v(t). The spectral density Sy(f) is also widely used and is very simply related to S (f) and S (f) by: ) ( ) ( ) ( 2 0 2 2 0 f S f f S f Sy ν φν
ν
= ⋅ = ∆ (6)The most common engineering characteristic used to specify the phase noise is the Single Side Band (SSB) Phase Noise £(f) defined by:
( )
( )
(7) 2log 10
£ f = ⋅ Sφ f
£(f) represents the ratio of power in one sideband due to noise (for a 1 Hz bandwidth) to the total signal power (carrier plus sidebands).
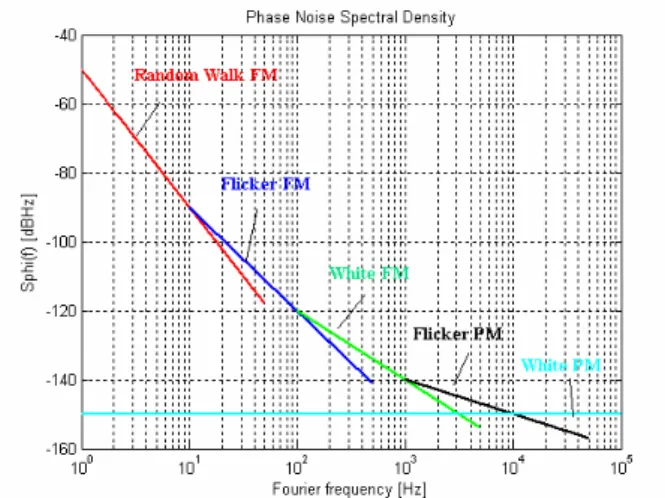
In several articles [IEEE Std. 1139-1988] it has been shown by theoretical considerations and experimental measurements, that the spectral densities due to random noise can be modeled using a power law model where the spectral densities vary as a power of f. Sy(f) can then be written as: = − =
=
2 2)
(
α α α αf
h
f
S
y for 0<f<fh, (8)where fh is an upper cut-off frequency. Each term is related to a given noise source in the oscillator. These sources are given in table 1:
Sy(f) S (f) Designation
h -2 f -2 02 h -2 f -4 Random walk frequency noise h -1 f -1 02 h -1 f -3 Flicker frequency noise
h0 f 0 02 h0 f -2 White frequency noise h1 f 1 02 h1 f -1 Flicker phase noise h2 f 2 02 h2 f 0 White phase noise
Table 1: Frequency and phase noises
The random walk frequency noise usually relates to the oscillator environment (temperature, vibrations, shocks...). The flicker frequency noise sources are thought to be related to electronics and environment in atomic frequency standards. The White frequency noise arises from additive white noise sources internal to the oscillator loop, such as thermal noise. The Flicker phase noise is usually added by noisy electronics. The White Phase noise is usually due to additive white noise sources external to the oscillator loop.
Figure 1 is a representation of the power law model.
Figure 1: Phase Noise Spectral Density Model
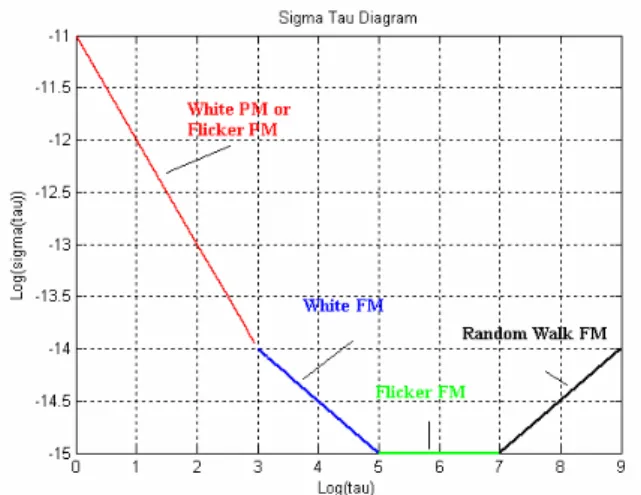
Time Domain: The Allan Variance
In the time domain the frequency instability is defined by the two sample variance y2( ) or the two sample deviation y( ). This variance is called the Allan variance. For the sampling time , we have ([IEEE Std. 1139-1988]):
( )
(
)
2 1 2 2 1 k k y τ = y + −y σ where (9)( )
+ = ττ
k k t t k yt dt y 1The following diagram shows the relationship between the Allan variance and the noise processes if the power spectral density of the phase noise can be defined by the power law model.
Figure 2: Allan Variance Model
Now that the parameters used to describe the phase noise have been presented, the following section will present the different units which add phase noise to the signal.
III. PHASE NOISE IN THE PAYLOAD
A navigation payload is composed of different units: - a clock unit which is composed of the atomic clocks, - a signal generation unit, which generates the
navigation signal,
- a frequency generation unit, which permits to up-convert the signal to the L-band, and
- an amplifier unit.
As already mentioned the phase noise is due to the clock instabilities or the amplifier non-linearities. So it is created in the clock unit and in the amplifier unit. But it can also appear in units which use the frequency reference generated by the clock unit.
Clock Unit
The navigation satellites carry two types of clocks: Rubidium atomic clocks and Hydrogen Maser atomic clocks. The excellent stability of the Rubidium clock allows only a 3 second drift in 1 million years. The Hydrogen Maser is even more stable and it would drift only by 1 second in 3 million years.
As presented in [Moreno Carrillo et al., 2005], the Galileo satellite navigation system employs, as a master navigation signal, a 10.23 MHz tone generated from the 10 MHz atomic clocks presented above. The Clock Monitoring and Control Unit (CMCU) synthesizes this navigation signal from one of the four atomic clocks.
Figure 3 represents the power spectral density of the inherent phase noise of the 10.23 MHz signal at the output of the CMCU ([Moreno Carrillo et al., 2005]):
Power Spectral Density of the CMCU phase noise [Moreno Carrillo, 2005] -160 -150 -140 -130 -120 -110 -100 -90 -80
1 10 100 1,00E+03 1,00E+04 1,00E+05
frequency offsets [Hz] S S B p ha se n oi se [d B c/ H z]
Figure 3: Power Spectral Density of the clock unit phase noise
Hereafter, this phase noise model will be considered as the reference phase noise both for the Galileo system and the GPS system because the CMCU phase noise presented is suitable both for the rubidium and hydrogen maser clocks.
Frequency generation unit
The frequency generation unit delivers the clock frequencies to the signal generation unit, which generates the navigation message and modulates it. It also converts the navigation signals to the L-band for broadcast to users. The Digital-to-Analog Conversion is also made in this unit.
The frequency generation unit is composed of several frequency synthesizers which use the reference frequency generated in the clock unit to generate the intermediate frequencies and to up-convert the signals to L-band. In the present study the frequency synthesizers’ structure has been considered similar to the structure of a PLL synthesizer. It has also been considered that each frequency is generated using a distinct frequency synthesizer.
So for example, the scheme for the Galileo frequency generation unit is shown in Figure 4:
Figure 4: Frequency Generation Unit
First of all, the phase noise introduced by the D/A converter is studied. The phase noise considered here is the phase variations on the analog signal induced by the D/A sampling clock instability. The time jitter tj(t) on the sampling clock can be related to the reference clock phase noise (t) as presented in [Da Dalt et al., 2002]:
( ) ( )
(10) 2 T t t tj = ⋅ π ϕNote that this relationship is only valid if tj << T, the sampling period.
Due to the jitter tj, the instants of sampling are moved away from their ideal location. The digital kth sample will not be outputted exactly at time kT, but at kT+ tj(kT).
The phase noise introduces by the D/A converter on the signal is represented in the time domain on the next curve:
Figure 5: D/A converter phase noise
Let now consider the phase noise introduced by the frequency synthesizers. As already mentioned, the frequency synthesizers used in the navigation satellite payload, are assumed similar to the commonly used synthesizer based on the simple single-loop PLL. A PLL frequency synthesizer consists of two oscillators (a reference oscillator and a Voltage Control Oscillator (VCO)), a phase detector, a loop filter and a frequency divider. Figure 6 represents the block diagram of the single loop PLL frequency synthesizer:
Figure 6: PLL frequency synthesizer
The reference clock is the clock that was considered in the clock unit. The phase detector is capable of comparing the phase of two signals and producing a control signal proportional to that phase difference. The VCO is tuned by the PLL to deliver a tone whose frequency is a multiple of a reference frequency. A crystal oscillator is generally employed for the reference due to its low phase noise as well as its high accuracy. Consequently, a crystal oscillator VCO is considered whose inherent phase noise power spectral density is represented in Figure 7 (Rakon website):
Pow er Spectral Density of VCO phase noise (w w w ,rakon,com)
-160 -150 -140 -130 -120 -110 -100 -90 -80
1,00E+03 1,00E+04 1,00E+05 1,00E+06 1,00E+07 1,00E+08
frequency offsets [Hz] S S b p h as se n o is e [d B c/ H z]
Figure 7: Power Spectral Density of VCO phase noise
The loop filter is used to set the appropriate robustness and guarantee stability when the other parts of the system have been specified (phase detector gain, VCO gain, divider ratio, etc…).
We are interested in the calculation of the signal phase noise at the output of the different PLL frequency synthesizers. At the PLL output, the VCO phase noise is changed by the action of the loop. In addition, the reference input has its own phase noise spectrum and the
output phase noise depends on this contribution as well. The next scheme represents the equivalent linear model for the PLL. It shows the modification of the reference signal phase during the frequency synthesis:
Figure 8: PLL phase model
The total output phase noise for a PLL can be expressed as:
( )
f S( )
f N2 H( )
f 2 S( )
f 1 H( )
f 2Sout = CU ⋅ ⋅ + vco ⋅ − (11)
where SCU(f) is the power spectrum density of the reference clock phase noise,
SVCO(f) is the power spectrum density of the VCO phase noise, and
H(f) is the PLL closed loop transfer function equal to:
( )
( )
( )
( )
( )
(12) N s F K K s N s F K K s s s H PD VCO PD VCO ref out ⋅ ⋅ + ⋅ ⋅ = = θ θwhere F(s) the transfer function of the loop filter, KVCO and KPD are the gains of the VCO and the phase detector.
The equation 11 shows that the phase noise at the PLL output depends on the value of the frequency divider N.
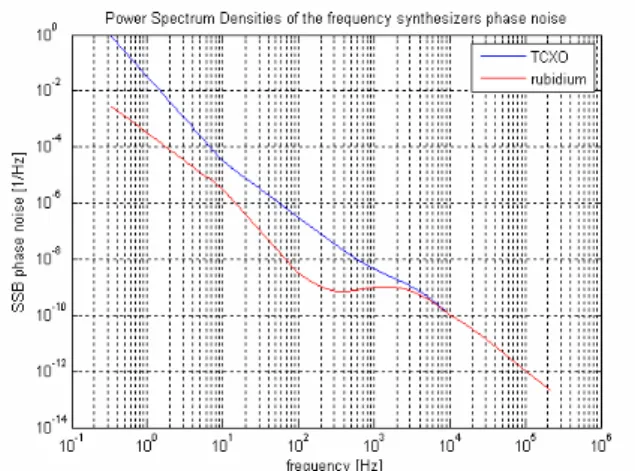
Considering the Galileo frequency generation unit represented on Figure 4, the power spectrum densities of the phase noise at the output of the three frequency synthesizers in the payload can then be represented as shown in Figure 9:
Figure 9: Power Spectral Density of frequency synthesizers phase noise
Non-linear Amplifier
After being up-converted by the frequency generation unit, the signal is filtered and then amplified thanks to a non-linear amplifier. Currently two main types of power amplifiers may be used on a satellite: the Traveling Wave Tube Amplifiers (TWTA) and the Solid State Power Amplifier (SSPA). It has been chosen herein to study the phase noise introduced by an SSPA. To describe a non-linear amplifier as the SSPA, we use the AM/AM and AM/PM curves (AM: amplitude modulation, PM: phase modulation). They are represented in Figure 10 ([Armengou-Miret, 2003]):
Figure 10: SSPA AM/AM and AM/PM curves
Assuming that s(t) is the signal at the input of the amplifier and z(t) the signal at its output, it can be written:
( )
() ) ( ) (t st g s t z = ⋅ with (13) r e r a r g r i () ) ( ) ( = ⋅ φwhere a(r) is the AM/AM conversion, and represents the evolution of the signal output power according to the signal input power,
(r) is the AM/PM conversion, and represents the output phase difference according to the signal input power.
It can be noticed on Figure 10 that the amplifier phase output is not constant and consequently the different points of the signal will not be amplified in the same way. So a phase noise is also introduced in the signal by the non-linear power amplifier.
Conclusion
It has been seen that considering a signal s(t) generated by the signal generation unit, this signal will be affected by phase noises introduced by:
- the D/A converter, D/A(t) - the up-conversion, up(t) - the amplifier, SSPA(t)
So the power spectrum density of the signal phase noise at the payload output can be written as:
)
(
)
(
)
(
)
(
f
S
/f
S
f
S
f
S
payload=
D A+
up+
SSPA (14) where SD/A(f) is the power spectrum density of D/A(t),Sup(f) is the power spectrum density of up(t), and
SSSPA(f) is the power spectrum density of SSPA(t).
Thanks to Equation 11, it can be written that:
( )
( )
( )
1( )
( ) ) ( ) ( 2 2 2 / f S f H f S f H N f S f S f S SSPA vco CU A D payload + − ⋅ + ⋅ ⋅ + = (15)IV. PHASE NOISE IN THE RECEIVER
Figure 11 represents the generic receiver functional block diagram considered:
Figure 11: Receiver scheme
As for the payload the phase noise introduced in the receiver is due to the receiver clock short-term instabilities. As noticed in Figure 11 the frequency synthesizers use the receiver clock oscillators as the reference frequency to down-convert and digitize the signal that comes from the satellite. Consequently at reception the phase noise created by the receiver clock instabilities will affect the signal during the down-conversion and the A/D down-conversion.
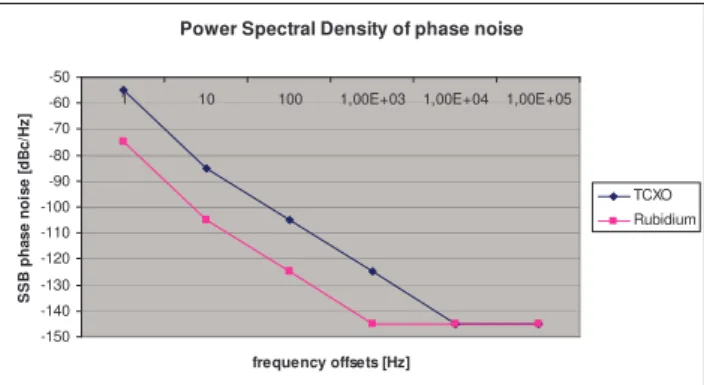
Reference oscillator
Two categories of receivers, which use two different reference clocks, are considered herein. The first one is found in most commercial applications, its reference oscillator is a 10 MHz TCXO and the second one needs a very good clock stability for its applications, so its oscillator is a 10 MHz rubidium atomic clock.
The power spectral density of TCXO and rubidium phase noise was found in (Rakon website). The two power spectral densities are plotted in Figure 12:
Power Spectral Density of phase noise
-150 -140 -130 -120 -110 -100 -90 -80 -70 -60 -50
1 10 100 1,00E+03 1,00E+04 1,00E+05
frequency offsets [Hz] S S B p ha se n oi se [d B c/ H z] TCXO Rubidium
Figure 12: Power Spectral Density of TCXO and rubidium receiver clocks
Frequency synthesizer
The frequency synthesizer is required to generate local oscillator signals for the down-conversion and local clocks for the A/D conversion and the signal processing. We will consider that the frequency synthesizer used in
the receiver is a common synthesizer based on the simple single-loop PLL.
It has been seen in section III how to evaluate the phase noise at the output of a PLL synthesizer. However, the VCO used is less stable than the VCO used in the satellite payload PLL synthesizer and has, consequently, a higher phase noise than the payload VCO. The power spectral density of its inherent phase noise is plotted in Figure 13 (Rakon Website):
Power Spectral Density of VCO phase noise in the receiver
-160 -140 -120 -100 -80 -60 -40
1,00E+03 1,00E+04 1,00E+05 1,00E+06 1,00E+07 1,00E+08
frequency offsets [Hz] S S B p h as e n o is e [d B c/ H z]
Figure 13: VCO phase noise power spectral density
To calculate the power spectrum density of the phase noise at the output of the local oscillator in the receiver, the Equation 11 will be used.
The next graph shows the power spectral densities of the local oscillator phase noise with the two reference oscillators: TCXO and rubidium. To plot the curves we have chosen N=100 to be close to a E5 band signal case.
Figure 14: PLL frequency synthesizers phase noise power spectrum density
Down-conversion
The down-conversion of the signal is not made in one stage. But all the local oscillators frequencies used for this down-conversion are derived from the local oscillator generated thanks to the frequency synthesizer presented in the previous section. So the phase noise of the other local oscillators can be deduced from the phase noise calculated previously.
Finally the power spectral density of the phase noise introduced on the signal at the end of the down-conversion is equal to:
2 2 ) ( ) ( ) ( ) ( ) ( B f S A f S f S f S f S LO LO LO payload DC = + + + (17)
where Spayload(f) is the phase noise power spectral density of the signal incoming from the satellite and arriving at the antenna,
A and B depend on the signal frequency carrier and represent the down-conversion stages. Equation 17 can be simplified because SLO predominates due to the classical values of A and B (Zarlink website):
) ( ) ( ) (f S f S f SDC ≈ payload + LO
(18) A/D converter
The influence of the time jitter introduced by the A/D converter is taken into account in the same way as for the D/A converter (Equation 10).
V. RESULTS
To quantify the influence of the phase noise introduced by the GNSS transmitter and receiver on the signal, the phase error estimation in the tracking receiver PLL has to be analyzed. The generic tracking loop block diagram is represented on the next scheme:
Figure 15: Tracking PLL scheme
The linear equivalent model of the tracking loop represented above is:
Figure 16: Tracking PLL phase model
The phase of the incoming signal is affected by the phase noise introduced in the payload and in the receiver during the down-conversion and the A/D conversion, so an error e on the initial phase (excluding thermal noise) has been added. Moreover, the NCO of the PLL is driven by the reference oscillator of the receiver, so the phase noise of the reference oscillator creates also an error NCO on the estimated phase
θ
ˆ
. However, the phase noise introduced by the NCO is negligible in front of the incoming signal phase noise because its frequency is low in front of the down-conversion frequency.The objective of the PLL is to generate a local signal that has the same phase as the incoming signal. So we want that
θ
ˆ
is as close as possible to the value of +e. To evaluate the error made on the estimation, the following expression has to be calculated:NCO
e
θ
δθ
θ
ε
θ = + − ˆ−It can also be written as
e N + − =θ θ εθ ˆ with N e e NCO e= −δθ ≈ (19) since e >> NCO.
So the present model can be simplified by introducing the effect of the phase noise only on the incoming signal:
Figure 17: Simplified Tracking PLL phase model
Moreover according to [Parkinson and Spilker, 1996], we have: (20) ˆ H N H e⋅ + ⋅ =θ θ
where H the PLL transfer function . So,
[
]
[
]
e e N H H N ⋅ − + ⋅ − = − + = 1 1 ˆθ
ε
θ
θ
ε
θ θ (21)Thus, the mean-square error of a PLL due to the payload and receiver clocks phase noise, in radians, is given as:
( )
∞ ⋅ − ⋅ = 0 2 2 S (f) 1 H jf df e Nσ
(22)where SNe (f) is the single-sideband power spectrum density of the incoming phase noise and, H is the transfer function of the PLL.
Considering a 3rd order PLL, the following model can be used [Parkinson and Spilker, 1996]:
6 6 6 2 ) ( 1 f f f jf H L + = − where fL=2 *1.2*BL,
BL is the loop noise bandwidth.
To present the Matlab simulation results a payload representative of a GNSS payload and receiver working at the E5 band have been considered. The signal generated in the payload is an ALTBOC(15,10) with a constant envelope ([Rebeyrol et al., 2005]).
In this case the power spectrum density of the signal phase noise at the payload output is shown in Figure 18:
Figure 18: Payload Phase Noise Power Spectrum Density
The power spectrum density of the signal phase noise at the tracking PLL input is shown in Figure 19:
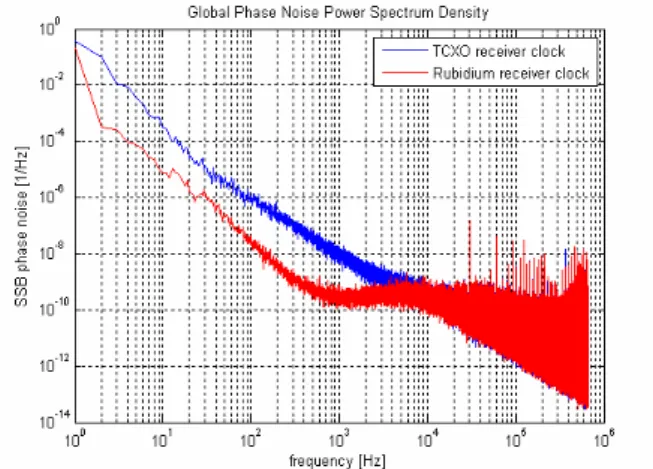
Figure 19: Global Phase Noise Power Spectrum Density
In the following table the values of the PLL error are given. We have chosen a loop noise bandwidth equal to 10 Hz.
Receiver clock TCXO Rubidium
PLL jitter (°) 2.86 0.5
Table 2: PLL phase error due to GNSS payload and receiver.
As foreseen the error made in the tracking PLL is worse for the TCXO than for the rubidium clock. We clearly see on Figure 19 that the level of the power spectrum density is effectively higher for the low frequencies in the case of the TCXO. For high frequencies the level of the power spectrum density is similar for both
cases because for high frequencies it is the frequency synthesizers VCO phase noise which predominates and we have considered the same VCO for the both receivers.
It can also be noticed, by comparing Figure 18 and Figure 19 that it is the phase noise introduced by the receiver which predominates. Indeed calculating the PLL phase error, and considering that the payload does not introduce phase noise, a rubidium receiver has a phase error standard deviation equal to 0.45°.
To evaluate the influence of the phase noise on the signal, we have plotted the modulation constellation of the ALTBOC(15,10) through the payload and the receiver. Figure 20 summarizes the curves obtained. For all the curves a rubidium clock receiver is considered and the filters are not taken into account.
Figure 20: Influence of the payload and receiver phase noise on the ALTBOC modulation constellation
The top graphs represent the modulation constellation after the payload up-conversion. We could notice on the zoom graph that phase noise was introduced on the signal because the plots are spread.
The down left side graph represents the modulation constellation after the amplification at the payload output. The amplifier introduces an offset for all the modulation plots. The last graph represents the modulation constellation after the A/D conversion in the receiver and we clearly notice that phase noise is being introduced by the receiver because the modulation plots are spread.
Initial ALTBOC signalplots Signal plots after the D/A conversion and the up-conversion in the payload Signal plots at the payload output
As already demonstrated by the calculation of the PLL jitter, the modulation constellation graphs show that the phase noise introduced by the receiver predominates.
However the phase noise introduced by the satellite payload could not be neglected during the design of the payload itself.
VI. CONCLUSION
This paper has presented a detailed analysis of the phase noise appearing in navigation systems. First a definition of the phase noise is given. Second all the different signal phase noise contributors of navigation payload and receiver are characterized. Then simulation results are shown. On the one hand they show that the phase noise introduced by the receiver predominates but on the other hand the phase noise introduced by the satellite payload is not negligible.
However further studies should be done to consolidate these results. A particular attention should be taken to investigate the influence of the filter in reception. Moreover it would be interesting to study more deeply the exact influence of the amplifier. The study of its best working point would be particularly interesting such as the influence of the amplifier non-linearities on the modulation constellation. Finally, it could also be interesting to realize the same study for the Galileo L1 signals to determine the payload influence on its generation.
ACKNOWLEDGMENT
The authors are thankful to Olivier JULIEN for his valuable remarks and suggestions.
REFERENCES
[Armengou-Miret, 2003]: « Techniques de multiplexage en bande L1. Pertes de corrélation associées » – Rapport de stage au CNES – février 2003.
[Da Dalt et al., 2002]: “On the jitter requirements of the sampling clock for Analog-to-Digital converters” – N. Da Dalt, M. Harteneck, C. Sandner and A. Wiesbauer – IEEE Transactions on Circuits and Systems – September 2002. [Hein et al., 2005]: “A candidate for the Galileo L1 OS optimized signal” – G.W. Hein, J-A Avila-Rodriguez, L. Ries, L. Lestarquit, J-L Issler, J. Godet, T. Pratt – ION GNSS 2005 – Long Beach, September 2005.
[IEEE Std. 1139-1988]: IEEE Standard Definitions of Physical Quantities for Fundamental Frequency and Time Metrology.
[Irsigler and Eisfeller, 2002]: “PLL Tracking Performance in the Presence of Oscillator Phase Noise” – M. Irsigler and B. Eisfeller – GPS solutions – Spring 2002.
[Jeanmaire and Emma, 1999]: “Rubidium Atomic Clock for Galileo” – A. Jeanmaire, F. Emma – 31st Annual Precise Time and Time Interval (PTTI) Meeting, 1999. [Moreno Carrillo et al., 2005]: “Hybrid Synthesizers in Space Galileo’s CMCU” – F.J. Moreno Carrillo, A. Alvaro Sanchez, L. Basanta Alonso – Data Systems In Aerospace Conference – June 2005.
[Parkinson and Spilker, 1996]: “Global Positionning System: Theory and Applications” – Volume 1.
[Rajan and Irvine, 2005]: “GPS IIR-M and IIF: Payload Modernization” – Dr. J.A. Rajan and J. Irvine – ION NTM 2005 – January 2005.
[Rebeyrol et al., 2005]: “BOC Power Spectrum Densities” – E. Rebeyrol, C. Macabiau, L. Lestarquit, L. Ries, J-L. Issler, M-L. Boucheret, M. Bousquet – ION NTM 2005 – January 2005.
[Rutman and Walls, 1991]: “Characterization of Frequency Stability in Precision Frequency Sources”, J. Rutman, and F.L. Walls, Proc. of the IEEE, Vol. 79, No. 6, pp. 952-960, June 1991.
[Ryu and Lee, 2002]: “Analysis and minimization of phase noise of the digital hydrid PLL frequency synthesizer” – H-G. Ryu and H-S. Lee – IEEE transactions on Consumer Electronics – May 2002. Web sites:
- ESA: www.esa.int
- Precise Time and Frequency Inc. :
www.ptfinc.com
- RAKON: www.rakon.com