HAL Id: hal-03040791
https://hal.archives-ouvertes.fr/hal-03040791
Submitted on 21 Dec 2020
HAL is a multi-disciplinary open access
archive for the deposit and dissemination of
sci-entific research documents, whether they are
pub-lished or not. The documents may come from
teaching and research institutions in France or
abroad, or from public or private research centers.
L’archive ouverte pluridisciplinaire HAL, est
destinée au dépôt et à la diffusion de documents
scientifiques de niveau recherche, publiés ou non,
émanant des établissements d’enseignement et de
recherche français ou étrangers, des laboratoires
publics ou privés.
Hayri Balcioglu, Lakshmi Balasubramaniam, Tomita Vasilica Stirbat, Bryant
Doss, Marc-Antoine Fardin, René-Marc Mège, Benoit Ladoux
To cite this version:
Hayri Balcioglu, Lakshmi Balasubramaniam, Tomita Vasilica Stirbat, Bryant Doss, Marc-Antoine
Fardin, et al.. A subtle relationship between substrate stiffness and collective migration of cell clusters.
Soft Matter, Royal Society of Chemistry, 2020, 16 (7), pp.1825-1839. �10.1039/c9sm01893j�.
�hal-03040791�
ARTICLE
a.Mechanobiology Institute, National University of Singapore, Singapore 117411,
Singapore
b.Institut Jacques Monod, CNRS UMR 7592, Université Paris Diderot, 75013 Paris,
France* correspondence: [email protected]
Electronic Supplementary Information (ESI) available: [details of any supplementary information available should be included here]. See DOI: 10.1039/x0xx00000x
Received 00th January 20xx, Accepted 00th January 20xx DOI: 10.1039/x0xx00000x
A subtle relationship between substrate stiffness and collective
migration of cell clusters
Hayri E. Balcioglua, Lakshmi Balasubramaniamb, Tomita Vasilica Stirbatb, Bryant Dossa,
Marc-Antoine Fardinb, René-Marc Mègeb, Benoit Ladoux b,*
The physical cues from the extracellular environment mediates cell signaling spatially and temporally. Cells respond to physical cues from their environment in a non-monotonic fashion. Despite our understanding of the role of substrate rigidity on single cell migration, how cells respond collectively to increasing extracellular matrix stiffness is not well established. Here we patterned multicellular epithelial Madin–Darby canine kidney (MDCK) islands on polyacrylamide gels of varying stiffness and studied their expansion. Our findings show that the MDCK islands expanded faster with increasing stiffness only up to an optimum stiffness, over which the expansion plateaued. We then focused on the expansion of the front of the assemblies and the formation of leader cells. We observed cell front destabilization only above substrate stiffness of a few kPas. The extension of multicellular finger-like structures at the edges of the colonies for intermediate and high stiffnesses from 6 to 60 kPa responded to higher substrate stiffness by increasing focal adhesion areas and actin cable assembly. Additionally, the number of leader cells at the finger-like protrusions increased with stiffness in correlation with an increase of the area of these multicellular protrusions. Consequently, the force profile along the epithelial fingers in the parallel and transverse directions of migration showed an unexpected relationship leading to a global force decrease with the increase of stiffness. Taken together, our findings show that epithelial cell colonies respond to substrate stiffness but in a non-trivial manner that may be of importance to understand morphogenesis and collective cell invasion during tumour progression.
Introduction
The mechanical properties of the cellular microenvironment play a major role in the regulation of biological processes including morphogenesis, tissue remodeling and repair, and tumour progression1. The adaptation of single cell to substrate
stiffness has been well described in the past two decades, leading to the so-called “durotactic” motility, i.e. directional cell migration along a stiffness gradient2. Intense research was
carried out to determine the impact of substrate stiffness on various cellular functions including cell fate3,4, cell spreading5
and to understand the underlying molecular mechanical responses at the local scale of focal adhesions6–9 and at the
scale of the cytoskeleton10–13. Such studies have been first
performed in vitro at the single cell level14. Cells respond to the
stiffness of their substrate and applied force by reinforcing their focal adhesions (FAs) that act as mechanosensors6,7,9,15.
The underlying mechanism involves a force-dependent stretching of some of the proteins inside FAs, leading to the unfolding of cryptic binding sites, which in turn can recruit other signaling molecules16. This promotes further
reinforcement of the FA and initiates a signalling cascade
leading to a cellular response. Additionally, single cell responses to substrate stiffness also exhibit large-scale responses mediated by cytoskeleton rearrangement11–13. The
observation of local contractile units at early cell spreading functioning as rigidity sensors may be a way to reconcile local and global responses9,17. The interest of the scientific
community to rigidity sensing has grown even more with the recent evidence of in vivo cell responses to their environmental stiffness18.
Physiological and pathological cellular processes occur not only at the single cell level but often at the scale of cellular populations19. Collective cell migration has been shown to
respond to physical properties of the environment in vivo and in vitro, including confinement20,21, curvature22,23, guidance of
anisotropic stiffness24, stiffness conditions25–27 and even to
viscoelastic materials28. Recent experiments both in vitro and
in vivo shed new light on the importance of environmental stiffness on collective cell behaviours. It has been shown that multicellular clusters in vitro can exhibit durotactic behaviours whereas individual cells failed to do so under similar conditions29 and that matrix stiffening initiates an
epithelial-to-mesenchymal transition in neural crest cells in vivo and triggers their collective migration27.
Along this line, not only substrate stiffness but also adhesiveness through the amount of extra-cellular matrix (ECM) presented to cells revealed various behaviours of epithelial cell assemblies together with particular actin organizations30. The epithelial clusters can transition between
ARTICLE Journal Name
2 | J. Name., 2012, 00, 1-3 This journal is © The Royal Society of Chemistry 20xx
Please do not adjust margins
way reminiscent of the dewetting transition in fluids. For epithelial clusters, this transition is dictated by the competition between contractility and active intercellular stresses and can be tuned by substrate stiffness through an adaptation of E-cadherin expression31. Indeed, at a molecular level, the
organization of epithelial cell clusters is affected by changes in matrix interactions through FAs but also by changes in cell-cell interactions, for which cadherin-based adhesions have been shown to be mechanosensitive32–34.
Finally, from a mechanical point of view, the study from Sunyer et al.29 showing the durotatic behaviour of epithelial
cell monolayers reported that the cohesion of epithelial monolayers relied on the emergence of large-scale force transmission over the entire migrating monolayer. This promoted the idea of extending the mechanical observations made at the single cell scale to multicelular scales. However, other studies reported that the mechanical contribution of the edge of the monolayer can play a pivotal role by locally regulating the migration of epithelial tissues. This includes the formation of leader cells described as single mechanical entities35, the changes in force patterns depending on tissue
curvature23 as well as the role of cryptic lamellipodia in the
bulk36,37. Overall, the contribution of cell edges and the
mechanical expansion of epithelial tissues in relation with substrate stiffness remains unclear as well as the length scales over which the mechanical information are integrated.
Here, we investigate the emerging behaviours of expanding epithelial MDCK colonies in response to changes in substrate stiffness by analysing cell shape changes, cytoskeleton organization, tissue flows and traction forces.
Materials and methods
Cell culture
MDCK stain II WT cells (ATCC® CCL-34™), MDCK-H1-GFP (stable cell line transfected with H1-GFP) and MDCK-GFP actin (stable cell line transfected with GFP actin) cells, which were previously described38,39, were cultured in DMEM medium
(invitrogen) supplemented with 10% fetal bovine serum (invitrogen) and 1% penicillin/streptomycin (invitrogen) and grown at 37 °C and 5% CO2. For live imaging, DMEM was
replaced with low glucose Leibovitz (Sigma-Aldrich). Sample preparation
35 mm glass bottom dishes (Ibidi) were treated with 5% (3-Aminopropyl) triethoxysilane (Sigma) in ethanol for 5 minutes and activated with 30 minutes incubation with 0.5% Glutaraldehyde in MQ, washed with MQ and left to dry. 18 mm coverslips were treated with O2 plasma for 30 minutes,
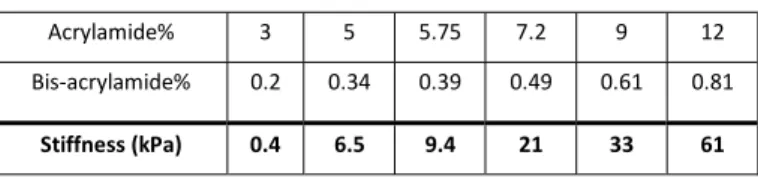
and incubated with PLL-g-PEG (0.1 mg/ml PLL(20)-g[3.5]- PEG(2), SuSoS, dissolved in phosphate-buffered saline (PBS)), washed with MQ and left to dry. Polyacrylamide gels of varying stiffnesses (0.4kPa, 6.5kPa, 9.4kPa, 21kPa, 33kPa and 61kPa) were made using varying concentrations of 40% acrylamide/bis-acrylamide, 37.5:1 (2.7% crosslinker) solution (Bio-RAD) (Table 1), together with 1/1000 total volume TEMED (Bio-RAD) and 1/100 total volume 10% ammonium persulfate
(Bio-RAD) and 1:100 carboxylated fluorescent beads (100 nm, Invitrogen). 25 μL of this solution was pipetted at the middle of the dish, and an 18 mm coverslip was placed on top of the gel to polymerize. After 20 minutes polymerization 1 mL of 10 mM HEPES pH 7.5 was added and the gel was left to rehydrate for 10 minutes before the removal of 18 mm coverslips. Fibronectin (Roche, 0.1 mg/mL in PBS) crosslinking to polyacrylamide gels was obtained by Sulfo-SANPAH (sulfosuccinimidyl 6-(40-azido-20-nitrophenylamino) hexanoate, Sigma). Such high concentration of fibronectin was used to ensure saturated densities of fibronectin on all substrates.
For the fabrication of migration blocks, silicon wafers with desired patterns were made using SU-8 photoresist for soft lithography. To form migration stamps, first a negative mould of PDMS (Sylgard 184, Dow Corning) at 1:10 mixture ratio (curing agent: silicone elastomer) was moulded onto silanised wafers and cured at 80°C for 2 hours. 24x50 cm glass slides were cleaned with 70% EtOH, the PDMS moulds were placed on the glass slides, Plasma treated for 5 minutes, and then trichloro(1H,1H,2H,2H-perfluorooctyl)silane (Sigma) treated for 2 hours. 1:5 (curing agent: silicone elastomer) PDMS was moulded between the negative PDMS mould and glass and baked 2 hours at 130°C, treated with 0.2% pluoronic (F127, Sigma) for 1 hour, rinsed with MQ and left to dry.
Quantification of substrate rigidity using AFM
Young's moduli of polyacrylamide gels were measured by atomic force microscopy. Briefly, gels were prepared as described and indented using a JPK Nanowizard II (JPK Instruments, Germany) and LRCH-500 (Team Nanotec, Germany) probe. The spring constant was calibrated with the thermal tuning method and the probe geometry was provided by the manufacturer. Force-indentation curves were fit using the Hertz contact model and two independent mixtures for each gel were tested and averaged.
Live cell imaging
The migration blocks were placed on gels and incubated with complete media for 1 hour in the incubator. 500,000 cells in 3 mL of media was pipetted onto the substrates, and placed in the incubator overnight for cell attachment and the confluent circular monolayer formation within the PDMS stencil. The migration block was then removed, the gels were washed with PBS to remove excess cells, and medium was replaced with Leibovitz medium to obtain 350±72 (mean±SD) cells in discs of 300 μm diameter on all stiffnesses. The expansion of MDCK HI-GFP islands were imaged every 15 minutes for 24 hours on an Olympus IX81 inverted microscope with temperature and CO2
controls using a LUCPLFLN20X 0.45NA air objective. The Table 1 – Polyacrylamide gel stiffness. The concentration of acrylamide and bis-acrylamide used and the stiffness of the resulting polybis-acrylamide gel.
Acrylamide% 3 5 5.75 7.2 9 12 Bis-acrylamide% 0.2 0.34 0.39 0.49 0.61 0.81
Journal Name ARTICLE imaging of MDCK GFP-actin cell lines and traction force
microscopy was performed every 4 minutes for 2 hours, or every 220 ms for 4.5 minutes from 15 to 17 hours after block removal on a Nikon Eclipse Ti-E inverted microscope equipped with a spinning disc confocal unit (CSU-W1, Nikon), CFI Plan Apochromat VC 60XA 1.2NA water immersion objective (Nikon) and a Prime 95B sCMOS camera (Photometrics). Subsequently, the dishes were treated with SDS to kill the cells for acquisition of bead reference images.
Immunofluorescent stainings
Wild-type MDCK islands, 16 hours after the removal of migration blocks, were fixed with 4% PFA in 1X PBS for 10 minutes, permeabilised with 0.5% Triton X-100 in 1X PBS for 10 minutes, then incubated with blocking buffer, 5% BSA in PBS, for 30 minutes. Antibodies targeting paxillin (Y113, abcam, ab32084) or vimentin (abcam, ab8069) were used together with Alexa-488 conjugated secondary antibody targeting rabbit (Invitrogen, A11008) and mouse IgGs (Invitrogen, A11001), respectively. Actin cytoskeleton was visualized after staining with Alexa-568 labelled Phalloidin (Invitrogen, A12380). All antibodies were diluted in the blocking buffer. Between each step, the samples were rinsed 3 times with 1X PBS. Imaging was carried on with the Nikon spinning disc unit introduced in live cell imaging section, using CFI Plan Apochromat λ 100X 1.45NA oil immersion objective (Nikon), by taking the maximum intensity projection of 20 μm thick z-stacks consisting of 51 planes, which covered the full thickness of the monolayer on all stiffnesses except for 0.4kPa.
Image Analysis
Expansion areas were determined with an edge enhancement algorithm. Background images generated by Gaussian filtering bright field images, were subtracted from the original images, which were then put though Gaussian smoothing, and manually thresholded to obtain the areas of cell collectives. The quantification of leader cells at 16 hours was conducted manually by looking at images and counting the number of cells with prominent lamellipodia; cells where more than 50% of their free edge was a lamellipodium per island. Particle Image Velocimetry was calculated from consecutive bright field images with PIVlab40. Radial component was defined as
the dot product of the velocity vector with the unit vector pointing away from the centre of the island. The radial organization distance of velocity was calculated with linear fitting to the radial ratio of the velocity at distances of 50 to 200 μm from the boundary per island. Only fits where the conditions: a<0, 0.3<b<1 and R2 > 0.25 using equation y=ax +b
were considered. Nuclei were detected the same way as bright field analysis, with an additional watershed algorithm to segment individual nuclei. From nuclei images, cell regions were assigned by Voronoi segmentation.
Cell-matrix adhesions were identified using two Gaussian filtered images of the paxillin image, one with size of 5 pixels, another with 15 pixels (pixel size of 0.11 μm). Adhesions were defined as the 5 pixels filtered signal that was more than 1.2 times 15 pixels filtered signal and had an area larger than 0.18
μm2 and those that belonged to the manually defined leader
cell were quantified. For quantification of fluorescent intensity of actin and vimentin from the boundary, the boundary was obtained from a tissue mask defined as the signal that is 1/3rd
of the standard deviation more than the mean intensity of respective signals. The fluorescent intensity of vimentin under this mask was normalized to the mean intensity in the monolayer and quantified as a function of distance from its boundary. For bulk actin cable intensity, average actin fluorescent intensity under this mask within 1-5 μm from the boundary, excluding the region of leader cell manually defined, was divided to the average actin intensity of the monolayer. The order parameter corresponding to vimentin cytoskeleton was calculated using a custom-built MATLAB program, as previously described13. Briefly, the local orientation of
vimentin at each pixel was calculated from the local structure tensor of the corresponding image. The order parameter is calculated as S=cos2θ, where θ is defined as the angle between the local orientation and the mean orientation angle of the vimentin structure, and averaged weighted by the fluorescent intensity of the image.
For analysis of the lamellipodial actin flow, three lines of 200 pixels (37.2 μm) x 1 pixel (0.186 μm) per leading front were manually drawn, with about 30% of the line corresponding to the cell free region and kymographs were generated. The retrograde flow rate was calculated by manually obtaining the slope of the backward flowing actin from these kymographs. For calculation of the frequency and duration of lamellipodial retractions, the kymograph image was turned into a binary image with a threshold set at three tenths of the pixel intensities, resulting in a binary image where 70% of the image was allocated as foreground, and the frequency and duration of the events where the leading edge defined by this mask retracted more than 5 pixels (0.93 μm) were analysed. For traction force calculations, bead displacements (with respect to its resting state images after SDS treatment) acquired during experiments were measured with PIVlab40 and
converted to cell traction forces with an ImageJ plugin41. A PIV
interrogation window of size 64x64 pixel with an overlap of 50% was chosen for the detection of bead movement. The images were manually reoriented so that the direction of migration would be along the vertical axis while the direction perpendicular to the lamellipodial movement is along the horizontal direction. Temporal cross-correlation between magnitude of the traction forces perpendicular to the direction of migration (|Tx(t,x)|) and actin intensity (Iactin(t,x)) as a
function of τ (delay from |Tx(t,x)| to Iactin(t,x)) and x (location in
the horizontal axis) was calculated following the formula: ∑ (|T |(τ + t, x) −< |T |(t, x) > )(I (t, x)−< I (t, x) > ) ∑ (|T |(t, x)−< |T |(t, x) > ) ∑ (I (t, x)− < I (t, x) > )2
Results
Multicellular islands reach a maximum expansion at an intermediate stiffness
Previous works on collective cell migration on compliant substrates have been carried out with model wound assays,
ARTICLE Journal Name
4 | J. Name., 2012, 00, 1-3 This journal is © The Royal Society of Chemistry 20xx
Please do not adjust margins
where a cell free area was created next to a confluent layer through removal of a rectangular migration block29,42. These
works studied the migration of cells along a straight frontier at the long axis of the rectangle, and ignored expansion at the short axis, due to the semi-infinite approximation and high crowding of the cells. Here, we have seeded MDCK cells in 300
μm diameter islands by using PDMS migration blocks with circular openings and followed their expansion across several hours (Figure 1A). The circular symmetry allowed for the characterization of the behaviour of the whole island in an unbiased and reproducible fashion. Using this method, and live cell imaging, we studied the expansion of such islands on
Journal Name ARTICLE polyacrylamide gels of varying stiffness for 20 hours following
the removal of the stencil (Figure 1B, movie S1-3). All islands showed steady increase in their area (Figure 1C) and looking into the rate of area increase has shown that the islands gradually increased their expansion rate with increasing stiffness, 1270±200 (mean ± SEM), 4240±490, 7440±870, 9880±380 and 11580±470 μm2/h for 0.4, 6.5, 9.4, 21 and 33
kPa respectively, and dropped to 8520±370 μm2/h for 61k Pa
(Figure 1D). Of note is that, even though cell numbers increased for all stiffnesses and at similar rates for stiffnesses higher than 0.4 kPa (Figure 1E), the cell density only showed a downward trend for stiffnesses 9.4 kPa and higher (Figure 1F), suggesting the extension of the island edge was high enough to lead to a decreasing cell density overall only on stiffnesses higher than a certain threshold. Furthermore, studying the evolution of island circularity over time has shown that, for stiffnesses above 0.4 kPa the circularity of the cell monolayer gradually decreased with time (Figure 1G, movie S1-3). Quantifying the circularity at 16 hours has shown that the lowest circularity was observed at 33 kPa (Figure 1H). The temporal evolution of island area and circularity we observed for low to intermediate stiffnesses is reminiscent of reported collective cell behavior on substrates with varying amounts of ECM43. Thus, cell behavior on substrates with low ECM density
show similarities to that on soft substrates, i.e. lower expansion rate and higher circularity43, suggesting a similar
mechanism. Yet the highest expansion rate and lowest circularity, which we observed at an intermediate stiffness, was reported for highest ECM concentration. We next focused on this non-monotonic expansion over the range of stiffness tested.
The decrease in expansion speed on stiffest substrate is due to reduced directionality and cohesion
Since leader cells have been implicated in playing an important role in collective cell migration35,44, we started by quantifying
the number of leader cells as a function of substrate stiffness. We define leader cells as cells at the edge of islands that have “prominent lamellipodia”. These “cells with prominent lamellipodia” were manually identified as cells where more than 50% of their free edge was a lamellipodium (Figure 2A, red asterisk). We did not observe leader cells with lamellipodial protrusions on the soft matrices (0.4 kPa, Figure 2A, top panel) showing that soft surfaces prevent the extension of cellular protrusions from the colony as previously reported for single cell5. The number of leader cells per mm of
perimeter increased with increasing stiffness, reaching the maximum value of 7.1 per mm at 21 kPa, and reduced gradually for higher stiffness (Figure 2C, movie S2,3). Similar numbers of leader cells per mm and its inverse relation with increasing stiffness have been reported previously44. Here, we
additionally report that, at low stiffnesses, there is also a direct relation between the number of leader cells per mm and stiffness, indicating an optimal stiffness for leader cell formation.
Leader cell formation has been shown to be associated with the polarization of follower cells in the direction of the
leader45. Since the expansion of cellular colonies depends on
leader cell formation, we then studied the flows in the islands with Particle Image Velocimetry (PIV)21 (Figure 2B) and
observed monotonic increase in tissue velocity with increasing stiffness up to 8.7±0.2 μm/hr (mean ± SEM) for 61 kPa(Figure 2D) , which is in agreement with the values observed by others in expansion studies43,46,47. Interestingly the radial component
of the velocity, relating to the island expansion, reached a maximum value around 33 kPa (Figure 2E). Both the cell speed (Figure 2F) and the radial component of the velocity (Figure 2G) showed a maximum for 33 kPa (Figure 2H,I) in the region close to the boundary of the monolayer (50-100 μm). It should be noted that the decay of the velocity at the edge (0-50 μm) is a previously reported artefact of the PIV analysis48,49. Further
investigation into the spatial evolution of the PIV radial ratio, relating the radial component of the velocity (Figure 2G) to velocity magnitude (figure 2F), as a function of distance from the boundary, showed that the distance of radial organization of velocity gradually increased with increasing stiffness from 102±2 μm (mean±SEM) to 187±14 μm from 0.4 kPa to 33 kPa but dropped to 145±6 μm at 61 kPa (Figure 2J). This corresponded to an organization of 7.1±0.3 cells from the boundary on 0.4kPa, increasing with increasing stiffness up to 10.3±0.8 cells on 33kPa before dropping to 7.7±0.3 cells for 61kPa (Figure 2K). Together this shows that, with increasing stiffness in addition to the number of leader cells, the radial directionality in the monolayer increases until an intermediate stiffness, where increasing the stiffness further has the opposite effect.
Border cells take the lead in directing island expansion on all stiffnesses
To further investigate the relationship between substrate stiffness and MDCK colonies expansion, we studied the organization and the dynamics of peripheral and bulk cells. To do so, we performed a Voronoi segmentation based on the localization of the nuclei, to be able to study individual cells within colonies (Figure 3A). It should be noted that only a small percentage of peripheral cells are identified as leader cells (Figure 3B, 0±0%, 7.7±0.5%, 13.8±1.4% 18.5±0.8%, 15.4±0.6%, 12.7±0.5% mean ± SEM for 0.4, 6.5, 9.4, 21, 33 and 65 kPa respectively), and the stiffness dependence of this percentage was similar to the number of leader cells per mm perimeter (Figure 2C). Expanding our focus from leader cells to all the peripheral cells, we observed that independently of the stiffness, the average cell area was much higher at the boundary than in the bulk (Figure 3C). Moreover, the area of peripheral cells (n=1, corresponding to cells at the edge of the monolayer) increased with stiffness up to a plateau at 9.4 kPa, even showing a slight decrease on 61 kPa, whereas the area of cells in the rest of the monolayer (n=2+) increased with increasing stiffness until 9.4 kPa, plateaued till 21 kPa, showed a slight decrease at 33 kPa and increased again on 61kPa (Figure 3C). This suggests that the expansion of cellular colonies as a function of substrate stiffness is locally dictated by border cells. We then performed similar analysis for cell velocities. Consistent with velocity radial organization
ARTICLE Journal Name
6 | J. Name., 2012, 00, 1-3 This journal is © The Royal Society of Chemistry 20xx
Please do not adjust margins
spanning up to 10 rows of cells from the boundary (Figure 2K), the enhanced cell speed at the periphery, unlike cell size, was not limited to the boundary cells, but spanned multiple cell layers from the boundary. Therefore, we divided our analysis on cell velocities between the first three rows of cells from the boundary and the rest of the bulk. The cellular velocities of the first 3 rows of cells at the periphery of the islands increased with increasing stiffness from 3.6 μm/h to 9.9 μm/h until 33 kPa and it then appeared to saturate above this value (Figure 3D). For all stiffnesses, we consistently observed a large
difference in velocities between the first 3 rows of cells and the bulk even though the bulk velocity displayed an increase with increasing stiffness.
The stiffness dependence of boundary cells possibly relates to formation of finger-like structures, which do not appear on very soft substrates (0.4kPa). These can be seen as a local sensor of multicellular assemblies, like flipodia at the single cell level50. Moreover, our findings revealed that MDCK colonies
respond to substrate stiffness up to values around 20-30 kPa as shown by the monotonic increase of cell spreading and
Journal Name ARTICLE velocity of border cells up to this range of rigidities. Taken
together, these results show that the spreading and migration of epithelial colonies is largely dictated by border cells on all rigidities.
The cytoskeletal organization dictates collective cell migration Previous studies have shown that migration fingers form at the boundary of cell monolayers, behind leader cells which have prominent FAs35,42. In these fingers, high traction forces
generated by the leader cells, through regulation of RhoA activity, are conveyed to the monolayer by pluricellular peripheral acto-myosin contractile structures35. We thus
further investigated the effect of substrate stiffness on the leader cell FAs, and the multicellular actin cable formation in our model (Figure 4A). The FAs formed by the leader cells gradually increased in size from 0.4±0.8 μm2 to 0.6±0.6 μm2
with increasing stiffness from 0.4 kPa to 33 kPa and did not increase further in size on 61 kPa (Figure 4B). Yet, the actin filament spatial organization in the migration fingers did not show a dependence on substrate stiffness (data not shown). Studying instead the multicellular actin cables by quantifying the actin intensity at the finger boundary excluding the leader cell showed that the actin cable intensity followed a similar significant evolution to FA size (Figure 4C). These findings indicated that not the general actin organization but the formation of FAs and multicellular actin cable in these fingers were stiffness dependent in a similar manner to the monolayer expansion rates. We then wondered if intermediate filaments might play a role in stiffness dependent multicellular organization of these migration fingers. Since vimentin expression is known to be involved in changes of epithelial phenotypes51,52, we studied the spatial organization of the
vimentin filaments in our model (Figure 4D). In order to
capture the full extent of vimentin organization, we took maximum intensity projections of 20 μm thick z-stacks, which, despite the thickness of the monolayer increasing with decreasing stiffness (data not shown), were able to capture the full thickness of the monolayer on all stiffnesses except for on 0.4 kPa. Studying the vimentin immunostaining intensity as a function of distance from the boundary indicated that the amount of vimentin decreased away from the boundary on all stiffnesses (Figure 4E). We then looked into the organization of these vimentin structures by quantifying the local orientation of vimentin cables (Figure 4F) and relating this local orientation to overall orientation of vimentin in the migration finger to obtain a vimentin order parameter, S=cos2θ, where θ is the angle between the local orientation and the mean orientation angle of the vimentin structure, averaged weighted by the fluorescent intensity (Figure 4F). We found that the vimentin organization increased with increasing stiffness until 33 kPa, and showed a sudden decrease on 61 kPa (Figure 4G). These data show that, in addition to the FAs of the leader cell and the multicellular actin cable at the boundary, the organization of the vimentin filaments in the migration fingers also becomes more prominent with increasing stiffness up to 33 kPa.
Previous studies7,53,54 performed at the single cell level showed
that the increase of substrate stiffness and FA size were associated with reduced actin flows at the cell boundary as a result of an increase of frictional forces within the cell cytoplasm. Since we observed larger FAs underneath the leader cells and more prominent surrounding actin cables in the subsequent finger-like structure with increasing stiffness, we followed the same rationale as the one used for single cell studies. We thus analysed actin retrograde flows in the leader cells as a function of substrate stiffness and focused on the protrusion – retraction dynamics of the lamellipodia (Figure
ARTICLE Journal Name
8 | J. Name., 2012, 00, 1-3 This journal is © The Royal Society of Chemistry 20xx
Please do not adjust margins
5A). We chose two representative rigidities, 6.5 and 33 kPa, which exhibited large differences regarding the previous data we analysed. On softer substrates (6.5 kPa), the actin retrograde flow in the lamellipodial protrusions was indeed faster (Figure 5B) with more frequent retractions as observed in single cell5 (Figure 5C, D). Thus, our result showed that even
at the local scale of the leader cells, the impact of substrate stiffness can be perceived. This reinforced the concept of the role of finger-like structures and leader cells as a local
mechanical sensor of epithelial expansion.
Traction forces are decoupled from the migration behaviour To further determine the role of the mechanical regulation of colony expansion and leader cell formation by substrate stiffness, we quantified the traction forces in our system. We focused on migration fingers of islands of MDCK cells stably expressing GFP-actin seeded on gels with red fluorescent
Journal Name ARTICLE beads, imaged every 4 minutes from 15 hours to 17 hours
after the removal of the migration block (Figure 6A). The 0.4 kPa gels were not tested in this experiment since no cells with prominent lamellipodia were observed (Figure 2C). We studied the traction forces applied by these migration fingers (Figure 6B, C). Quantifying the forces applied perpendicular to the direction of motion (Tx, Figure 6B, C, first column) showed that,
similar to what has been reported on single stiffness of 7.8 kPa before35, a force dipole exists in this direction that persisted
for all stiffnesses tested. This force dipole is reminiscent of the emergence of actin cables (Figure 4A) on the lateral edges of finger-like protrusions. However, the force dipole amplitude reduced with increasing stiffness (Figure 6D). Similarly, forces in the direction of the movement (Ty, Figure 6B, C, second
column), while pointing inward on all stiffnesses, also decreased with increasing stiffness (Figure 6E). Consequently, the magnitude of the forces under the migration tip (Tmagnitude,
Figure 6B, C, third column) decreased with increasing stiffness
(Figure 6F). We then wondered how the force dipole would relate to the emergence of the actin cable. To study this, we looked into the temporal evolution of the magnitude of force in the x-direction (Tx_magnitude, relating to the magnitude of the
force dipole), and actin intensity on 6.5kPa and 33kPa substrates (Figure 6G) and their temporal cross-correlation (Figure 6H). We observed that the force build-up precedes the actin reinforcement on both 6.5kPa and 33kPa substrates, but the subsequent actin reinforcement leads to a reduction in forces only on 33kPa substrates (Figure 6H). These results could be attributed to changes in the shape of the multicellular protrusions as a function of substrate stiffness, where the release of local dipole tension along the width of the migration fingers would allow the migration finger to expand laterally, facilitating the migration of the rest of the monolayer. Indeed, on high stiffness, we observed more spread fingers with multiple leader cells at their front whereas a single leader cell was usually observed on softer surfaces.
ARTICLE Journal Name
10 | J. Name., 2012, 00, 1-3 This journal is © The Royal Society of Chemistry 20xx
Please do not adjust margins
Journal Name ARTICLE
Conclusions
The influence of the properties of the environment on the behaviour of cells was first established at a single-cell level. Of these external properties, the rigidity of the substrate is now well understood to be of critical importance55,56. In this
context, durotaxis—which usually describes the preferential migration of cells toward stiffer substrates— has been a very formative concept2. Nevertheless, even at the single-cell level,
the homeostasis between the cell and its substrate is not completely understood. For instance, gradients of rigidity can be counterbalanced by gradients of ECM proteins57, or
neurons can even exhibit preferential migration from rigid to soft58. Such extreme discrepancy is understood as stemming
from the softness characterising the physiological environment of neurons in vivo. Rather than systematically preferring stiffer substrates, cells most probably associate with substrates with an optimal stiffness depending on cell type. The relationship between stiffness and cell responses may depend on the type of cell and the type of response. For instance, how motile single-cell speed may depend on substrate stiffness may be different from the relationship between spreading area and stiffness for less motile cells59,60.
For collections of cells, the problem remains. A previous study on migration of large and dense monolayers has shown a front velocity increasing with substrate stiffness61 then levelling off
for substrates above 35 kPa. In their study, the authors also noticed that a few hundred micrometers behind the leading edge, the directed movement was higher at an intermediate stiffness. Here we have studied the expansion of MDCK cell islands consisting of 350±72 cells seeded in circular patterns of 300 μm diameter on substrates of varying rigidity and demonstrated highest expansion rates on substrates of intermediate stiffness. Thus, for monolayers, there also seems to be an optimum stiffness. How does the behaviour of the monolayer change for stiffness below and above this optimum is what we investigated by studying cells at the boundary of the island or within it.
For single cells, actin-rich formations at the cell edge—typically lamellipodia and filopodia—are not only essential for locomotion, but also as tools for cells to sense their environment. Early on, it has been shown that the dynamics of lamellipodia and their characteristic periodic contractions are qualitatively different on soft, intermediate and stiff substrates2. For single cells at low stiffness, lamellipodia
protrusions are reduced or absent. We find a similar phenotype for cells at the boundary of islands on soft substrates. As for single cells, the reduced protrusions are accompanied by a high retrograde flow. For intermediate stiffness, the lamellipodia of single cells do not show periodic contractions and protrusions are impaired by large ruffling events. Here, we also find ruffling events, but they do not seem to impair the motility of the collective, since the speed of the island edge is highest under these conditions. Finally, at high stiffness, we observe a decrease in the number of cells with lamellipodia at the island edge, concomitant with the decrease in island expansion speed. Similar impairment of single cell migration at high stiffness has also been reported60.
When the velocities of all cells within an island are integrated over, we do not see a clear optimum at intermediate stiffness. The speed keeps increasing, even if less steeply, up to the maximum stiffness of 61 kPa that we tested. Nonetheless, the radial expansion and the radial velocity both exhibit an optimum. Somehow, the increased motion of cells in the island is not efficiently translated into motion of the island edge at the highest substrate stiffness. Our experiments suggest that this may be connected to the differences in the formation of finger-like protrusions at the edge. These finger protrusions have been reported before, and have been associated with the concept of leader cells35,62,63. Rather than being smooth, the
edge of an island typically presents one or more fingers extending outward, a few cells wide and led by one or a few large cells with high lamellipodium activity. Generally, we find that cells are larger at the periphery of the island, where they are also faster. As the substrate stiffness increases, both the size of the cells at the edge and their speed increase up to the optimum. In contradiction to previous reports, which described an inverse relationship between the number of leader cells and the substrate stiffness44, we observe the
highest number of leader cells on intermediate stiffnesses. On softer substrates, there are fewer fingers at the edge, as reflected by a higher circularity of the islands.
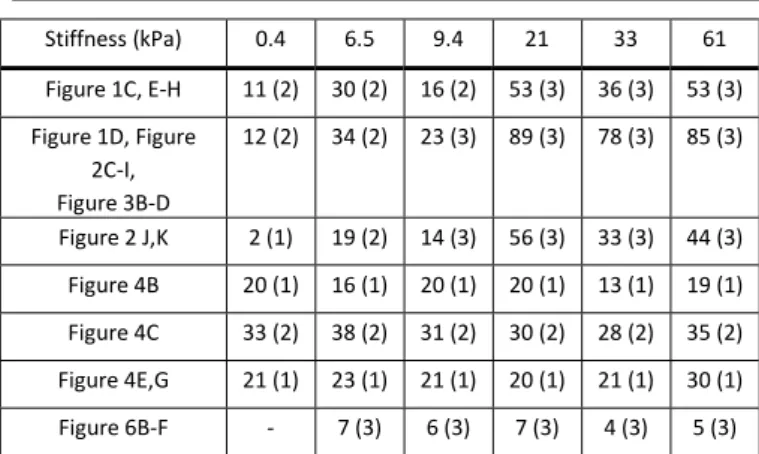
Building on the analogy between single cells and epithelial islands, the finger like protrusions of islands may serve a purpose similar to filopodia for single cells. Like filopodia, the finger protrusion may be used to explore the microenvironment, increasing the efficiency of the global migration of the epithelium front. The traction force microscopy we performed on the fingers revealed that, not unlike filopodia, the fingers are used to exert forces on the substrate, with a characteristic force pattern. Surprisingly, we found that the intensity of these forces are higher on soft substrates. Both the intensity of the force parallel to the finger long axis, and that of the force dipole perpendicular to it are Table 2 – Experiment statistics. The number of data points (and independent
experimental replicas) presented in indicated figures per stiffness.
Stiffness (kPa) 0.4 6.5 9.4 21 33 61 Figure 1C, E-H 11 (2) 30 (2) 16 (2) 53 (3) 36 (3) 53 (3) Figure 1D, Figure 2C-I, Figure 3B-D 12 (2) 34 (2) 23 (3) 89 (3) 78 (3) 85 (3) Figure 2 J,K 2 (1) 19 (2) 14 (3) 56 (3) 33 (3) 44 (3) Figure 4B 20 (1) 16 (1) 20 (1) 20 (1) 13 (1) 19 (1) Figure 4C 33 (2) 38 (2) 31 (2) 30 (2) 28 (2) 35 (2) Figure 4E,G 21 (1) 23 (1) 21 (1) 20 (1) 21 (1) 30 (1) Figure 6B-F - 7 (3) 6 (3) 7 (3) 4 (3) 5 (3)
ARTICLE Journal Name
12 | J. Name., 2012, 00, 1-3 This journal is © The Royal Society of Chemistry 20xx
Please do not adjust margins
smaller for stiffer substrates. On stiffer substrates, the fingers are wider, often more than a couple cells wide. For such large fingers, the curvature of the tip may bring counter-balancing forces yielding a force readout smaller than those for soft substrates, even if the force exerted by each single cell may be higher. Nevertheless, our experiments show that at the scale of the monolayer, high forces applied on soft substrates do not translate to higher expansion. It has been recognized for some time that a higher substrate stiffness lead to a higher friction, which in this context can act both in favor of motion or to slow it down64. Indeed, leader cells on intermediate stiffness, when
compared to 6.5 kPa, have less retrograde actin activity, suggesting higher induction of molecular clutch mechanism54,
subsequently translating to a higher expansion speed of the monolayer on this stiffness.
Differential mechanosensing machineries have been described depending on the relevant length scale65. While for single cells,
the cytoskeleton has been shown to be the dominant sensing mechanism12, for long scale sensing of cell collectives, a
cohesive monolayer is essential29 and in this aspect the
cell-cell adhesions take a central role29,66–68. Most surprisingly, our
experiments have shown that, if the size of the FAs does increase with stiffness, following the optimum in the island expansion speed, this does not translate into larger forces on the substrate at the scale of the finger-like protrusions. Some of the forces may be redistributed among cells. The cytokeleton has an important role both for leader cell and monolayer mechanosensing. With increasing stiffness higher pMLC levels and larger FAs in expanding monolayers have been reported61. For single cells, highest levels of actin
organization was observed at an intermediate stiffness10,69 For
the monolayers we study here, the actin organization is not significantly impacted by the stiffness of the substrate. In addition to FAs and the actin cytoskeleton, the intermediate filaments have also been shown to be important for tissue integrity70 and collective migration71. In this study we show
that the dependence of vimentin organization on substrate stiffness closely follows the relation of the expansion speed and its radial organization. This implicates that higher organization of vimentin filaments might facilitate collective cell migration through maintaining tissue integrity and cohesiveness.
Our findings here all point towards the most optimal conditions for expansion being achieved at an intermediate stiffness, where it is stiff enough for cell matrix adhesions to stabilize and overcome the monolayer tension, and soft enough for the flows in the bulk to not impair the cohesiveness and the movement of the leading edge. This biphasic dependence of collective cell behavior on stiffness has already been demonstrated for in vitro organ bud formation72,
embryonic cardiomyocytes function73 and tumor cell
invasion74,75. The impact of the biphasic mechanosensing on
epithelial cell mechanical memory76, in vivo durotaxis27 and
tissue homeostasis through extrusion38 remains to be tested.
Experiments performed on 3D cell aggregates of hundreds of microns diameter has shown that cell aggregates, which expand collectively on soft and stiff substrates, expand with higher speed as single cells on intermediate stiffness. The aggregate goes through a so called liquid-gas-liquid transitions as stiffness increases77,78, resulting in lower cohesiveness for
intermediate stiffnesses79 inducing symmetry breaking and
aggregate migration80. With our 2D MDCK islands, we did not
observe any cells breaking away from the islands, but we did observe a higher number of finger-like protrusions and leaders at intermediate stiffness. This suggests that in our case the cell-cell contact for intermediate stiffness was strong enough to maintain long-scale cohesive behavior. In 3D collagen cultures of tumor cells that showed such cohesive migration, branching morphology reminiscent of 2D migration fingers have been observed81, and distant mechanical signalling
related to such structures has been reported82. Additionally,
high stiffness has been shown to induce tumor invasiveness and such protrusions also in vivo83,84. Future studies in the field
will most likely shine some new light on the biphasic relation to stiffness of cohesiveness and the role of finger-like protrusions.
In conclusion, in this study, we show that even though cell speed within expending epithelial monolayer increases monotonously with increasing stiffness, the expansion of monolayer is hindered at high stiffness, possibly due to a loss of organization in the monolayer and a reduction in number of leader cells. Additionally on soft substrates, even though high forces were applied at the leading front of the monolayer, this did not translate to faster expansion. This was possibly due to the failure in the formation of stable cell-matrix adhesions at these high tensions on soft substrates to support the migration of the monolayer, as evident from higher incidence and speed of actin retractions. Altogether, our findings highlight the tug of war between cell-cell and cell-matrix adhesions, and similar to theoretical predictions of the molecular clutch model, indicate a goldilocks condition where cell-matrix adhesions are stable enough to support the monolayer expansion, but not too stable to impair the actin flow and thereby the collective movement. It remains to be established how our result would be altered by different initial conditions. Even regardless of the substrate stiffness, the initial density of the island or its geometry are known to have an impact on the expansion of the monolayer85,86. To that end, a few recent experiments on
the spreading of cell aggregates77,79,80 and on photo-activation
of the substrate around islands of various shapes46 are paving
the way toward a broader understanding of the homeostasis between cell collectives and their substrate.
Conflicts of interest
There are no conflicts to declare.
Journal Name ARTICLE We thank Delphine Delacour, Tianchi Chen, Pan Meng, Anh
Phuong Le, Shreyansh Jain and Thuan Beng Saw for useful scientific discussions, Minnah Thomas and Yusuke Toyama for the vimentin antibody and Chwee Teck Lim for facilitating AFM measurements. This work was supported by the Mechanobiology Institute, European Research Council under the European Union's Seventh Framework Programme (FP7/2007-2013) / ERC grant agreement numbers 617233 (B.L.), Agence Nationale de la Recherche (ANR) (“POLCAM" (ANR-17- CE13-0013), “CODECIDE” (ANR-17-CE-13-0022), “MechanoAdipo" ANR-17-CE13-0012)), the ANR Labex Who Am I?" (ANR-11-LABX-0071) and the Ligue Contre le Cancer (Equipe labellisée) are gratefully acknowledged. We acknowledge the Mechanobiology infrastructures. We thank Sree Vaishnavi and Gianluca Grenci (Micro fabrication Core Facility of Mechanobiology Institute).
Notes and references
1 W. Xi, T. B. Saw, D. Delacour, C. T. Lim and B. Ladoux, Nat. Rev. Mater., 2019, 4, 23–44.
2 C. M. Lo, H. B. Wang, M. Dembo and Y. L. Wang, Biophys. J., 2000, 79, 144–52.
3 A. J. Engler, M. A. Griffin, S. Sen, C. G. Bönnemann, H. L. Sweeney and D. E. Discher, J. Cell Biol., 2004, 166, 877– 887.
4 A. J. Engler, S. Sen, H. L. Sweeney and D. E. Discher, Cell, 2006, 126, 677–689.
5 G. Giannone, B. J. Dubin-Thaler, H.-G. Döbereiner, N. Kieffer, A. R. Bresnick and M. P. Sheetz, Cell, 2004, 116, 431–43.
6 S. V. Plotnikov, A. M. Pasapera, B. Sabass and C. M. Waterman, Cell, 2012, 151, 1513–1527.
7 A. Elosegui-Artola, R. Oria, Y. Chen, A. Kosmalska, C. Pérez-González, N. Castro, C. Zhu, X. Trepat and P. Roca-Cusachs, Nat. Cell Biol., 2016, 18, 540–548.
8 B. R. Sarangi, M. Gupta, B. L. Doss, N. Tissot, F. Lam, R.-M. Mège, N. Borghi and B. Ladoux, Nano Lett., 2017, 17, 399– 406.
9 H. Wolfenson, G. Meacci, S. Liu, M. R. Stachowiak, T. Iskratsch, S. Ghassemi, P. Roca-Cusachs, B. O’Shaughnessy, J. Hone and M. P. Sheetz, Nat. Cell Biol., 2016, 18, 33–42. 10 A. Zemel, F. Rehfeldt, A. E. X. Brown, D. E. Discher and S. A.
Safran, Nat. Phys., 2010, 6, 468–473.
11 D. Mitrossilis, J. Fouchard, D. Pereira, F. Postic, A. Richert, M. Saint-Jean and A. Asnacios, Proc. Natl. Acad. Sci. U. S. A., 2010, 107, 16518–23.
12 L. Trichet, J. Le Digabel, R. J. Hawkins, S. R. K. Vedula, M. Gupta, C. Ribrault, P. Hersen, R. Voituriez and B. Ladoux, Proc. Natl. Acad. Sci., 2012, 109, 6933–6938.
13 M. Gupta, B. R. Sarangi, J. Deschamps, Y. Nematbakhsh, A. Callan-Jones, F. Margadant, R.-M. Mège, C. T. Lim, R. Voituriez and B. Ladoux, Nat. Commun., 2015, 6, 7525. 14 T. Iskratsch, H. Wolfenson and M. P. Sheetz, Nat. Rev. Mol.
Cell Biol., 2014, 15, 825–33.
15 P. Roca-Cusachs, N. C. Gauthier, A. del Rio and M. P. Sheetz, Proc. Natl. Acad. Sci., 2009, 106, 16245–16250.
16 A. del Rio, R. Perez-Jimenez, R. Liu, P. Roca-Cusachs, J. M. Fernandez and M. P. Sheetz, Science, 2009, 323, 638–41. 17 G. Meacci, H. Wolfenson, S. Liu, M. R. Stachowiak, T.
Iskratsch, A. Mathur, S. Ghassemi, N. Gauthier, E. Tabdanov, J. Lohner, A. Gondarenko, A. C. Chander, P. Roca-Cusachs, B. O’Shaughnessy, J. Hone and M. P. Sheetz, Mol. Biol. Cell, 2016, 27, 3471–3479.
18 D. E. Koser, A. J. Thompson, S. K. Foster, A. Dwivedy, E. K. Pillai, G. K. Sheridan, H. Svoboda, M. Viana, L. da F. Costa, J. Guck, C. E. Holt and K. Franze, Nat. Neurosci., 2016, 19, 1592–1598.
19 B. Ladoux and R.-M. Mège, Nat. Rev. Mol. Cell Biol., 2017, 18, 743–757.
20 A. Szabó, M. Melchionda, G. Nastasi, M. L. Woods, S. Campo, R. Perris and R. Mayor, J. Cell Biol., 2016, 213, 543– 555.
21 S. R. K. Vedula, M. C. Leong, T. L. Lai, P. Hersen, A. J. Kabla, C. T. Lim and B. Ladoux, Proc. Natl. Acad. Sci., 2012, 109, 12974–12979.
22 J. K. Klarlund, Proc. Natl. Acad. Sci. U. S. A., 2012, 109, 15799–804.
23 T. Chen, A. Callan-Jones, E. Fedorov, A. Ravasio, A. Brugués, H. T. Ong, Y. Toyama, B. C. Low, X. Trepat, T. Shemesh, R. Voituriez and B. Ladoux, Nat. Phys., 2019, 15, 393–402. 24 A. Saez, M. Ghibaudo, A. Buguin, P. Silberzan and B.
Ladoux, Proc. Natl. Acad. Sci., 2007, 104, 8281–8286. 25 B. F. Matte, A. Kumar, J. K. Placone, V. G. Zanella, M. D.
Martins, A. J. Engler and M. L. Lamers, J. Cell Sci., 2019, 132, jcs224360.
26 S. He, C. Liu, X. Li, S. Ma, B. Huo and B. Ji, Biophys. J., 2015, 109, 489–500.
27 E. H. Barriga, K. Franze, G. Charras and R. Mayor, Nature, 2018, 554, 523–527.
28 M. Murrell, R. Kamm and P. Matsudaira, Biophys. J., 2011, 101, 297–306.
29 R. Sunyer, V. Conte, J. Escribano, A. Elosegui-Artola, A. Labernadie, L. Valon, D. Navajas, J. M. García-Aznar, J. J. Muñoz, P. Roca-Cusachs and X. Trepat, Science (80-. )., 2016, 353, 1157–1161.
30 A. Ravasio, I. Cheddadi, T. Chen, T. Pereira, H. T. Ong, C. Bertocchi, A. Brugues, A. Jacinto, A. J. Kabla, Y. Toyama, X. Trepat, N. Gov, L. Neves de Almeida and B. Ladoux, Nat. Commun., 2015, 6, 7683.
31 C. Pérez-González, R. Alert, C. Blanch-Mercader, M. Gómez-González, T. Kolodziej, E. Bazellieres, J. Casademunt and X. Trepat, Nat. Phys., 2019, 15, 79–88.
32 B. Ladoux, E. Anon, M. Lambert, A. Rabodzey, P. Hersen, A. Buguin, P. Silberzan and R.-M. Mège, Biophys. J., 2010, 98, 534–542.
33 S. Yonemura, Y. Wada, T. Watanabe, A. Nagafuchi and M. Shibata, Nat. Cell Biol., 2010, 12, 533–542.
34 Q. le Duc, Q. Shi, I. Blonk, A. Sonnenberg, N. Wang, D. Leckband and J. de Rooij, J. Cell Biol., 2010, 189, 1107–15. 35 M. Reffay, M. C. Parrini, O. Cochet-Escartin, B. Ladoux, A.
Buguin, S. Coscoy, F. Amblard, J. Camonis and P. Silberzan, Nat. Cell Biol., 2014, 16, 217–223.
36 R. Farooqui and G. Fenteany, J. Cell Sci., 2005, 118, 51–63. 37 C. Malinverno, S. Corallino, F. Giavazzi, M. Bergert, Q. Li, M.
ARTICLE Journal Name
14 | J. Name., 2012, 00, 1-3 This journal is © The Royal Society of Chemistry 20xx
Please do not adjust margins
Leoni, A. Disanza, E. Frittoli, A. Oldani, E. Martini, T. Lendenmann, G. Deflorian, G. V. Beznoussenko, D. Poulikakos, K. H. Ong, M. Uroz, X. Trepat, D. Parazzoli, P. Maiuri, W. Yu, A. Ferrari, R. Cerbino and G. Scita, Nat. Mater., 2017, 16, 587–596.
38 T. B. Saw, A. Doostmohammadi, V. Nier, L. Kocgozlu, S. Thampi, Y. Toyama, P. Marcq, C. T. Lim, J. M. Yeomans and B. Ladoux, Nature, 2017, 544, 212–216.
39 W. Xi, S. Sonam, T. Beng Saw, B. Ladoux and C. Teck Lim, Nat. Commun., 2017, 8, 1517.
40 W. Thielicke and E. J. Stamhuis, J. Open Res. Softw., , DOI:10.5334/jors.bl.
41 J.-L. Martiel, A. Leal, L. Kurzawa, M. Balland, I. Wang, T. Vignaud, Q. Tseng and M. Théry, in Methods in cell biology, 2015, vol. 125, pp. 269–287.
42 M. Poujade, E. Grasland-Mongrain, A. Hertzog, J. Jouanneau, P. Chavrier, B. Ladoux, A. Buguin and P. Silberzan, Proc. Natl. Acad. Sci., 2007, 104, 15988–15993. 43 A. Ravasio, A. P. Le, T. B. Saw, V. Tarle, H. T. Ong, C.
Bertocchi, R.-M. Mège, C. T. Lim, N. S. Gov and B. Ladoux, Integr. Biol., 2015, 7, 1228–1241.
44 M. Vishwakarma, J. Di Russo, D. Probst, U. S. Schwarz, T. Das and J. P. Spatz, Nat. Commun., 2018, 9, 3469. 45 L. Petitjean, M. Reffay, E. Grasland-Mongrain, M. Poujade,
B. Ladoux, A. Buguin and P. Silberzan, Biophys. J., 2010, 98, 1790–1800.
46 M. Kamimura, M. Sugawara, S. Yamamoto, K. Yamaguchi and J. Nakanishi, Biomater. Sci., 2016, 4, 933–937. 47 X. Serra-Picamal, V. Conte, R. Vincent, E. Anon, D. T.
Tambe, E. Bazellieres, J. P. Butler, J. J. Fredberg and X. Trepat, Nat. Phys., 2012, 8, 628–634.
48 X. Trepat, M. R. Wasserman, T. E. Angelini, E. Millet, D. A. Weitz, J. P. Butler and J. J. Fredberg, Nat. Phys., 2009, 5, 426–430.
49 C. Blanch-Mercader, R. Vincent, E. Bazellières, X. Serra-Picamal, X. Trepat and J. Casademunt, Soft Matter, 2017, 13, 1235–1243.
50 S. Wong, W.-H. Guo and Y.-L. Wang, Proc. Natl. Acad. Sci. U. S. A., 2014, 111, 17176–81.
51 C. Leduc and S. Etienne-Manneville, Curr. Opin. Cell Biol., 2015, 32, 102–112.
52 A. S. Menko, B. M. Bleaken, A. A. Libowitz, L. Zhang, M. A. Stepp and J. L. Walker, Mol. Biol. Cell, 2014, 25, 776–790. 53 C. E. Chan and D. J. Odde, Science (80-. )., 2008, 322, 1687–
1691.
54 A. Elosegui-Artola, E. Bazellières, M. D. Allen, I. Andreu, R. Oria, R. Sunyer, J. J. Gomm, J. F. Marshall, J. L. Jones, X. Trepat and P. Roca-Cusachs, Nat. Mater., 2014, 13, 631– 637.
55 S. R. Peyton and A. J. Putnam, J. Cell. Physiol., 2005, 204, 198–209.
56 K. M. Stroka and H. Aranda-Espinoza, Cell Motil. Cytoskeleton, 2009, 66, 328–341.
57 G. Jain, A. J. Ford and P. Rajagopalan, ACS Biomater. Sci. Eng., 2015, 1, 621–631.
58 P. C. Georges, W. J. Miller, D. F. Meaney, E. S. Sawyer and P. A. Janmey, Biophys. J., 2006, 90, 3012–3018.
59 T. Yeung, P. C. Georges, L. A. Flanagan, B. Marg, M. Ortiz,
M. Funaki, N. Zahir, W. Ming, V. Weaver and P. A. Janmey, Cell Motil. Cytoskeleton, 2005, 60, 24–34.
60 B. L. Bangasser, G. A. Shamsan, C. E. Chan, K. N. Opoku, E. Tüzel, B. W. Schlichtmann, J. A. Kasim, B. J. Fuller, B. R. McCullough, S. S. Rosenfeld and D. J. Odde, Nat. Commun., 2017, 8, 15313.
61 M. R. Ng, A. Besser, G. Danuser and J. S. Brugge, J. Cell Biol., 2012, 199, 545–563.
62 N. Yamaguchi, T. Mizutani, K. Kawabata and H. Haga, Sci. Rep., 2015, 5, 7656.
63 R. Mayor and S. Etienne-Manneville, Nat. Rev. Mol. Cell Biol., 2016, 17, 97–109.
64 S. P. Palecek, J. C. Loftus, M. H. Ginsberg, D. A.
Lauffenburger and A. F. Horwitz, Nature, 1997, 385, 537– 540.
65 X. Trepat and E. Sahai, Nat. Phys., 2018, 14, 671–682. 66 A. A. Khalil and J. de Rooij, Exp. Cell Res., 2019, 376, 86–91. 67 E. Bazellières, V. Conte, A. Elosegui-Artola, X.
Serra-Picamal, M. Bintanel-Morcillo, P. Roca-Cusachs, J. J. Muñoz, M. Sales-Pardo, R. Guimerà and X. Trepat, Cell Biol. Nat Cell Biol, 2015, 17, 409–420.
68 R. Seddiki, G. H. N. S. Narayana, P.-O. Strale, H. E. Balcioglu, G. Peyret, M. Yao, A. P. Le, C. Teck Lim, J. Yan, B. Ladoux and R. M. Mège, Mol. Biol. Cell, 2018, 29, 380–388. 69 J. Solon, I. Levental, K. Sengupta, P. C. Georges and P. A.
Janmey, Biophys. J., 2007, 93, 4453–4461.
70 E. Latorre, S. Kale, L. Casares, M. Gómez-González, M. Uroz, L. Valon, R. V. Nair, E. Garreta, N. Montserrat, A. del Campo, B. Ladoux, M. Arroyo and X. Trepat, Nature, 2018, 563, 203–208.
71 C. De Pascalis, C. Pérez-González, S. Seetharaman, B. Boëda, B. Vianay, M. Burute, C. Leduc, N. Borghi, X. Trepat and S. Etienne-Manneville, J. Cell Biol., 2018, 217, 3031– 3044.
72 T. Takebe, M. Enomura, E. Yoshizawa, M. Kimura, H. Koike, Y. Ueno, T. Matsuzaki, T. Yamazaki, T. Toyohara, K. Osafune, H. Nakauchi, H. Y. Yoshikawa and H. Taniguchi, Cell Stem Cell, 2015, 16, 556–565.
73 A. J. Engler, C. Carag-Krieger, C. P. Johnson, M. Raab, H.-Y. Tang, D. W. Speicher, J. W. Sanger, J. M. Sanger and D. E. Discher, J. Cell Sci., 2008, 121, 3794–3802.
74 F. Broders-Bondon, T. H. N. Ho-Bouldoires, M. E. Fernandez-Sanchez and E. Farge, J. Cell Biol., 2018, 217, 1571–1587.
75 Y. Peng, Z. Chen, Y. Chen, S. Li, Y. Jiang, H. Yang, C. Wu, F. You, C. Zheng, J. Zhu, Y. Tan, X. Qin and Y. Liu, Acta Biomater., 2019, 88, 86–101.
76 S. Nasrollahi, C. Walter, A. J. Loza, G. V. Schimizzi, G. D. Longmore and A. Pathak, Biomaterials, 2017, 146, 146– 155.
77 S. Douezan, J. Dumond and F. Brochard-Wyart, Soft Matter, 2012, 8, 4578–4583.
78 G. Beaune, G. Duclos, N. Khalifat, T. V. Stirbat, D. M. Vignjevic and F. Brochard-Wyart, Soft Matter, 2017, 13, 8474–8482.
79 G. Beaune, T. V. Stirbat, N. Khalifat, O. Cochet-Escartin, S. Garcia, V. V. Gurchenkov, M. P. Murrell, S. Dufour, D. Cuvelier and F. Brochard-Wyart, Proc. Natl. Acad. Sci.,
Journal Name ARTICLE 2014, 111, 8055–8060.
80 G. Beaune, C. Blanch-Mercader, S. Douezan, J. Dumond, D. Gonzalez-Rodriguez, D. Cuvelier, T. Ondarçuhu, P. Sens, S. Dufour, M. P. Murrell and F. Brochard-Wyart, Proc. Natl. Acad. Sci., 2018, 115, 12926–12931.
81 H. H. Truong, J. Xiong, V. P. S. Ghotra, E. Nirmala, L. Haazen, S. E. Le Dévédec, H. E. Balcioğlu, S. He, B. E. E. Snaar-Jagalska, E. Vreugdenhil, J. H. N. Meerman, B. van de Water and E. H. J. Danen, Sci. Signal., 2014, 7, ra15. 82 H. E. Balcioglu, B. van de Water and E. H. J. Danen, Sci.
Rep., 2016, 6, 22580.
83 K. R. Levental, H. Yu, L. Kass, J. N. Lakins, M. Egeblad, J. T. Erler, S. F. T. Fong, K. Csiszar, A. Giaccia, W. Weninger, M. Yamauchi, D. L. Gasser and V. M. Weaver, Cell, 2009, 139, 891–906.
84 M. J. Paszek, N. Zahir, K. R. Johnson, J. N. Lakins, G. I. Rozenberg, A. Gefen, C. A. Reinhart-King, S. S. Margulies, M. Dembo, D. Boettiger, D. A. Hammer and V. M. Weaver, Cancer Cell, 2005, 8, 241–254.
85 S. Tlili, E. Gauquelin, B. Li, O. Cardoso, B. Ladoux, H. Delanoë-Ayari and F. Graner, R. Soc. Open Sci., 2018, 5, 172421.
86 E. Gauquelin, S. Tlili, C. Gay, G. Peyret, R. M. Mège, M. A. Fardin and B. Ladoux, Soft Matter, 2019, 15, 2798–2810.