Computational epigenomics: gene regulation,
comparative methodologies, and epigenetic patterns
by
Angela Yen
B.S., Massachusetts Institute of Technology (2010)
M.Eng., Massachusetts Institute of Technology (2011)
Submitted to the Department of Electrical Engineering and Computer
Science
in partial fulfillment of the requirements for the degree of
Doctor of Philosophy
at the
MASSACHUSETTS INSTITUTE OF TECHNOLOGY
June 2016
c
○ Massachusetts Institute of Technology 2016. All rights reserved.
Author . . . .
Department of Electrical Engineering and Computer Science
May 19, 2016
Certified by . . . .
Manolis Kellis
Professor
Thesis Supervisor
Accepted by . . . .
Leslie A. Kolodziejski
Chair, Department Committee on Graduate Students
Computational epigenomics: gene regulation, comparative
methodologies, and epigenetic patterns
by
Angela Yen
Submitted to the Department of Electrical Engineering and Computer Science on May 19, 2016, in partial fulfillment of the
requirements for the degree of Doctor of Philosophy
Abstract
One of the fundamental aims of biology is to determine what lies at the root of differ-ences across individuals, species, diseases, and cell types. Furthermore, the sequencing of genomes has revolutionized the ways in which scientists can investigate biological processes and disease pathways; new genome-wide, high-throughput experiments re-quire computer scientists with a biological understanding to analyze and interpret the data to improve our understanding about life science. This provides us with a key opportunity to use computational techniques for new biological discoveries.
While genetic variation plays an important role in influence phenotype, sequence alone cannot account for all differences: for example, different types of cells in an individual have varying function and attributes, but identical genetic makeup. This highlights the importance of studying epigenetic changes, which are dynamic chemical changes to and around the DNA. While the DNA of every cell in an individual is the same, the epigenetic context for that DNA varies from cell to cell. In this way, these epigenetic differences play a crucial role in gene regulation, with epigenetic changes both causing and recording regulatory mechanisms.
In this thesis, we combine the power of computational, statistical, and data sci-ence approaches with the new wave of epigenetic data at a genome-wide level in a number of ways. First, in chapter 2, we demonstrate the importance of computational analysis at an epigenomic level by identifying an epigenomic signature of the olfactory receptor gene family that gives insight into the mechanism behind monogenic gene regulation. Next, in chapter 3, we explain our development of ChromDiff, a novel statistical and information theoretic computational methodology to identify chro-matin state differences in groups of samples. In our methodology, we use correction for external covariates to isolate the relevant signal, and as a result, we find that our method outperforms existing computational methods, with further validation through randomized simulations. In chapter 4, we apply our methodology to characteristics including sex, developmental age, and tissue type, we unveil relevant chromatin states and genes that distinguish the groups of epigenomes, with further validation of our
results through differential expression analysis and gene set enrichment. In chap-ter 5, we show the power of integrative analysis through the combination of DNA methylation data with chromatin state profiles, cell types, sample groups, experimen-tal technologies, and histone mark data to reveal insightful epigenetic patterns and relationships. Finally, in chapter 6, we identify "hidden" or "unknown" covariates in epigenomic data by using agnostic principal component analysis on our samples to discover similarities between our known covariates and the identified components.
In summation, our research highlights the importance of both algorithm develop-ment and method application for epigenomic questions, reaffirming the importance of interdisciplinary research that brings together cutting-edge techniques in computer science with appropriate biological hypotheses and data. While questions and analysis must be carefully paired in an informed manner to produce meaningful, interpretable, and believable results in computational biology, our work here provides a sampling of the vast potential for scientific discovery at the intersection of the fields of computer science and biology.
Thesis Supervisor: Manolis Kellis Title: Professor
Acknowledgments
My thesis research would not have been possible without the help of many people. Firstly, thanks to my research advisor, Manolis Kellis, for guiding me on the path to becoming an independent researcher; your support and encouragement has been invaluable at every step of the way. I would also like to thank Pardis Sabeti and Bonnie Berger, who were both thesis committee members and rotation supervisors; your mentorship and feedback was much appreciated throughout graduate school. Similarly, thanks to Nancy Lynch and David Gifford, who served as my Research Qualifying Exam committee: your perspectives were helpful to my research as well.
Additionally, this work has largely been the product of many collaborations. To Stavros Lomvardas, Angeliki Magklara, and Eleanor J. Clowney: thank you for your patience and guidance throughout the olfactory regulation project and our other collaborations; Stavros, your unfailing support and encouragement has also been much appreciated. Thank you to all our Epigenome Roadmap collaborators, especially Misha Bilenky, as well as Daniel MacArthur and Taru Tukiainen for the fun and interesting collaboration on X chromosome escape genes.
I also can not overstate how much I have learned from my labmates over the years. Some of the many past and present Kellis Lab members I must especially thank in-clude Wouter Meuleman for your mentorship and friendship over the years; Bob Altshuler for your support and advice; Pouya Kheradpour and Gerald Quon for your ever insightful research feedback; Lucas Ward for your guidance and patience; Richard Cowper-Sallari for your optimism and encouragement; Abhishek Sarkar, Xinchen Wang, and Kunal Bhutani for being wonderful officemates (with snacks, tea, and Atlas!); Anshul Kundaje for your insightful help and generous spirit; Khoi Nguyen, Irwin Jungreis, and Max Wolf for your help with thesis preparations; Jianrong Wang for your help with enhancer linking; and Jason Ernst, for your epigenomics expertise. Thank you to the various funding sources that have supported my graduate re-search, including grants through my advisor, Manolis Kellis, as well as the Siebel Scholarship and the NSF Graduate Research Fellowship Program.
Lastly, I would like to thank my family and friends, who I feel played perhaps the most critical role in supporting me throughout graduate school. To my husband, Gabriel, I am more thankful to you than you will ever know; thank you for always believing in me, lifting me up through the hard times, and celebrating with me through the good times. I owe a huge thanks to my parents: Mom and Dad, I will never be able to repay you for all the love, sacrifice, support, and encouragement you have given me throughout my life, but please know that I will always appreciate everything that you have done for me. To Phil, thank you for being not only my brother but my longest friend; it means a lot to know that I can always count on you for encouragement, love, and support. To Carlos, Clemencia, and Ana: thank you for welcoming me into your family with open arms; I feel lucky to be a part of your family. To my friends: there are not enough words for me to say what all of you mean to me, but I feel ever grateful to be friends with such good, caring, loving, funny, joy-filled, intelligent, supportive, genuine, and hilarious people; special thanks go out to Simone, Lindsay, Kent, May, Cathy, Michael, Dustin, Sara, Manasi, and Becca for your patience in dealing with my grad school struggles and problems. Lastly, I must thank my dog, Atlas: you are the best graduate school companion anyone could have asked for; I will miss spending every day with you at the office, but all things must come to an end...
Contents
1 Introduction 21
1.1 Motivation . . . 21
1.2 Background . . . 23
1.2.1 Gene expression: central dogma of molecular biology . . . 23
1.2.2 Regulation of gene expression . . . 25
1.2.3 Functional and regulatory regions . . . 26
1.2.4 Epigenetic state and modifications . . . 27
1.2.5 Epigenetic variation . . . 30
1.2.6 Human biology and model organisms . . . 30
1.3 Relevant experimental methods . . . 31
1.3.1 DNA sequencing and mapping . . . 31
1.3.2 Genotyping . . . 32
1.3.3 Chromatin immunoprecipitation . . . 35
1.3.4 DNA methylation profiling . . . 35
1.3.5 Transcriptome sequencing . . . 38
1.3.6 DNA footprinting . . . 39
1.4 Summary of research contributions . . . 40
1.4.1 An epigenomic mechanism for gene family regulation . . . 40
1.4.2 A genome-wide computational method for group-wise chromatin state comparisons . . . 42
1.4.3 Epigenomic insights from comparisons based on development age, sex, and tissue type. . . 43
1.4.4 Integrative analysis of DNA methylation data across chromatin
state, gene expression, platform, and celltypes. . . 44
1.4.5 Identification of unknown covariates in epigenomic samples with mutual information analysis against true covariates. . . 45
2 An epigenomic mechanism for regulation of the olfactory receptor gene family 47 2.1 Introduction . . . 48
2.1.1 Problem Statement . . . 48
2.1.2 Background and previous work . . . 48
2.1.3 Approach . . . 50
2.2 Computational methods . . . 51
2.2.1 Data processing, normalization, and quality control . . . 51
2.2.2 Detection of heterochomatic domains . . . 53
2.2.3 Clustering and ranking of genes . . . 56
2.3 Results . . . 58
2.3.1 Quality controls . . . 58
2.3.2 Whole-genome analysis of H3K9me3 and H4K20me3 in olfac-tory epithelial tissue . . . 59
2.3.3 Heterochromatic signature for chemoreceptors . . . 62
2.3.4 Heterochromatic macrodomains cover OR clusters . . . 64
2.3.5 Further experimental validation . . . 70
2.4 Contributions . . . 78
3 A computational method for chromatin state comparisons across groups of epigenomes 81 3.1 Introduction . . . 82
3.1.1 Problem Statement . . . 82
3.1.2 Background and previous work . . . 83
3.1.3 Approach . . . 84
3.2.1 Overview of comparison of epigenomic features . . . 85
3.2.2 Chromatin state annotations . . . 90
3.2.3 Information theoretic representation of raw feature values . . . 90
3.2.4 Gene annotations . . . 92
3.2.5 Covariate correction of ChromDiff feature values . . . 93
3.2.6 Group-wise comparison statistics . . . 94
3.2.7 Gene set enrichment calculations . . . 95
3.2.8 Expression data analysis . . . 97
3.2.9 Randomized simulations . . . 98
3.3 Results . . . 99
3.3.1 Identified genes are enriched for differential expression . . . . 99
3.3.2 ChromDiff outperforms other method for epigenomic comparison102 3.3.3 ChromDiff identifies relevant genes and chromatin states inde-pendent of gene size and chromatin state. . . 107
3.3.4 Regulatory ChromDiff identifies additional and new genes when studying linked enhancers and regulatory regions. . . 109
3.4 Software download . . . 111
3.5 Contributions . . . 111
4 Comparisons of epigenomes reveal distinguishing chromatin states and genes 113 4.1 Introduction . . . 113
4.2 Methods . . . 114
4.2.1 Gene cluster identification . . . 114
4.2.2 Sampling distinguishing features . . . 114
4.2.3 Sampling significant distinguishing genes . . . 114
4.2.4 Ordering of rows or columns . . . 115
4.2.5 Dominant (most abundant) chromatin state heatmaps . . . 115
4.2.6 Gene expression heatmaps . . . 115
4.2.8 Sex-based chromatin state enrichment . . . 117
4.2.9 Violin plots for chromatin state coverage . . . 117
4.3 Results . . . 118
4.3.1 Overview . . . 118
4.3.2 Epigenetic sex differences consistent with X Chromosome inac-tivation . . . 118
4.3.3 Active chromatin states are enriched on genes that escape ChrX inactivation, while repressive chromatin states are enriched on inactive genes. . . 120
4.3.4 Comparison of brain and gastrointestinal tissues reveal epige-nomic changes in neuronal genes . . . 126
4.3.5 Blood samples distinguished by enhancer activity differences . 130 4.3.6 Comparison of samples based on developmental ages link to cancer genes . . . 135
4.3.7 ChromDiff identifies changes at linked enhancers based on tis-sue type. . . 140
4.3.8 Studying chromatin state changes at both enhancers and DNase hypersensitive sites identifies ChrX genes. . . 142
4.3.9 Subtypes of blood samples highlight enhancer differences. . . . 144
5 Integrative analysis of Roadmap Epigenomics data 149 5.1 Introduction . . . 149
5.2 Methods . . . 150
5.2.1 Data processing of RNA-seq, ChIP-seq, and DNase-seq . . . . 150
5.2.2 Data processing of DNA methylation data . . . 151
5.2.3 Chromatin state learning . . . 151
5.2.4 Relationship between chromatin states and methylation. . . . 152
5.2.5 Generating randomized simulations of methylation profiles. . . 152
5.2.6 Calculating significant differences in simulated vs real data. . . 153
5.2.8 Comparison of DNA methylation platforms . . . 154
5.3 Results . . . 154
5.3.1 Relationship between DNA methylation and chromatin states 154 5.3.2 DNA Methylation profiles for chromatin states across epigenomes157 5.3.3 Comparison of DNA methylation platforms . . . 162
5.3.4 Clustering of celltypes based on pairwise epigenomic similarity. 171 6 Identification of unknown covariates in epigenomic data with com-parisons to known metadata 175 6.0.1 Introduction . . . 175
6.1 Methods . . . 177
6.1.1 Representation of each epigenome . . . 177
6.1.2 Principal component analysis . . . 178
6.1.3 Mutual information between principal components and covariates180 6.2 Results . . . 182
6.2.1 Principal component analysis with gene body representation . 182 6.2.2 Linked regulatory region analysis . . . 188
7 Conclusion 197 7.1 Summary of results . . . 198
List of Figures
1-1 The central dogma of molecular biology states that DNA is transcribed
into RNA, which is then translated into proteins.1 . . . . 22
1-2 Epigenetic modifications include methylation of the DNA strand (left) and chemical modifications to the tails of the histone proteins (right).2 23 1-3 RNA Polymerase reads the nucleotides of one strand of the DNA to produce the complementary RNA in a process known as transcription.3 24 1-4 The process of translation reads mRNA to assemble a chain of amino acids to form a protein.4 . . . 25
1-5 Triplets of mRNA nucleotides act as codons to map to amino acids.5 25 1-6 Illustration of functional and regulatory genomic elements. . . 27
1-7 A nucleosome is made up of 8 histone proteins and has DNA wrapped around it. The combination of the DNA and the nucleosome is called chromatin.6 . . . 29
1-8 Mapping sequenced reads of DNA. . . 32
1-9 De novo assembly of reads of DNA. . . 33
1-10 Explanation of allele-specific oligonucleotides. . . 34
1-11 Explanation of Chromatin Immunoprecipitation. . . 36
1-12 Bisulfite-sequencing-based experimental techniques directly measure methylated CpG sites in the genome. . . 37
1-13 RNA-sequencing technology measures gene expression. . . 38
2-1 This figure demonstrates the sliding window algorithm with an example window of size 4. . . 54
2-2 Hidden Markov Models are composed of hidden states (circles X1, X2, X3), observed emissions (squares y1, y2, y3, y4), transition
probabili-ties (a arrows), and emission probabiliprobabili-ties (b arrows).7 . . . 55
2-3 Explanation of k-means clustering. . . 57
2-4 Quality check plots reveal data relatively normal data devoid of bias. 59
2-5 Genome-wide mapping of H3K9me3 and H4K20me3 reveal a
tissue-dependent heterochromatinization of the ORs in the mouse olfactory
epithelium (MOE). . . 61
2-6 Unsupervised clustering of chromosome 2 genes. . . 62
2-7 Olfactory receptor genes have strongest H3K9me3 and H4K20me3 signal. 64
2-8 Comparison of blocks identified with the LOCKS protocol (top blue
row) and the MA2C protocol (lower blue row) reveals similar macrodomains. 66
2-9 Part of a cluster of OR genes overlaps peaks and blocks of H3K9me3
and H4K20me3 in OE. . . 67
2-10 H3K9me3 and H4K20me3 is highly present at OR genes in the OR cluster in MOE (but not liver), but not beyond the OR cluster, based
on ChIP-qPCR. . . 68
2-11 Part of a silenced OR cluster on chromosome 11 is interrupted by a
small group of transcriptionally active non-OR genes. . . 69
2-12 The ORs acquire a highly compacted chromatin structure in the MOE. 71
2-13 OR silencing occurs independent of and developmentally prior to OR
expression. . . 72
2-14 The active OR allele is not enriched for H3K9me3 or H4K20me3, but
it is marked with H3K4me3. . . 75
2-15 Tissue-Specific OR Modifications Are Associated with OR-like
Trans-gene Expression. . . 77
2-16 Previous model and proposed new model for olfactory gene regulation. 78
3-2 Leveraging linked regulatory regions for identification of epigenomic
differences at relevant regulatory regions across groups. . . 91
3-3 Even with the conservative Benjamini-Yekuteli multiple hypothesis
correction, we still identify significantly different features and genes
in 7 of 12 cases. . . 96
3-4 Epigenomically distinguishing genes are enriched for differential
ex-pression. . . 100
3-5 ChromDiff outperforms dPCA in identification of comparison-specific
genes. . . 105
3-6 ChromDiff identifies more specific results than dPCA. . . 106
3-7 A variety of chromatin states are identified in simulations and
appli-cations. . . 107
3-8 Genes of various sizes are identified in randomized simulations, while
longer genes are identified in biological comparisons. . . 108
3-9 Regulatory ChromDiff identifies new genes when using promoters, linked
enhancers, and linked DNase Hypersensitive sites, compared to the
gene body approach. . . 110
3-10 Proportion of distinguishing genes identified by Regulatory ChromDiff with a) promoters, b) enhancers, and c) DNase Hypersensitive regions,
compared to the gene body ChromDiff approach. . . 110
4-1 X chromosome inactivation distinguishes male and female samples. . . 119
4-2 Distinguishing autosomal genes are associated with changes in bivalent
and enhancer regions. . . 121
4-3 Number of escape, inactive, and variable genes on the X chromosome. 122
4-4 Comparison of chromatin state coverage at escape genes and inactive
genes reveals distinctive chromatin state biases. . . 123
4-5 Active flanking promoter, transcribed, weakly transcribed, and
en-hancer chromatin states enriched in escape genes compared to inactive
4-6 Heterochromatic, bivalent promoter, and polycomb repressed
chro-matin states are enriched in inactive genes compared to escape genes. 125
4-7 Comparison of chromatin state coverage at ChrX genes in female and
male samples reveals chromatin state patterns consistent with X
chrom-some inactivation. . . 127
4-8 Transcriptional differences dominate brain and GI tissue comparison. 128
4-9 Brain and gastrointestinal differences reveal changing chromatin state
differences in gene clusters. . . 129
4-10 Epigenomic differences specific to blood samples lie at blood cancer
genes. . . 134
4-11 Polycomb targets distinguish adult and fetal samples. . . 138
4-12 Many genes exhibiting changes between adult and fetal samples are
only associated with one chromatin state. . . 139
4-13 Differences at brain and digestive in linked enhancer activity identify genes with differential expression that relate to neuronal development. 143 4-14 Differences in polycomb repression and heterochromatin is identified at
DNase hypersensitive sites linked to ChrX genes in a sex-based
com-parison. . . 145
4-15 Epigenomic changes at linked enhancers identify celltype-specific gene
expression and genes. . . 147
5-1 Chromatin states and DNA methylation dynamics. . . 152
5-2 DNA methylation values at chromatin state regions in 15-state model. 155
5-3 DNA methylation of real chromatin state compared to background
regions. . . 156
5-4 DNA methylation profiles of chromatin states across celltypes. . . 159
5-5 Across celltypes, promoter and bivalent regions are methylated most
differently from background, while quiescent and polycomb repressed regions most frequently have DNA methylation similar to background. 160
5-6 Distribution of DNA methylation values for each chromatin state based
on sample group. . . 161
5-7 Real and simulated distribution of DNA methylation values for each
chromatin state in the IMR90 feta llung fibroblasts cell line. . . 163
5-8 Comparison of DNA methylation technologies RRBS and SBS. . . 165
5-9 Comparison of DNA methylation technologies SBS and mCRF. . . . 167
5-10 Comparison of DNA methylation technologies RRBS and mCRF. . . 168
5-11 DNA methylation levels in 15-state model across technologies. . . 170
5-12 Distribution of DNA methylation values for each chromatin state based
on sample group and experimental technology. . . 171
5-13 DNA methylation at enhancer modules across celltypes. . . 172
5-14 Similarity between epigenomes based on histone mark presence in
en-hancer regions. . . 174
6-1 Illustration of dimension reduction with principal component analysis. 178
6-2 Illustration of singular value decomposition. . . 179
6-3 Top principal components of epigenomes based on gene body features. 183
6-4 Variance and pair-wise projections of principal components. . . 184
6-5 Mutual information reveals structure between principal components
and covariates. . . 189
6-6 Principal component analysis applied to epigenomes based on enhancer
features. . . 191
6-7 Principal component analysis in DNase hypersensitive sites. . . 193
List of Tables
2.1 OR genes significantly cluster together based on the histone mark profile. 63
3.1 Analysis of biological comparisons reveal differences in chromatin state. 89
3.2 ChromDiff can capture epigenomic differences even when there are no
differentially expressed genes. . . 102
3.3 ChromDiff identifies chromatin state differences for Adult/Fetal,
Fe-male/Male, and CellLine/PrimaryCulture comparisons, while dPCA
does not. . . 104
4.1 Enriched gene sets for cluster A of brain and gastrointestinal comparison.131
4.2 Enriched gene sets for cluster B of brain and gastrointestinal comparison131
4.3 Enriched gene sets for cluster C of brain and gastrointestinal comparison.131
4.4 Enriched gene sets for cluster D of brain and gastrointestinal
compar-ison. . . 132
4.5 Enriched gene sets for cluster E of brain and gastrointestinal comparison132
4.6 Enriched gene sets for cluster F of brain and gastrointestinal comparison.133
4.7 Enriched gene sets for brain and gastrointestinal comparison. . . 133
4.8 Enriched gene sets for cluster A from comparison of blood and
non-blood samples. . . 135
4.9 Enriched gene sets for cluster B from comparison of blood and
non-blood samples . . . 136
4.10 Enriched gene sets for cluster C from comparison of blood and
4.11 Enriched gene sets for cluster D from comparison of blood and
non-blood comparison. . . 137
4.12 Enriched gene sets for adult and fetal comparison. . . 140
4.13 Enriched gene sets for cluster A from comparison of adult and fetal
samples. . . 141
4.14 Enriched gene sets for cluster B from comparison of adult and fetal
Chapter 1
Introduction
1.1
Motivation
One of the fundamental aims of biology is to determine what lies at the root of differ-ences across individuals, species, diseases, and cell types. Furthermore, the sequencing of genomes has revolutionized the ways in which scientists can investigate biological processes and disease pathways; new genome-wide, high-throughput experiments re-quire computer scientists with a biological understanding to analyze and interpret the data to improve our understanding about life science. This provides us with a key opportunity to use computational techniques for new biological discoveries.
One key insight into the question of biological variation comes from the central dogma of molecular biology: DNA in genes is transcribed into RNA, which is then translated into proteins, as shown in Fig. 1-1. This process of turning gene DNA into proteins is also known as gene expression. This central dogma naturally suggests that sequence changes in the DNA could play an important role in phenotypic variation, and research has shown this to be true. Specifically, research like the 1000 Genomes
Project8 has compared the genomes of individuals to identify genetic variations, such
as Single Nucleotide Polymorphisms (SNPs) and insertions and deletions of genetic sequence (InDels), across individuals and ethnic groups. Furthermore, comparisons of genomes of different species have produced evolutionary models of how species have
Figure 1-1: The central dogma of molecular biology states that DNA is transcribed
into RNA, which is then translated into proteins.1
have identified genetic variations that correlate with disease populations.10
While genetic variation is critical for individual, species, and disease variation, it cannot account for all differences: for example, different types of cells in an individual have varying function and attributes, but identical genetic makeup. This can be explained by the important role of gene regulation, which determines when, where, and how much each gene is expressed. Even though the genetic sequence provides the building blocks for an organism, gene regulation provides the instructions for how to put those blocks together.
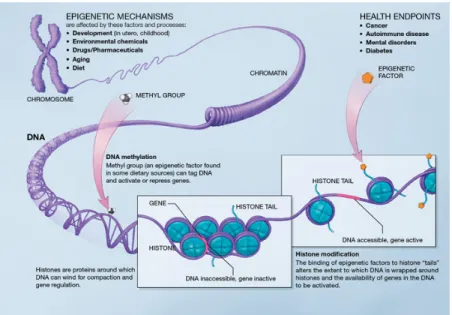
One way to study gene regulation is through epigenetic changes, which are dy-namic chemical changes to and around the DNA. While the DNA of every cell in an individual is the same, the epigenetic context for that DNA varies from cell to cell. In this way, these epigenetic differences play a crucial role in gene regulation, with epigenetic changes both causing and recording regulatory mechanisms. Specifically, the two main types of epigenetic modifications are 1) DNA methylation, a chemical change applied directly to the DNA, and 2) histone modifications, chemical changes applied to the histone proteins that the DNA is wrapped around, as illustrated in
Fig. 1-2.11, 12
Therefore, we can look to epigenomics, the study of genome-wide epigenetic changes, to explain cell type differences. The study of epigenomic differences be-tween cell types has led to insight into dynamic regulatory processes and cell type
Figure 1-2: Epigenetic modifications include methylation of the DNA strand (left)
and chemical modifications to the tails of the histone proteins (right).2
differentiation.10, 13–15 Furthermore, epigenetic changes have also been shown to vary
due to genetic sequence16 and individuals.17
In this thesis, we combine genetic, epigenetic, and expression information to fill in missing links between genetic variation, epigenetic changes, phenotypic variation, and gene regulation. To do this, we develop and apply computational methods to further our understanding of epigenomic regulatory mechanisms and variation. Specifically, we approach this problem with three main aims: 1) to identify gene family-specific epigenetic modifications and corresponding regulatory mechanisms; 2) to develop computational algorithms that identify meaningful epigenetic variation genome-wide; and 3) to better understand the relationship between epigenetic changes, gene regu-lation, and the resulting phenotype in different biological scenarios.
1.2
Background
1.2.1
Gene expression: central dogma of molecular biology
The process of gene expression, or the conversion of gene information into a gene product, makes up the central dogma of molecular biology. As illustrated in Fig. 1-1,
Figure 1-3: RNA Polymerase reads the nucleotides of one strand of the DNA to
produce the complementary RNA in a process known as transcription.3
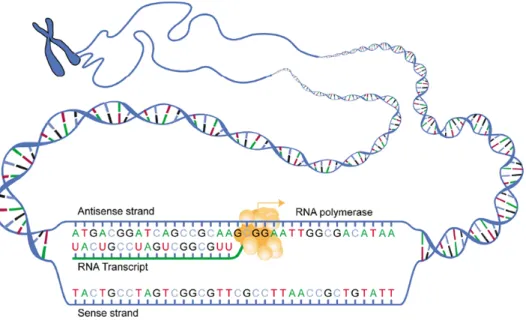
this process is classically broken up into two steps: transcription and translation. The starting point is the DNA (Deoxyribonucleic acid) in our cells, which is made up of four types of nucleotides: Adenine, Guanine, Thymine, and Cytosine. This encoding of DNA information is ideal for computational analysis, as these nucleotides act as the "bits" the make up the genetic "code". Furthermore, due to Hydrogen bonding, there is a natural pairing of these nucleotides. Specifically, Adenine and Thymine complement each other, while Guanine and Cytosine complement each other. In this way, DNA provides a redundant and robust encoding of our genetic information.
Through the process of transcription, the protein RNA Polymerase unzips the double-sided DNA to "read" the individual nucleotides. Using this information, it pro-duces the complementary single-sided mRNA (messenger ribonucleic acid), as shown in Fig. 1-3. The mRNA is produced using this same pairing template, except with the exception of Adenine pairing with Uranine rather than Thymine.
For the translational step, the cellular machinery reads the mRNA three bases at a time (each triplet of nucleotides is called a codon). Each of these codons maps to one of 22 amino acids, as shown in Fig. 1-5. As the machinery reads each codon, the corresponding amino acid is added to the amino acid chain using complementary base
Figure 1-4: The process of translation reads mRNA to assemble a chain of amino
acids to form a protein.4
Figure 1-5: Triplets of mRNA nucleotides act as codons to map to amino acids.5
pairing with tRNA (transfer ribonucleic acid), in this way constructing the complete protein, as shown in Fig. 1-4.
1.2.2
Regulation of gene expression
While the overall process of producing proteins from the genetic code is considered gene expression, controlling the time period or quantity in which genes are expressed is often referred to as gene regulation.
The underlying mechanisms of gene regulation are complex and vary widely in different contexts. While the genes provide the genetic "code" necessary for biological processes, gene regulation acts as the "control" level. Just as computer programs
must decide which sub-functions to run in which contexts, gene regulation ensures that specific genes are expressed in specific cell types during specific time points: this enables the same initial stem cells to differentiate into the hundreds of distinct cell types in an adult human.
Gene regulation can imply that expression of a gene is increased or decreased, and different types of gene regulation can occur at different points along the path of gene expression. Since gene expression is the act of transcription (DNA to RNA), followed by translation (RNA to proteins), some mechanisms of gene regulation occur at the transcriptional level, while some occur at the post-transcriptional level.
1.2.3
Functional and regulatory regions
While the model of gene expression focuses on one particular gene, each gene makes up only a tiny fraction of the entire set of genetic information in an organism, which is known as a genome. Through the advent of next-generation sequencing technologies, we are now able to gather information about the entire genome and its environment. However, with this increased amount of data, we also have the new challenge of discerning which regions of the genome are functional, important, and meaningful. While protein-coding genes are clearly important due to their role in gene expression, many other genetic sequences and regions also play a role in gene expression and
regulation, as shown in Fig. 1-6.18
For example, promoter regions are regions at the the beginning of genes at which proteins bind to for initiation of transcription, which effects gene regulation at the transcriptional level. Enhancer regions, on the other hand, can influence the tran-scription of genes that are distant in terms of the numbers of nucleotides, by being close in 3-dimensional space. Regions where transcription factors bind can also
influ-ence transciptional regulation through the effects of the transcription factors.18
The genome-wide annotation of these regions is possible by combining information about evolutionary conservation, experimental assays, and computational methods for
pattern recognition and inference.9, 11, 18–21 Identification of these regions can
Figure 1-6: Functional and regulatory genomic elements can either lie close to the relevant gene, as in cis-regulatory elements, or be distant in nucleotide space, as with long-range regulatory elements. The identification of these regions is accomplished
with a variety of experimental and computational techniques.18
computational models, and improve interpretation of biological findings and signals.
1.2.4
Epigenetic state and modifications
Epigenetic modifications provide one perspective that we can use for an improved understanding of functional regions and gene regulation. Specifically, epigenetic mod-ifications are chemical changes to the environment of DNA and generally fall into two categories: 1) DNA methylation, which directly occur on the DNA strand, and 2) histone modifications, which are chemical changes to histones, which are the proteins that DNA is wrapped around, as shown in Fig. 1-2.
The overall epigenetic state may control and/or record gene regulation in different circumstances, and they can be heritable across generations and dynamic across cell types. On a cellular level, epigenetic state can play a causal role in the regulation of genes - for example, a modification might serve as a "sign" that the surrounding genes should be expressed. On the other hand, the epigenome might show the history of how the genome has been used through different developmental stages; just like hunters
can find clues about nearby animals through tracks in the dirt, scientists can see the history of a cell by observing the locations and types of epigenetic modifications.
Therefore, epigenomics, which specifically studies epigenetic state on a genome-wide scale, can facilitate discoveries of large-scale patterns of gene regulation, such as regulation of entire gene families or differentiation patterns for a cell type, as we will explore in this thesis.
1.2.4.1 DNA methylation
DNA methylation is the addition of a methyl (-CH3) group to DNA, as shown on the left side of Fig. 1-2. Specifically, two of DNA’s four nucleotides, Cytosine and Adenine, can be methylated. In this thesis, we will focus on mammalian organisms, in which only Cytosine can be methylated. Furthermore, in mammals, methylation primarily occurs at CpG dinucleotides - that is, when a Cytosine and Guanine occur
next do each other in DNA.12Based on the patterns of DNA methylation in mammals,
there are a number of possible experimental techniques to quantify DNA methylation across the genome, ranging in the type of methylation they capture, as well as the
scope of sites they quantify.22
1.2.4.2 Nucleosome positioning
DNA is tightly wrapped around protein sets called nucleosomes, analogous to how yarn is wrapped around a spool. These nucleosomes are octamers of histone pro-teins, and the combination of nucleosomes and the DNA wrapped around it is called chromatin, as illustrated in Fig. 1-7.
Nucleosome positioning can also play an epigenetic role in pre-transcriptional gene regulation. Specifically, regions of the DNA that wrap around nucleosomes are less accessible and more closed to transcription factors. On the other hand, the regions of DNA that link the nucleosomes are more accessible and open to transcription
factors. The state of the DNA being more or less accessible due to nucleosome
positioning is often referred to as an "open chromatin state" or "closed chromatin state," respectively. In general, it has been shown that chromatin states are often
Figure 1-7: A nucleosome is made up of 8 histone proteins and has DNA wrapped
around it. The combination of the DNA and the nucleosome is called chromatin.6
correlated with the transcription state of the corresponding genes; they can act as instructions for the genes present in the surrounding DNA, or they can record the "history" of the transcriptional state.
1.2.4.3 Histone modifications and chromatin state
Histone modifications are chemical changes made to either the core or the long tail of certain histone proteins in the histone octamer. The naming mechanism of histone modifications provides detail about the location and type of modification. There are five major classes of histones, and the name of the histone modification starts with the class of histone (e.g. H3). This is followed by the single-letter amino acid abbreviation, such as K for Lysine, and the number for the position of the amino acid in the protein. The final part of the naming procedure is the type of modification that was applied to the amino acid, such as Me3 for trimethylation. Examples of these modifications are illustrated in Fig. 1-2.
Similarly to nucleosome positioning, histone modifications can also record or con-trol gene regulation. Furthermore, combinations of histone modifications have been able to provide a more detailed and nuanced multi-state description of epigenetic
state. Methods for combinatorial chromatin state annotations include ChromHMM,23
Segway,24 and HMMSeg,25 which use underlying combinatorial techniques such as
Hidden Markov Models and Bayesian networks. The resulting analyses enabled by chromatin state analysis has provided fruitful findings about epigenomic variation
and lineage-specification.17, 26–30
1.2.5
Epigenetic variation
One way to grasp the power of epigenetics is to note that the DNA in each cell of an organism is nearly identical, but the types of cell in an organism vary greatly in function, appearance, response, and activity. As different cell types have different epigenetic state, the study of epigenetics on a genome-wide scale is a natural tool
to study cell type variation. Cell type variation is achieved through the process
of cell differentation, where pluripotent stem cells can turn into highly-specific cell types. By comparing cells at increasingly progressed stages of differentiation, we can observe what epigenetic changes co-occur with differentiation stages, thereby providing mechanistic insights into differentiation.
In addition, epigenetic differences can also be studied at many other levels, such as variations across genotypes, individuals, anatomical groups, and tissue types, which
we will also explore in this thesis. As epigenetic state is also influenced by the
underlying genetics, care must be taken in unraveling genetic influences from other factors.
1.2.6
Human biology and model organisms
Much of the motivation underlying the study of these biological phenomenom lies in improving our understanding of human biology for the eventual betterment of human
health. With that goal in mind, studies of human samples19, 31, 32 are hugely important
when possible. A number of analyses presented in this thesis will be done directly on
human samples, whether they be cell lines, primary cells, or primary tissues.11
However, studying model organisms, such as yeast and mice, in addition to study-ing humans, has proven to be an incredibly powerful technique. As there are obvious ethical limitations on human experimental techniques, studying these model species with a larger toolbox of techniques can reveal biological findings that can then be con-firmed in humans. Similarly, if the interactions of factors in human are too complex to
immediately unravel, some model organisms, such as yeast, provide similar but sim-pler systems that are a crucial stepping stone for understanding humans. Therefore, in this thesis, we will also present work based on mouse samples, as well as validation through in-vivo follow-up experiments.
1.3
Relevant experimental methods
As outlined above, genome-wide studies of genetic and epigenetic effects are possible
due to the sequencing of the human genome,33, 34 as well as next-generation
experi-mental techniques.35, 36 Here, we will outline some of the techniques most critical to
our research.
1.3.1
DNA sequencing and mapping
The Human Genome was initially completed in 2004 through Sanger Sequencing,34
which also spurred the development of faster and cheaper next-generation sequencing
technologies.35–37 These technologies take advantage of the complementary
base-pairing of nucleotides. Specifically, the input to the sequencing process is fragments of DNA, and by using adaptor and primer sequences, in combination with dNTPs, flourophores, colour-coding, complementary base-pairing, and imaging, these
tech-nologies can produce "reads", the nuleotide sequence of these input DNA fragments.37
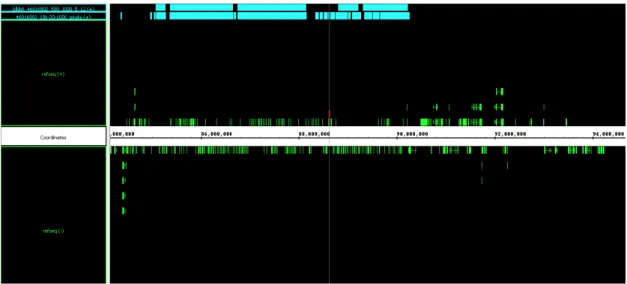
It is worth noting that after the reads have been generated, they still need to be assembled together, as each read is only a sequence fragment on its own. How-ever, since most non-repetitive reads have a distinctive sequence, these reads can be combined back together or mapped back to the corresponding part of the genome. (Note that reads that map to repetitive sequence will have a much harder time being assembled, due to their non-distinctive sequence, as shown by the pink read in Fig. 1-8.) Assembling the reads can be done either with a reference genome, referred to as "read mapping", or without a reference genome, which is called de novo assembly. When using a reference genome, the read sequence can be compared to the entire reference genome sequence, as shown in Fig. 1-8. While allowing for sequence
mis-Figure 1-8: The fragments of DNA sequence (reads) can be "mapped" back to a reference genome (black) by comparing the sequence of nucleotides, as shown by the green, red, and blue fragments. However, if the read corresponds to a repetitive or common sequence, as is shown by the pink read, it will be much more difficult to
map.38
matches due to variation or sequencing error, computational methods can find the best sequence match. Then, the read can be mapped to that location of the genome, as shown by the red, blue, and green reads in Fig. 1-8.
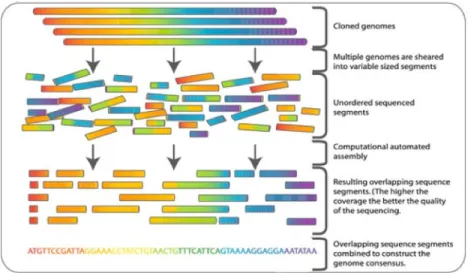
On the other hand, if no reference genome is given, the genome can be newly, or de novo assembled, as shown in Fig. 1-9. This is possible because there are multiple copies of the same genome to begin with; since the fragments are cut up randomly, many of the fragments should overlap each other. By using computational methods to identify overlapping sequence from different reads, the reads can be pieced back together like a puzzle, as shown in step 2 of Fig. 1-9, producing a final genome sequence.
1.3.2
Genotyping
In addition, to identify genetic variation, it can be more cost-effective to use
ar-ray technologies, such as single-nucleotide polymorphisms (SNP) with microarar-rays,40
rather than sequencing technologies. These "genotyping" approaches check for pre-determined regions and known types of variation, rather than identifying large con-secutive sequencees of the genome, as the proportion of the genome that varies among humans is less than 1
Figure 1-9: For de novo assembly, the overlapping parts of different fragments can be pieced back together, like puzzle pieces, to assemble a new, complete genome
sequence.39
∙ The substitution of one nucleotide for another nucleotide, also called a single-nucleotide polymorphism (SNP)
∙ The insertion of a genetic sequence ∙ The deletion of a genetic sequence
∙ A larger genomic region that is present an abnormal number of times in the same genome, also called copy number variation (CNV)
Much of the genotyping efforts have focused primarily on SNPs, as they are the easiest to identify and the biological phenomenom of Linkage Disequilibrium (LD) allows biologists to use a SNP to infer much of the surround genetic information with a high probability. To identify the nucleotide at a particular SNP, scientists can use
a "minisequencing" approach, utilizing many of the same techniques as sequencing,40
but only identifying a single nucleotide "minisequence". It is worth noting that this approach works even if the researcher is interested in a particular genomic position, but does not know what the probable underlying nucleotides are.
However, in practice, the vast majority of people will have only one of two possible nucleotides at a particular SNP, and these two nucleotides are called the "alleles" for that SNP. (For example, in Fig. 1-10, the top sequence has the A allele, while the bottom sequence has the T allele.) Therefore, other experimental techniques can take
Figure 1-10: The use of allele-specific oligonucleotides allow only the perfect plementary sequence to completely bind to the present allele (top), while the com-plementary sequence for the mis-matched allele will bind more weakly (bottom). After washing away the probes with weaker binding, only the perfect complementary oligonucleotide (top) will remain. Then, through the use of a detectable tag on the
probe, the underlying allele(s) can be identified based on the remaining probe(s).41
advantage of knowledge of the underlying alleles. Specifically, since scientists know the two probable nucleotides that can occur at a particular SNP, they can generate sequences of nucleotides with the appropriate complementary nucleotides.
These allele-specific sequences can be used as starting points, or "primers", for sequence extension. After the primer binds to the corresponding sequence, extension of the primer will only occur if the allele is a perfect match. In this case, dNTPs (both tagged and untagged) can be combined with flourescence imaging to identify which allele-specific primers are extended, since locations with flourescence can be
mapped to the underlying allele-specific primer.40
Similarly, these allele-specific sequences can also be used as "probes" by tagging them with a radioactive, enzymatic, or fluorescent tag. Since perfectly complementary allele-specific oligonucleotides bind more strongly to the present allele, as shown in Fig. 1-10, the probes with mismatches can be washed away, while the perfect matches can remain due to stronger binding. As a result, the presence of the underlying allele(s) can be identified through measurement of the tags on the remaining allele-specific sequences.
1.3.3
Chromatin immunoprecipitation
As mentioned above, chromatin is the combination of the nucleosome and the DNA wrapped around it. Chromatin immunoprecipitation (ChIP) allows researchers to identify what regions of the genome have a certain histone modification, among other uses. Specifically, the ChIP protocol isolates out DNA fragments that are bound to specific types of proteins through approximately four steps, as shown in Fig. 1-11. The first (optional) step is to bind the proteins with DNA (if this is not already done). Next, the DNA is cut up into fragments, also known as shearing. Then, by using an antibody that specifically recognizes a protein of interest, only proteins of interest and their attached DNA are isolated. Finally, the DNA fragments are separated from the proteins, producing the final DNA fragments.
To identify the underlying sequence and genomic location of the produced DNA
fragments, sequencing or microarray technologies can be used. When combining
the ChIP protocol with sequencing technologies, as described in Section 1.3.1, the number of reads that map to each nucleotide of the genome provide a continuous signal of enrichment across the genome. On the other hand, microarray technologies can be used when the scientist is only interested in pre-determined regions of the
genome, similarly to the techniques described in Section 1.3.2. In this case, the
isolated DNA fragments are tagged with flourescence and washed over a microarray chip that contains a matrix of probes. Based on the coloring of the cells on the chip, one can identify the intensity of the signal for each probe. Since each probe sequence maps back to the genome, this results in an enrichment signal for each probe region.
1.3.4
DNA methylation profiling
Multiple experimental techniques to identify regions of DNA methylation have been developed, though they range in the type of methylation they capture, as well as the
scope of sites they quantify.22
For example, bisulfite-based methylation experiments use the chemical bisulfite to
Figure 1-11: Chromatin Immunoprecipitation (ChIP) first cuts up the DNA into fragments, and then utilizes an antibody that detects and "pulls down" a certain type of protein. In this way, it only retains DNA fragments that were attached to the protein of interest, resulting in identifying genomic regions with a certain kind of chromatin or DNA-binding. As a result, it can be used to identify regions of histone
Figure 1-12: Bisulfite-sequencing-based experimental techniques directly measure methylated CpG sites in the genome. Specifically, bisulfite conversion changes any unmethylated Cytosine upstream adjacent to a Guanine into a Uracil, while methy-lated Cytosines upstream adjacent to Guanines are preserved as Cytosines. Then, the resulting converted nucleotides are sequenced, and by measuring the proportion of Cytosines to total Cytosines and Guanines at each CpG site, we can calculate the proportion of DNA methylation that occurred at that site on a 0 (never methylated)
to 1 (always methylated) scale.44
in Figure 1-12. As a result, sequencing of the resulting reads allow us to identify the location of uracils (which represent unmethylated cytosines) and cytosines (which represent methylated cytosines).
Whole genome bisulfite sequencing is considered the "gold standard" of DNA methylation technologies, as it directly converts any unmethylated Cytosine in a CpG site into a Uracil, while preserving methylated Cytosines, on a genome-wide scale, resulting in both precise base-pair resolution and wide coverage. However, the cost of a single WGBS experiment can be prohibitively expensive. Therefore, other bisulfite assays, such as RRBS (Reduced Representation Bisulfite Sequencing) focus on the methylation state of pre-determined CpG sites for a lower costLi:2015aa. These options highlight a common trade-off in genomic experiments, where experimental value is determined by a combination of cost and thoroughness.
Additionally, enrichment-based assays such as MeDIP-seq (methylated DNA im-munoprecipitation sequencing) and MBD-seq (methylated DNA binding domain
se-quencing) take an alternative approach of enriching methylated regions of DNA;43
these can also be combined with techniques such as MRE-seq (Methylation-sensitive Restriction Enzyme digestion-sequencing), which enrich for unmethylated regions to
generate a more complete picture.45 Then, computational approaches such as methyl
CRF can combine these experiments (specifically, meDIP-seq and MRE-seq) to com-putationally predict DNA methylation values at a base-pair resolution.
Figure 1-13: RNA-sequencing technology measures gene expression. RNA-Sequencing starts with RNA from a sample of interest, for which reverse transcriptase generates the complementary DNA (cDNA). After shearing the cDNA into fragments, these fragments can be sequenced into reads (top). Lastly, the reads are computationally mapped back to the reference genome to produce a continuous signal across the
genome (bottom).46
coverage, resolution, concordance, and quantification.45 This suggests that the ideal
experimental assay depends on the cost considerations, planned downstream analyses, and biological context. In this thesis, we will also explore concordance between DNA methylation platforms.
1.3.5
Transcriptome sequencing
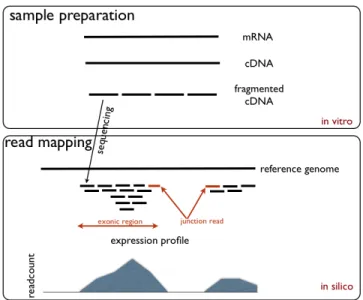
One important experimental technique to study gene regulation is RNA-seq, which allows us to measure the expression of a gene by quantifying levels of mRNA. This method does not perfectly capture all aspects of gene expression, as levels of mRNA may not perfectly correlate with amount of resulting protein due to post-transcriptional regulation. However, it does provide an informative genome-wide quantification of gene activity.
Specifically, RNA-Seq is another technique that takes advantage of next-generation
mi-croarrays were common to approximate the transcriptome, as they were high through-put and relatively inexpensive, and could reach a high resolution with specialized
chips.48–50 However, drawbacks of genomic tiling microarrays include assumptions
about the genomic sequence, problems of cross-hybridization and complicated
nor-malization.47 As a result, RNA-Seq has quickly become the dominant method of
transcriptome profiling.
The RNA-seq protocol first converts a population of RNA into a library of com-plementary DNA (cDNA) fragments. Since mRNA in eukaryotes typically end with a long sequence of Adenosine nucleotides (also called a "poly-A tail"), a complemen-tary sequence of many T’s can be used as a poly-T primer to bind to the poly-A tail. (Alternatively, random hexamers can also be used as primers.) By adding reverse transcriptase, the transcriptase can then use the primer to generate the rest of the sequence complementary to the original mRNA, which is the cDNA.
Then, by cutting up the cDNA sequences into fragments and sequencing the re-sulting cDNA sequencing, one can obtain reads, as described in Section 1.3.1. Again, the alignment of these sequenced cDNA fragments to the genome results in a genome-wide quantitative measure at the single-nucleotide level for the amount of transcript present. Advantages of RNA-Seq over other transcriptomic methods include single-base precision, no need for previous knowledge about the genomic sequence, low background signal, less RNA sample required at the outset, a larger possible range of
expression, high reproducibility, and lower cost.47
1.3.6
DNA footprinting
DNA footprinting experiments provide information about the accessibility of DNA. Specifically, one experimental technique that can be used to gain information about nucleosome positioning is DNAse-Seq, which identifies DNase 1 hypersensitive sites. The protocol uses the enzyme DNase I to selectively digest DNA that is not bound to nucleosomes, whereas DNA regions tightly wrapped in nucleosome and higher-order structures are more resistant to digestion. Due to the fact that many regulatory regions operate through binding by transcription factors, these transcription factors
would likely displace nucleosomes, necessitating an "open chromatin state." There-fore, DNase-Seq can generally be utilized as an assay to identify potential regulatory
and functional regions.45
1.4
Summary of research contributions
My thesis work is to develop and apply computational methods to further our un-derstanding of epigenomic regulatory mechanisms and variation. Specifically, I will approach this problem with three main aims: 1) to identify gene family-specific epi-genetic modifications and corresponding regulatory mechanisms; 2) to develop com-putational algorithms that identify meaningful epigenetic variation genome-wide; and 3) to unveil new insights regarding the relationship between epigenetic changes, gene regulation, and the resulting phenotype in varied biological scenarios.
1.4.1
An epigenomic mechanism for gene family regulation
As multicellular organisms develop from an initial single zygote into a complex system,
cellular differentiation turns less specialized cells into more specialized cells. For
example, pluripotent cells are unspecialized, and therefore, have the potential to differentiate into any cell type in the organism. Differentiation changes a cellâĂŹs size, shape, activity, and other physical characteristics, largely through the strict regulation of gene activity. This can be especially effective through the coordinated regulation of genes within the same gene family, such as olfactory receptor (OR) genes.
Olfactory receptor neurons, the neurons responsible for our sense of cell, are one type of specialized cell that has a strict âĂŹone neuron - one receptorâĂŹ rule: specifically, each olfactory neuron expresses exactly one olfactory receptor (OR) gene, while all the other OR genes are silenced. This means that each olfactory neuron has the genetic capacity to detect any odor molecules, but the receptors are regulated so every neuron actually detects exactly one smell. The chosen olfactory receptor gene that is expressed in the neuron largely defines the functional essence of that neuron.
The combined power of all the olfactory neurons is what enables the brain to detect a wide variety of smells. In this project, we identified the regulatory role of epigenetic modifications for the monogenic expression of olfactory receptor genes in mice.
Olfactory receptor gene regulation is especially crucial in mice, as their sense of smell is even more discriminating than humans; mice have over 1300 olfactory receptor genes (approximately 5% of their genes), while humans have only about 900 OR genes. Furthermore, mice are biologically very similar to humans, so findings in mice can often be generalized to insights in humans as well. Additionally, mice clearly provide experimental advantages over humans due to limits on data collection for humans. The lifespan of mice, as well as the increased experimental power provided by such a model organism, made mice a clear choice of model organism for this study.
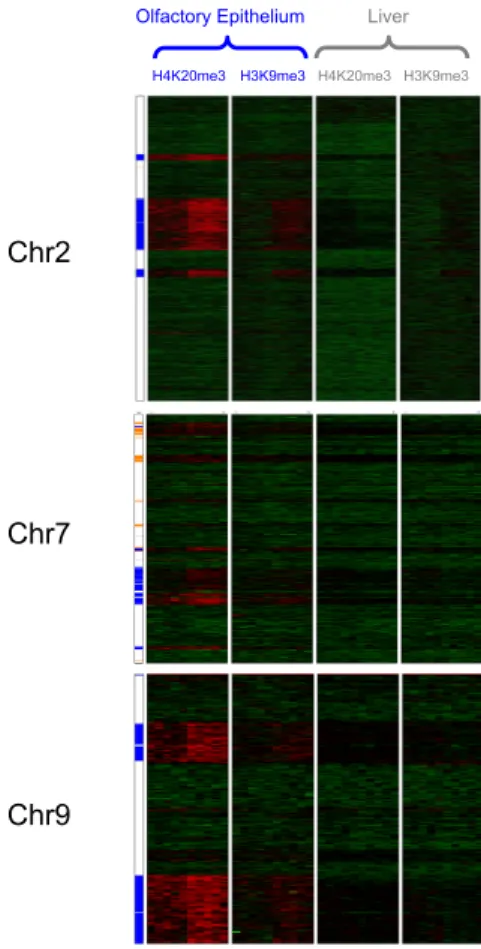
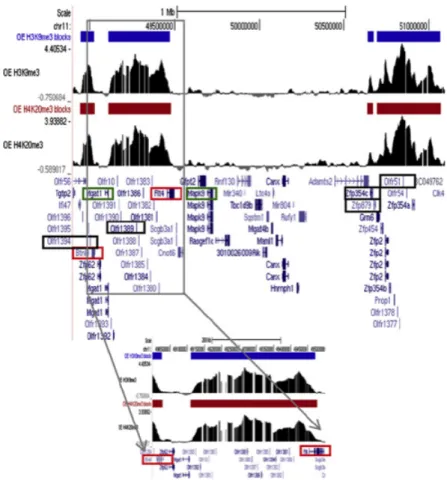
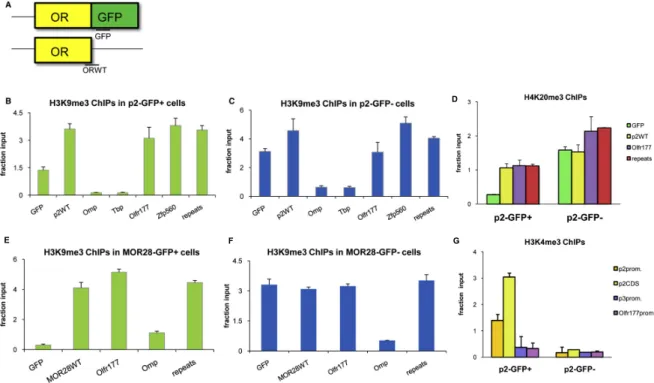
We found that in the mouse olfactory epithelium, OR genes are specifically and sensitively correlated with the histone modifications H3K9me3 and H4K20me3; these marks were much less present in our control tissue, liver. We also found that other familes of chemoreceptors, such as vomeronasal receptors and formyl peptide receptors were also marked with the same histone modifications, although to a lesser degree, suggesting a similar mechanism for those gene families as well.
This epigenetic pattern revealed an epigenomic mechanistic explanation for the monogenic and monoallelic regulation behind OR genes. Specifically, the cell-type and developmentally dependent deposition of these marks along the OR clusters suggests a repressive effect on the genes. Then, these marks are removed at a single OR allele during OR choice, to allow for expression at a single OR gene and allele in each OR neuron.
In contrast to the previous view of OR choice, our data suggest that OR silencing occurs developmentally prior to OR expression, indicating that it is not the product of an OR-elicited feedback signal. In essence, the repressive state is used as a con-servative starting state for this strict regulatory mechanism. Overall, this suggests a new role for chromatin-mediated silencing as the molecular foundation upon which singular and stochastic selection can be applied.
1.4.2
A genome-wide computational method for group-wise
chromatin state comparisons
These large-scale epigenomic and regulatory comparisons have been shown to
pro-vide fruitful insights about gene regulation and other biological processes.12, 14, 51 For
example, our work described in Chapter 2 was based on the differences of histone mark patterns between liver tissue and olfactory epithelium, providing a specific example of the power of identifying epigenomic differences. Of course, epigenomic variation can be studied not only at the tissue-specific level, but also at the allelic, individual, species, or case-control level, each of which can provide different biological
insights.13, 15, 16, 19, 19, 52–55, 55, 56, 56–60
As scientists further discovered the biological importance of epigenomic data, we also began to recognize the computational challenges that it provides. Specifically, epigenomic data includes many types of information, such as the presence of various histone marks, DNA methylation, and chromatin accessibility. These many types of data produce an exponential number of combinations that are necessary to consider, as these marks are likely to complement each other in a complex regulatory logic
system.61–64 To tackle this issue, a number of computational segmentation methods
have been developed, utilizing various machine learning and statistical methods, such
as hidden markov models and Bayesian networks.23–25 By generating a "summary"
chromatin state from many histone marks, we can perform a type of dimensional-ity reduction that retains the most important information, while also providing a biological interpretation of the histone mark data.
While progress with epigenomic comparisons and and chromatin state segmen-tations has been shown to be fruitful, the power of these two approaches have not yet been combined. Specifically, the key question of how to systematically identify chromatin state differences between groups of epigenomes has remained unanswered. To address this question, we developed ChromDiff, a probabilistic and information theoretic computational method to systematically identify chromatin state differences on a genome-wide scale. To make rigorous comparisons between groups of samples, we
also needed to address the fact that the increasing amount of available data is also, by necessity, being generated in less controlled conditions. Therefore, our methodology integrates correction for external covariates, such as sample type, sex of donor, and production lab, to better isolate the most relevant and meaningful differences. It also leverages both genic and regulatory regions to identify the most relevant features for each comparison. We validated our method by showing that it outperformed existing methods for group-wise epigenomic comparisons, while also proving its specificity with a lack of findings in randomized simulations.
Our method is broadly applicable to study the role of epigenomic variation in various phenotypes, including celltype, anatomy, development, donor sex, or disease. We made it publicly available at http://compbio.mit.edu/ChromDiff and http: //github.com/angieyen/ChromDiff so that future scientific studies may use it to uncover further epigenomic insights.
1.4.3
Epigenomic insights from comparisons based on
devel-opment age, sex, and tissue type.
With the power of ChromDiff, we were able to study chromatin state changes with the wealth of epigenomic data available from the Epigenomics Roadmap Project. Specifically, we compared diverse groups of epigenomes, including groups based on tissue type, sample state, sex of the sample, and developmental age of the donor. By comparing annotations from the core chromatin state model from the integrative
analysis,11 we identified relevant genes and chromatin states for epigenomic groups,
such as ChrX genes for the comparison of female and male samples.
Furthermore, we were able to validate our results by using matched gene expres-sion data, as well as pathways and gene sets. We found that many genes that epi-genetically distinguished between the groups did have corresponding gene expression changes, but that many more did not, suggesting that differential gene expression and chromatin state comparisons are powerful complementary approaches. Additionally, identification of enriched gene sets showed the biological relevance of the genes
iden-tified by ChromDiff, with blood comparisons isolating gene sets related to leukemia, a comparison of brain comparisons highlighted genes related to Alzheimer’s disease and oligodendrocyte differentiation, while fetal samples were distinguished from adult samples with gene sets relating to fetal differentiation and Alzheimer’s disease. Simi-larly, comparisons based on linked regulatory regions show different enhancer activity in blood cell subtypes, as well as a broad heterochromatic signature in female cells due to X Chr inactivation.
Overall, our results highlight the important genes and epigenomic states that can be identified using chromatin state comparisons of groups of epigenomes. In this way, the study of statistically meaningful chromatin state patterns in groups of epigenomes provides biological insights relating to celltype, gene regulation, and development.
1.4.4
Integrative analysis of DNA methylation data across
chromatin state, gene expression, platform, and
cell-types.
Epigenomics allows us to study the dynamic markings and states surrounding the DNA which varies not only across individuals, but also across celltypes. For the Epige-nomics Roadmap project, we employed computational and data science approaches to detect meaningful patterns in a wide variety of epigenomic datasets across 127 cell types. As epigenomics includes the study of many chemical states surrounding DNA, including DNA methylation, histone makes, and DNase footprinting, we also integrated data across many experimental assays to identify relationships between epigenomic marks.
With this approach, we uncovered a number of findings relating to DNA methy-lation, especially focusing on how DNA methylation varies across the genome based on chromatin state and celltype. For example, we identified the DNA methylation state of chromatin states, showing that active promoter and bivalent states tend to be hypomethylated, while transcriptional states tend to be hypermethylated, as is
to have variable DNA methylation states, and that DNA methylation in the same chromatin state varied across cell types and proliferation status.
We quantified these patterns by comparing the DNA methylation of real chro-matin state regions with that of randomized genomic regions across the genome that were matched for size and number. Based on the resulting distributions, we iden-tified chromatin states with distinctive DNA methylation values compared to the genomic background, such as active promoter states and bivalent regions. On the other hand, we also identified that chromatin states such as quiescent, weakly poly-comb repressed, and weakly transcribed regions had DNA methylation patterns most similar to random genomic regions.
Importantly, we also quantified the correlation and differences between multiple experimental technologies used to gather DNA methylation measurements. Specifi-cally, we identified high consistency between methylation values given with bisulfite-sequencing based experiments, while a computational inference technique using enrichment-based assays resulted in weaker correlation and directional biases. As a result, we also generated platform-specific DNA methylation distributions for chromatin states, showing that platforms affected results in both variance and median value.
Lastly, we demonstrated our ability to order and cluster samples based on epige-nomic similarity, both by looking at DNA methylation state in various enhancer modules, and calculating pair-wise similarity between epigenomes based on various histone marks. In sum, we presented biological hypotheses and patterns from our data-driven integrative analysis of multiple large-scale experimental datasets.
1.4.5
Identification of unknown covariates in epigenomic
sam-ples with mutual information analysis against true
co-variates.
With the pressing need for large-scale genomic data, many collaborative efforts have resulted in public resource datasets that researchers around the world can use to supplement or drive their own research studies. However, these datasets also present
new issues, due to their generation in less consistent and controlled experimental circumstances. For this reason, covariate correction such as the logistic regression integrated into our ChromDiff method is crucial to meaningful and fruitful analyses. However, metadata describing the experimental and sample characteristics may be inconsistent, poorly documented, or unavailable, especially when combining multiple datasets. Here, we utilize principal component analysis to potentially identify the most important unknown covariates, inspired by the use of PCA in genetic studies to
identify and correct for signal due to the population or ethnicity.66 Then, we use our
true known metadata to identify the relationship between the "unknown" principal component covariates and the known metadata covariates, using Component Selection Using Mutual Information.
We find that the top principal components map closely to covariates relating to sample group, cell type, and anatomy, confirming our previous results that cluster-ing samples based on epigenomic signal primarily drives groups based on celltype. We additionally find that less highly-ranked covariates often share large amounts of mutual information with covariates based on processing lab, composition of sample, and developmental age of donor. Overall, we can conclude that these covariates play an important role in driving the signal of these epigenomic datasets, and to a large extent, using dimensionality reduction methods such as PCA can produce covariates that do a reasonable job as a "stand-in" covariates for known metadata. However, we also find that top principal components explain only a small proportin of the overall variance in the data. This may mean that much of the signal of interest will remain after correcting for the top principal components, but it may also indicate that, de-pending on the property determining the epigenomic groups, it may be better not to correct for principal components, especially when there is a risk of removing the signal of interest.