C E N T R E D' ÉT U D E S E T D E R E C H E R C H E S S U R L E D E V E L O P P E M E N T I N T E R N A T I O N A L
SÉRIE ÉTUDES ET DOCUMENTS
Assessing the effects of combating illicit financial flows on domestic
tax revenue mobilization in developing countries
Jean-Louis Combes
Alexandru Minea
Pegdéwendé Nestor Sawadogo
Études et Documents n° 7
February 2019
To cite this document:
Combes J.-L., Minea A., Sawadogo P. N. (2019) “Assessing the effects of combating illicit
financial flows on domestic tax revenue mobilization in developing countries”, Études et
Documents, n° 7, CERDI.
CERDI POLE TERTIAIRE 26 AVENUE LÉON BLUM F-63000 CLERMONT FERRAND TEL.+33473177400 FAX +33473177428 http://cerdi.uca.fr/2
The authors
Jean-Louis Combes
Professor
Université Clermont Auvergne, CNRS, IRD, CERDI, F-63000 Clermont-Ferrand, France.
Email address:
j-louis.combes@uca.fr
Alexandru Minea
Professor
Université Clermont Auvergne, CNRS, IRD, CERDI, F-63000 Clermont-Ferrand, France.
Email address:
alexandru.minea@uca.fr
Pegdéwendé Nestor Sawadogo
PhD Student in Economics
Université Clermont Auvergne, CNRS, IRD, CERDI, F-63000 Clermont-Ferrand, France.
Email address:
pegdewende_nestor.sawadogo@etu.uca.fr
Corresponding author: Pegdéwendé Nestor Sawadogo
This work was supported by the LABEX IDGM+ (ANR-10-LABX-14-01) within the program “Investissements d’Avenir” operated by the French National Research Agency (ANR).
Études et Documents are available online at:
https://cerdi.uca.fr/etudes-et-documents/
Director of Publication: Grégoire Rota-Graziosi
Editor: Catherine Araujo-Bonjean
Publisher: Mariannick Cornec
ISSN: 2114 - 7957
Disclaimer:
Études et Documents is a working papers series. Working Papers are not refereed, they constitute
research in progress. Responsibility for the contents and opinions expressed in the working papers rests solely with the authors. Comments and suggestions are welcome and should be addressed to the authors.
3
Abstract
Using propensity score matching, this paper assesses the effects of tackling illicit financial
flows (IFFs) on domestic tax revenue mobilization in developing countries. It uses data on
countries’ compliance with Financial Action Task Force (FATF) Recommendations as treatment
variable and involves 67 developing countries around the world. We find that countries which
comply with FATF Recommendations (Cooperatives countries) record higher values of
domestic tax revenue in comparison with those which do not comply with those
Recommendations (Non-cooperatives countries). Otherwise, Cooperatives countries
outperform Non-cooperatives countries in terms of domestic tax revenue mobilization. More
interestingly, the extent of this adverse impact depends on tax structure: goods and services
taxes are more affected, followed by VAT and excise taxes. Our results suggest that developing
countries could mobilize more domestic tax revenue by implementing policies to curtail IFFs.
Moreover, they should establish sound institutions.
Keywords
Illicit financial flows, Tax revenue, Institutions, Propensity score matching.
JEL Codes
1. Introduction
Illicit financial flows (IFFs) are viewed as “funds that are illegally earned, transferred, or utilized”
(GFI, 2015). This definition1 is broader than an earlier operational and circumscribed (Ajayi and
Ndikumana, 2015) description by Kar (2011) who defines illicit financial flows as “the cross-border
transfer of the proceeds of corruption, trade in contraband goods, criminal activities, and tax evasion”. That said, they stem from various sources including corruption (embezzlement, bribery and theft), criminal activities (drug and human smuggling, bootlegging, etc.) and international trade2 (export
under-invoicing and import over-under-invoicing). The measurement of IFFs remains an important issue for empirical studies. Indeed, an examination of money laundering process and the global efforts to address it leads Buchanan (2004) to say that there is not still a specific methodology to estimate the impact of money laundering. In fact, different authors use various sources and analytical methodologies to estimates the value of IFFs from developing countries (IMF; World bank; UN COMTRADE; US Department of Commerce; European Statistics; Kar and Cartwright-Smith, 2008, 2010; Kar and Freitas,
2011; Ndikumana and Boyce, 2011).
IFFs constitute a potential source of domestic revenue mobilization for developing countries (Kar
and Cartwright-Smith, 2010; Kar and Leblanc, 2013; Ndikumana and Boyce, 2012). Over the period
span from 2004 to 2013, estimates show that developing countries have illicitly lost around $800 billion per year (Kar and Spanjers, 2015). At the same time, the total foreign direct investment (FDI) net inflows is estimated to nearly $650 billion/year. As for migrants’ transfers, the annual flows of remittances are approximately evaluated to $6 billion. While the total annual amount of official development assistance (ODA) is slightly equal $82 billion in these countries. Altogether, the annual amount of IFFs ($800 billion) surpasses the cumulated amount of FDI, ODA and remittances ($738 billion) in the developing world3. Several developing countries tend to be trapped in poverty due to
structural factors including inequalities, epidemics, low productivity, exclusion from financial markets and high exposure to crises and natural disasters (UN, 2013; IMF, 2014).
To improve economic growth and reduce dependency on official development assistance, DCs need to bridge their infrastructure gap in many areas such as education, health, electricity, roads, ports, highways, etc. (Calderon and Serven, 2004; Arezki and Sy, 2016). They also need to practice sound macroeconomic policies. Domestic resources’ mobilization could therefore help these countries to face these development challenges. Analyzing the pathways through which tackling IFFs hinder tax revenue mobilization is an important question in developing countries. The objective of this paper is to evaluate the effects of combating IFFs on domestic tax revenue mobilization. Indeed, the measurement of IFFs from DCs encounters several limitations given the hidden nature of those funds. The originality of this
1Defining IFFs is not straightforward as indicates the existing debate around this concept (Reuter and Truman, 2004; Baker, 2005; Kar, 2011;
African Tax Administration Forum, 2015; Global Financial Integrity, 2015; High Panel on Illicit Financial Flows from Africa, 2015;
Inter-Agency Task Force on Financing for Development, 2017; OECD, 2015; United Nations, 2016a, 2016b; World Bank, 2016). However, all these
definitions converge on the concept of financial transfers across borders (Forstater, 2018).
2 Trade mis-invoicing is used to evade taxes by circumventing customs duties, goods & services taxes, VAT, excise taxes, income taxes, etc. 3 Sources: UNCTAD, OECD, IMF.
paper is that it assesses the effects of conforming with the Financial Action Task Force4 (FATF)
Recommendations on domestic tax revenue mobilization.
We contribute to this literature by assessing the macroeconomic impact of combating IFFs in terms of domestic tax revenue mobilization in DCs. This paper does not seek to evaluate the effect of IFFs on tax revenue. It focuses on the effect of combating IFFs on tax revenue mobilization. Indeed, IFFs represent funds that would be used to face development challenges5 such as inequalities, infrastructure
gap, etc. in these countries. They contribute to worsen macroeconomic conditions (investment, growth, public debt) given that they reduce the economic performance and by the way the mobilization of internal resources. Moreover, IFFs could reduce the consent to taxation, reducing tax receipts.
We find that countries which combat IFFs are more able to better mobilize domestic tax revenue in developing countries. Specifically, tackling IFFs improve domestic revenue mobilization by around 1.2 pp of GDP in the countries at hand.
The policy implications of this paper are that developing countries could improve their domestic revenue mobilization by combating IFFs. This is possible if they implement policies to impede IFFs such compliance vis-à-vis international standards in terms of anti-money laundering and combating the financing of terrorism. They need also to establish sound institutions if they really aim to enhance domestic tax revenue mobilization.
The rest of the paper is organized as follows. Section 2 discusses the related literature. Section 3 details the data and highlights key stylized facts. Section 4 describes the methodological approach. Section 5 discusses the main results. Section 6 explores their sensitivity. Section 7 concludes the paper and draws some policy implications.
2. Literature review
According to the neoclassical theory, financial movements are the results of rational portfolio decision by economic agents (Collier et al., 2001,2004). This decision is explained by macroeconomic conditions such as exchange rate duality, public sector indebtedness and political stability (Dooley,
1988). However, the Afdb et al. (2013) criticize the orthodox view and stress the fact that it not includes
an important component namely outflows resulting on illicit appropriation (theft, plundering of public resources, corruption and trade mispricing). In fact, capital leakages have some consequences on economic development (Fofack and Ndikumana, 2009). These authors clearly demonstrate that the gain from capital repatriation surpasses the expected benefits from other sources such as debt relief.
4 The Financial Action Task Force (FATF) is an international institution, created in 1989, that develops and promotes policies to protect the
global financial system against money laundering, terrorist financing and the financing of proliferation of weapons of mass destruction (FATF,
2012).Its Recommendations formulate a comprehensive and consistent regulatory framework for anti-money laundering and combating the
financing of terrorism, as well as the financing of proliferation of weapons of mass destruction. Since 2003, these Recommendations have been endorsed and recognized by over 180 countries as the international standard for anti-money laundering and countering the financing of terrorism (AML/CFT).
5 This is in line with the 2030 Agenda for Sustainable Development (UN, 2015). In fact, the 16th goal (“Promote Just, Peaceful and Inclusive Societies”) targets to “Significantly reduce illicit financial and arms flows, strengthen the recovery and return of stolen assets and combat all forms of organized crime by 2030”(fourth target) and to “Strengthen relevant national institutions, including through international cooperation, for building capacity at all levels, in particular in developing countries, to prevent violence and combat terrorism and crime” (eleventh target).
Empirical studies identify many factors which explain financial flows from developing countries (DCs). These factors include macroeconomic environment (Brada et al., 2013; Ndikumana and Boyce, 2003; Lensink et al., 1998; Olopoenia, 2000; Dooley, 1988; Pastor, 1990; Mikkelsen, 1991; Boyce, 1992,
1993; Hermes and Lensink, 2000; Cuddington, 1986, 1987) and political situation (Cuddington, 1986;
Ul and Haque, 1985; Christian, 2009; Alesina and Tabilllini, 1989).
Investigation on the illicit part of financial transfers have been a subject matter of several researches. For example, Kar (2011) argues that IFFs are determined by macroeconomic factors (fiscal deficits, exchange rate, inflation, real GDP growth, negative real rate of return, external debt), structural factors (“un”-inclusive growth, international trade without control, and reforms without regulation) and institutional factors (corruption, informal economy, business environment, and political instability). According to Holzenthal (2017), financial crime increases on the aftermath of political as well as economic change. He then predicts that 2017 will be a risky year vis-à-vis to compliance because of various events around the world (Brexit, the US elections, revolution in the Islamic world, etc.). Perez
et al. 2012 investigate the role of FDI in facilitating money laundering and illegal capital flight in
transitions economies and find that illicit money flows explain FDI outflows in the sample studied. The extend of these effects is 6-10% of the total FDI outflows and 20% of FDI directed towards countries supposed to be money laundering centers. For Kar and Freitas (2011), the 2008 global financial crisis explains the decrease of IFF from DCs at the decade ending 2009 via the breakdown of international trade. Ndikumana and Boyce (2012) underscore that capital stock of African continent would increase by 60 per cent if funds were not leave illicitly and that GDP per capita would increase by 15 per cent in the same assumption. Also, IFFs contribute to worsen inequalities by many conduits (taxes, services delivery, etc.). African governments have more difficulties to provide social services over the continent as their economies are gloomy. The African forum for Tax Administration shows that one third of Africa’s wealth is held abroad and then, tax authorities are deprived by resources that would be used to reduce inequalities over the continent. In sum, Quirk (1996) investigates the macroeconomic implications of money laundering and shows that it significantly affects currency and money balances and may reduce economic growth. Zoromé (2007) proposes a definition of Offshore Financial Centers (OFCs) based on countries macroeconomic conditions rather than a subjective analysis of their regulatory framework.
The role of sound institutions in curtailing IFFs is stresses in the literature. Thus, Ajayi and
Ndikumana, 2015 postulate that, although rooted in governance, the persistence of illicit financial flows
depends on both domestic and international actors, and therefore on international political economy, in addition to the structure and functioning of global (financial, legal, and political) organizations. Grand corruption is essential in the nexus between illicit financial flows and governance. It corrodes governance, which in turn engenders opportunistic crimes (Ajayi and Ndikumana, 2015). An analysis
of Tanzi (1996) shows that money laundering affects both the international allocation of resources and
regulation and supervision in small pacific island countries and advocates stronger cooperation in these countries. He also calls for more financial and technical assistance. Buchanan (2003) exposes a clinical examination of money laundering process as well as the extend of the problem and global efforts to combat it. Money laundering is viewed as a financial crime. Yepes (2011) assesses country compliance with anti-money Laundering and Combating the Financing of Terrorism (AML/CFT) and highlights a low overall compliance, undermining financial transparency.She also makes evidence that financial and economic development, governance and FDI are positively related to compliance with AML/CFT standard while the performance of banking systems and M2/GDP reduce compliance.
A substantial literature on the determinants of tax revenue mobilization point out several factors
(Lotz and Morss, 1967; Chelliah et al., 1975; Tait et al., 1979; Chelliah, 1971; Tanzi, 1992; Stotsky and WoldeMariam, 1997; Tanzi, 1981; Leuthold, 1991; Ghura, 1998; Eltony, 2002; Tanzi, 1991; Tanzi and Zee, 2000; Baer et al., 2002; Gupta, 2007; Devarajan et al., 2002 ; Bird et al., 2008; Ghura, 1998;
Agbeyegbe et al., 2006; Keen et al., 2009; Mahdavi, 2008). According to this literature, the main
determinants of tax revenue are per capita income, international trade, agriculture share, natural resources, foreign debt, corruption, rule of law, etc. Current literature on the issue point out institutions and good governance as the most important factors which affect tax revenue in DCs. In a recent study,
Aaskoven (2018) investigate the effects of budget institutions on taxation in 15 EU countries and finds
that the centralization of budget process raises the level of taxation. He further indicates that centralizing budget process reduce government debt and deficits by increasing public revenues (taxation as share of GDP) and moderating public spending. Corruption is also identified as an important determinant of tax revenue in many developing countries (Tanzi and Davoodi, 1997; Friedman et al., 2000; Imam and
Jacobs, 2007). For example, Imam and Jacobs (2007) highlight a negative effect of corruption on tax
revenue mobilization in MENA countries. They show that this effect depends on tax structure: international trade tax is more affected than the other types of taxes6.
3. Data and stylized facts 3.1. Data
We work on 67 developing countries from the years 2004 to 2013. This sample period is determined by the availability of IFFs’ data. Our data on tax revenue stem from the International Centre for Tax and Development’s (ICTD) Government Revenue Dataset (GRD) and The IMF’s tax revenue dataset. The data on the treatment variable are drawn from the Financial Action Task Force (FATF). The remaining variables come from various sources including The World Bank Group (World Development Indicators & Worldwide Governance Indicators), The IMF World Economic Outlook (WEO) data, GFI data, ICRG, Kose et al. (2017) and Chinn and Ito (2006) index of capital openness.
We use in this paper data from GFI which proposes a full estimation of IFFs by combining the residual method of the World bank and the IMF’s method. We investigate only on the effects of IFFs
outflows (and not on the net outflows) on tax revenue because as noted by Kar and Freitas (2012),there are not a “net crime”. Also, there is no reason for illicit inflows to produce the same macroeconomic effects as illicit outflows7.
Our sample include 17 Non-Cooperative countries and 50 Cooperative countries. The number of Non-Cooperative countries has evolved over time. In fact, the FATF have identified 10 countries in 2004 as Non-Cooperative. This number evolve to 11 countries in 2008 with the inclusion of Iran. In 2011, Sri Lanka and Turkey expand the list to 13 countries. The last country to be listed as Non-Cooperative in our sample is Algeria in 2013.
3.2. Stylized facts
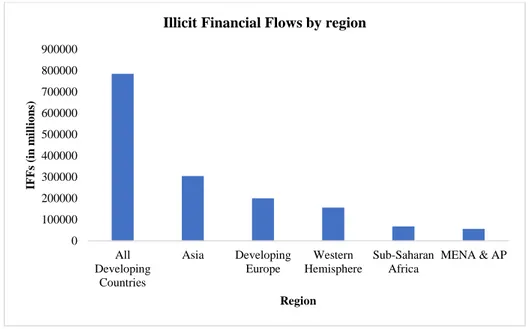
Figure 1 shows that IFFs are important in Asia’s countries in comparison with other regions around
the world. They also increase over years in DCs from 3.6 to 8.2 billion dollars between 2004 to 2013
(Figure 2). Table 1 (in the appendix) presents descriptive statistics of the main variables used in this
paper.
Figure 1: Average annual illicit financial flows from DCs by region from 2004 to 2013
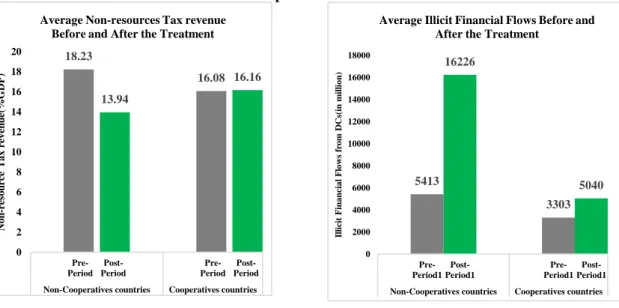
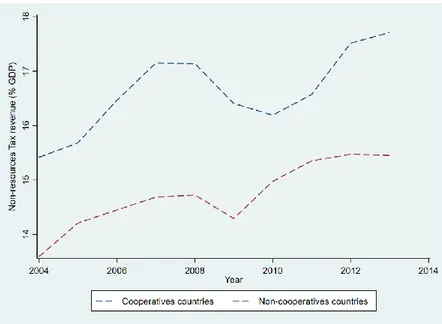
Figure 3 highlights that the value of tax revenue is higher in Non-cooperative countries (18.23% of
GDP) in the pre-treatment period8, compared to Cooperative countries (16.08% of GDP). However, this
value decreases in Non-cooperatives countries after the treatment (13.94% of GDP) while it slightly increases in Cooperatives countries in this post-treatment period (16.16% of GDP).
Finally, figure 4 indicates that the mean value of tax revenue is higher in Non-cooperatives countries over the sample period of this study. Therefore, Non-Cooperative countries are richer than Cooperative
7 The recommendations of the Financial Action Task Force oblige all countries to be transparent from the point of view of international
cooperation. Countries qualified as tax havens are classified as Non-Cooperative once they do not respect these Recommendations.
8 The cut-off date for cooperative countries is define as the mid-year period between the first time that FATF lists a country as Non-Cooperative
(2004 in our case) and the sample end-year (2013) (see Miskin and Schmidt-Hebbel, 2007; Minea and Tapsoba, 2014). The cut-off dates for
Non-Cooperative countries are the years of their inclusion in the FATF list. 0 100000 200000 300000 400000 500000 600000 700000 800000 900000 All Developing Countries Asia Developing Europe Western Hemisphere Sub-Saharan Africa MENA & AP IFFs (i n m il li o n s) Region
countries. These graphic representations (figure 3 & 4) show that Cooperation with international standard in terms of combating IFFs may influence domestic revenue mobilization in developing countries9.
Figure 2 : The evolution of IFFs from 2004 to 2013
Figure 3: Tax revenue and IFFs flows from DCs Before versus After inclusion in FATF list of Non-Cooperative countries
4. Theoretical model
We aim to evaluate the treatment effect of Non-Cooperation on tax revenue. Then, we consider (following the literature on impact evaluation) Non-Cooperation with international rules as treatment variable. We refer to countries which do not comply with Financial Action Task Force (FATF) rules (i.e. Non-cooperative countries) as treated group and countries which comply with those rules as control group (Cooperative countries).
9 Given that comparing the mean value of tax revenue between treated and control group can be biased by the “selection on observables”
problem, these stylized facts simple show some correlations. 0 1000 2000 3000 4000 5000 6000 7000 8000 9000 10000 2004 2006 2008 2010 2012 2014 Il li ci t Fi n a n ci a l Fl o w s( in m il li o n ) Year
IFFs over years
18.23 16.08 13.94 16.16 0 2 4 6 8 10 12 14 16 18 20 Pre-Period Post-Period Pre-Period Post-Period Non-Cooperatives countries Cooperatives countries
No n -r es o u rc e T ax r eve n u e( %GDP )
Average Non-resources Tax revenue Before and After the Treatment
5413 3303 16226 5040 0 2000 4000 6000 8000 10000 12000 14000 16000 18000 Pre-Period1 Post-Period1 Pre-Period1 Post-Period1 Non-Cooperatives countries Cooperatives countries
Il licit F in an cial F lows f rom DC s( in m il lion )
Average Illicit Financial Flows Before and After the Treatment
The Average Treatment on the Treated (ATT) is estimated based on the following equation: 𝐀𝐓𝐓 = 𝐄[(𝒀𝒊𝟏− 𝒀𝒊𝟎)|𝐂𝐨𝐨𝐩 = 𝟏] = 𝑬[𝒀𝒊𝟏|𝑪𝒐𝒐𝒑 = 𝟏] − 𝑬[𝒀𝒊𝟎|𝑪𝒐𝒐𝒑 = 𝟏] (𝟏) where 𝑪𝒐𝒐𝒑 is the Non-Cooperation dummy variable in country 𝒊, 𝒀𝒊𝟏 is the value of tax revenue when country 𝒊 has Non-cooperative and 𝒀𝒊𝟎 if it Cooperates, 𝒀𝒊𝟎|𝑪𝒐𝒐𝒑 = 𝟏 is tax revenue value that would have been observed if Non-cooperative country had Cooperative with FATF rules and, 𝒀𝒊𝟏|𝑪𝒐𝒐𝒑 = 𝟏 the tax revenue value really observed on the same Non-cooperative country.
Equation (1) means that the comparison between tax revenue value observed in Non-cooperative countries and tax revenue value observed in the same countries if they had Cooperatives would give us an unbiased estimate of the ATT. However, the main difficulty here is that this second term on the right side of this equation is unobservable. We cannot observe tax revenue value of Non-cooperative country had it Cooperate.
With a random choice of Cooperation, we can simply compare the sample mean of the Non-cooperative countries and that of Cooperative countries to bypass this difficulty. However, the choice of cooperating or not with FATF rules may be dictated by some observable factors (political institutions, macroeconomic conditions, etc.) that also determine tax revenue mobilization. This can lead to self-selection. Then, comparing the mean value of tax revenue between the two samples can generate a “selection on observables” problem10, biasing linear regression method (Lin and Ye, 2007).
4.1. Matching on propensity scores
We follow the empirical literature (Lin and Ye, 2007; Tapsoba, 2012; Minea and Tapsoba, 2014;
Guerguil et al., 2017) and address the “selection on observables” problem by using various PSM
methods11. PSM consist here to compare Non-cooperative and Cooperative countries based on their
observable characteristics. The difference of tax revenue value of the two groups of countries is supposed to be the effect of Non-Cooperation. A crucial assumption to address the selection problem when applying matching method is unconfoundedness (or conditional independence). This identifying assumption is expressed as (𝒀𝟎, 𝒀𝟏⏊ 𝑪𝒐𝒐𝒑|𝑿) and show that given some observable factors (X) which are unaffected by the treatment (Non-Cooperation here), the outcome (tax revenue) are independent of the treatment12.
Under unconfoundedness, Equation (1) can be rewritten as:
𝐀𝐓𝐓 = 𝑬[𝒀𝒊𝟏|𝑪𝒐𝒐𝒑 = 𝟏] − 𝑬[𝒀𝒊𝟎|𝑪𝒐𝒐𝒑 = 𝟎, 𝑿𝒊] (𝟐) where we have replaced 𝑬[𝒀𝒊𝟎|𝑪𝒐𝒐𝒑 = 𝟏, 𝑿𝒊] with 𝑬[𝒀𝒊𝟎|𝑪𝒐𝒐𝒑 = 𝟎, 𝑿𝒊]
10 As indicate by Lin and Ye (2007), the selectivity problem here is neither on unobservables (omitted variables) nor a Heckman-type selection
problem.
11 We implement alternative PSM methods including Nearest-Neighbor (NN) matching, Radius matching within a Radius (or caliper) of length
r (large radius r=0.05, medium radius r=0.01 and small radius r=0.005), regression-adjusted Local Linear matching (LLR) coined by Heckman
et al., 1998 and Kernel matching.
12 Unconfoundedness implies that all factors that influence the treatment and the outcome have to be observed by the researcher (Caliendo and
Then, each matching method would be to match the treated units to the control units with similar values of X. but given that the number of covariates in X increases, it would be difficult to implement a matching on X. Rosenbaum and Rubin (1983), in order to bypass this difficulty, suggest matching the two groups based on their propensity score-PS (instead of X). The propensity score here is the probability of being Non-cooperative conditional to the observable (X). That is:
𝒑(𝑿𝒊) = 𝑬[𝑪𝒐𝒐𝒑|𝑿𝒊] = 𝐏𝐫(𝑪𝒐𝒐𝒑 = 𝟏|𝑿𝒊) (𝟑)
Another assumption which is important for the application of PSM is the common support assumption. This assumption (𝒑(𝑿𝒊 < 𝟏)) requires the existence of comparable control units for each treated unit and vis-versa.
The ATT when using PSM under the common support assumption is:
𝐀𝐓𝐓 = 𝑬[𝒀𝒊𝟏|𝑪𝒐𝒐𝒑 = 𝟏, 𝒑(𝑿𝒊) ] − 𝑬[𝒀𝒊𝟎|𝑪𝒐𝒐𝒑 = 𝟎, 𝒑(𝑿𝒊)] (𝟒)
4.2. Estimating the Propensity Score
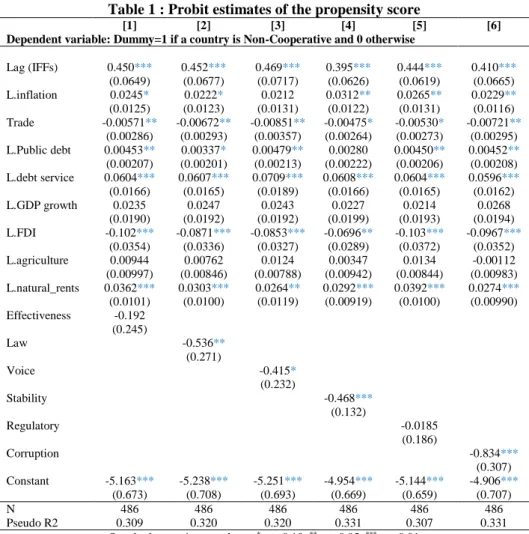
Table 2 shows our estimates of propensity score using a probit model13. We explain the probability
of Non-compliance with FATF Recommendations, controlling for various factors. As a matter of fact, countries which record high amounts of illicit financial flows in the past are expected to ignore international standards for combatting IFFs. This variable can also affect tax revenue. However, this have little effect on our results given that an estimation bias may occurs only if a variable that simultaneously affect tax revenue and the probability of Non-Cooperation is omitted. We then expect a positive sign between past IFFs and the probability of being Non-Cooperative. The effects of macroeconomic policies are captured by inflation rate. Worse macroeconomic situation leads to low tax revenues (Tanzi, 1977; Imam and Jacobs, 2007).This variable is also expected to positively affect the probability of Non-Cooperation. We also control for international trade. This factor is expected to reduce the probability of Non-Cooperation as more open economies can face important sanctions if they do not comply with international standards. Countries which record high public debt are exposed to “debt intolerance” (Reinart and Rogoff, 2003). These countries are less predisposed to comply with international standards given their fiscal profligacy. In the same vein, debt service is expected to increase the probability of Non-Cooperation because high debt service can lead a country to a debt overhang problem14. While GDP growth which measure economic and monetary conditions is viewed as a factor
that reduce the probability of Non-Cooperation. We expect FDI inflows to increases compliance with FATF standards. This could be explained by the evidence that capital is usually invested in sound economies (Yepes, 2011). In sum, the share of agriculture in the GDP is expected to increase compliance regarding international standards. This can be explained by the fact that countries that are heavily dependent on agriculture are vulnerable. It is then difficult to tax subsistence-oriented
13Caliendo and Kopeinig (2008) argue that for the binary treatment case, logit and probit models usually yield similar results. The choice is
not too critical, even though the logit distribution has more density mass in the bounds. Our results are unchanged when we use a logit model.
agriculture. For Bird et al., 2008, agriculture sector is free from taxes for political reasons. Finally, the sign of natural resource rents (as share of GDP) is a priori ambiguous. Indeed, countries which record high natural resource revenue have necessary resources to establish sound institutions and to support their economic activity as well (Brunnschweiler, 2008). This could increase their compliance vis-à-vis FATF Recommendations on AML/CFT. In contrast, high level of natural resource rents can trigger loose fiscal and monetary policies, impeding economic growth (Sachs and Warner, 1995, 1999, 2001; James
and Aadland, 2011; Papyrakis and Gerlagh, 2007). Resource-rich countries generally show a high level
of corruption. In this latter case, natural resource rents reduce compliance with international standards. Moreover, the quality of governance is supposed to reduce the probability of Non-Cooperation. Well governed countries generally meet their commitments regarding international cooperation against IFFs. The overall fit of the regression is reasonable with pseudo R2 around 0.3.
Table 1 : Probit estimates of the propensity score
[1] [2] [3] [4] [5] [6]
Dependent variable: Dummy=1 if a country is Non-Cooperative and 0 otherwise
Lag (IFFs) 0.450*** 0.452*** 0.469*** 0.395*** 0.444*** 0.410*** (0.0649) (0.0677) (0.0717) (0.0626) (0.0619) (0.0665) L.inflation 0.0245* 0.0222* 0.0212 0.0312** 0.0265** 0.0229** (0.0125) (0.0123) (0.0131) (0.0122) (0.0131) (0.0116) Trade -0.00571** -0.00672** -0.00851** -0.00475* -0.00530* -0.00721** (0.00286) (0.00293) (0.00357) (0.00264) (0.00273) (0.00295) L.Public debt 0.00453** 0.00337* 0.00479** 0.00280 0.00450** 0.00452** (0.00207) (0.00201) (0.00213) (0.00222) (0.00206) (0.00208) L.debt service 0.0604*** 0.0607*** 0.0709*** 0.0608*** 0.0604*** 0.0596*** (0.0166) (0.0165) (0.0189) (0.0166) (0.0165) (0.0162) L.GDP growth 0.0235 0.0247 0.0243 0.0227 0.0214 0.0268 (0.0190) (0.0192) (0.0192) (0.0199) (0.0193) (0.0194) L.FDI -0.102*** -0.0871*** -0.0853*** -0.0696** -0.103*** -0.0967*** (0.0354) (0.0336) (0.0327) (0.0289) (0.0372) (0.0352) L.agriculture 0.00944 0.00762 0.0124 0.00347 0.0134 -0.00112 (0.00997) (0.00846) (0.00788) (0.00942) (0.00844) (0.00983) L.natural_rents 0.0362*** 0.0303*** 0.0264** 0.0292*** 0.0392*** 0.0274*** (0.0101) (0.0100) (0.0119) (0.00919) (0.0100) (0.00990) Effectiveness -0.192 (0.245) Law -0.536** (0.271) Voice -0.415* (0.232) Stability -0.468*** (0.132) Regulatory -0.0185 (0.186) Corruption -0.834*** (0.307) Constant -5.163*** -5.238*** -5.251*** -4.954*** -5.144*** -4.906*** (0.673) (0.708) (0.693) (0.669) (0.659) (0.707) N 486 486 486 486 486 486 Pseudo R2 0.309 0.320 0.320 0.331 0.307 0.331
Standard errors in parentheses * p < 0.10, ** p < 0.05, *** p < 0.01
4.3. Results from propensity score
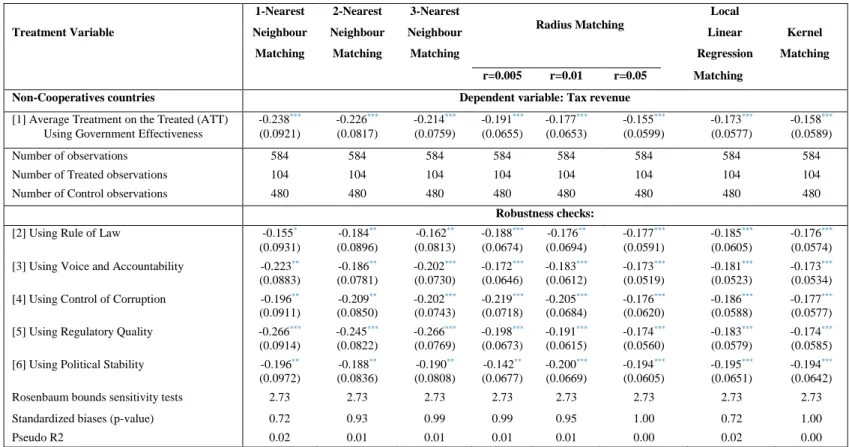
In Table 2, we present the matching results. It then reports the average treatment effect on the treated
(ATT) on domestic tax revenue. The first three columns show the results from nearest neighbor matching (with n=1,2,3). The next three columns report results from radius matching, with radii ranging from 0.005 to 0.05. Finally, we report local linear matching and kernel matching in the last two columns.
All the results are negative and statistically significant at the 1% level. the average ATT is ranging from -0.238 to -0.155, depending on the matching method. Indeed, the adverse effect of Non-Cooperation in terms of tax revenue is ranging from -1.27% of GDP to 1.17% of GDP. The results clearly make evidence that, on average, non-compliance with international standards have a negative and significant impact on domestic tax revenue mobilization in developing countries.
We based on Rosenbaum and Rubin’ (1985) suggestion and compute standardized bias. It’s an indicator which assesses the distance marginal distribution of our control variables (see Lechner, 1999,
Sianesi, 2004; Caliendo et al., 2007; Caliendo and Kopeinig, 2008 for more detail)15.
We also report the pseudo R2 (estimated on the matching sample i.e. on the common support) after matching (see Sianesi, 2004). It evaluates the performance of our control variables in term of explaining the probability of complying with FATF standards. After matching, the pseudo R2 should be “fairly low” (Caliendo and Kopeinig, 2008).
Finally, we check whether our matching estimators are affected by an eventual hidden bias
(Rosenbaum, 2002). For example, our results could be biased if similar countries in terms of observed
factors differ in terms of unobserved factors. We then implement the test of Rosenbaum (2002) which check whether unobserved factors could alter the effect of compliance on domestic tax revenue mobilization.
4.4. Effects on tax structure
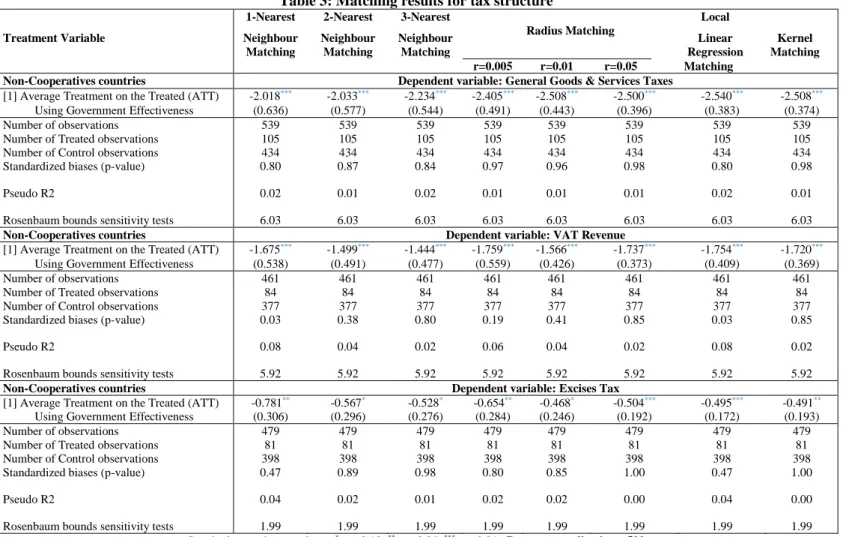
In the previous section, we show that tackling IFFs significantly affect domestic tax revenue mobilization. Nevertheless, this effect could be different on countries’ tax structure. Table 3 sheds light on the fact that the effect of complying or not with FATF standard depends on the type of taxes. The ATT is higher for goods and services taxes (around -2.5% of GDP), followed by VAT (-1.7% of GDP) and excise taxes (-0.7% of GDP slightly). This result can be explained by the fact that over 83% of IFFs from DCs stem from trade mis-invoicing (GFI, 2015). Then, import under-invoicing and export over-invoicing cost a lot of amounts for DCs in terms of tax revenue, especially goods and services taxes, VAT and excise taxes.
4.5. Robustness checks
We check the sensitivity of our results with respect to country’s tax structure. They are also robust to the combination of control variables. Furthermore, the results are unchanged after different heterogeneities tests (the time length of Non-cooperation, the amount of funds that leave illicitly, institutional quality and the level of public debt). They still hold when we consider the existing endogeneity between IFFs and tax revenue (by running Blundell-Bond method). We also check the sensitivity of the results to alternative specifications of probit model. They remained unchanged. Finally,
our results are unchanged when we use alternative matching methods to estimates the treatment effect of Non-cooperating with international standards in terms of combating IFFs in developing countries.
In brief, the results are not sensitives. Countries’ non-compliance with international standards have, on average, significant negative effects on their domestic tax revenue mobilization in our sample of 67 developing countries.
Table 2: Matching results (with Non-Cooperative Countries Dummy as Treatment Variable)
1-Nearest 2-Nearest 3-Nearest
Radius Matching
Local
Treatment Variable Neighbour Neighbour Neighbour Linear Kernel
Matching Matching Matching Regression Matching
r=0.005 r=0.01 r=0.05 Matching
Non-Cooperatives countries Dependent variable: Tax revenue
[1] Average Treatment on the Treated (ATT) -0.238*** -0.226*** -0.214*** -0.191*** -0.177*** -0.155*** -0.173*** -0.158***
Using Government Effectiveness (0.0921) (0.0817) (0.0759) (0.0655) (0.0653) (0.0599) (0.0577) (0.0589)
Number of observations 584 584 584 584 584 584 584 584
Number of Treated observations 104 104 104 104 104 104 104 104
Number of Control observations 480 480 480 480 480 480 480 480
Robustness checks:
[2] Using Rule of Law -0.155* -0.184** -0.162** -0.188*** -0.176** -0.177*** -0.185*** -0.176***
(0.0931) (0.0896) (0.0813) (0.0674) (0.0694) (0.0591) (0.0605) (0.0574)
[3] Using Voice and Accountability -0.223** -0.186** -0.202*** -0.172*** -0.183*** -0.173*** -0.181*** -0.173***
(0.0883) (0.0781) (0.0730) (0.0646) (0.0612) (0.0519) (0.0523) (0.0534)
[4] Using Control of Corruption -0.196** -0.209** -0.202*** -0.219*** -0.205*** -0.176*** -0.186*** -0.177***
(0.0911) (0.0850) (0.0743) (0.0718) (0.0684) (0.0620) (0.0588) (0.0577)
[5] Using Regulatory Quality -0.266*** -0.245*** -0.266*** -0.198*** -0.191*** -0.174*** -0.183*** -0.174***
(0.0914) (0.0822) (0.0769) (0.0673) (0.0615) (0.0560) (0.0579) (0.0585)
[6] Using Political Stability -0.196** -0.188** -0.190** -0.142** -0.200*** -0.194*** -0.195*** -0.194***
(0.0972) (0.0836) (0.0808) (0.0677) (0.0669) (0.0605) (0.0651) (0.0642)
Rosenbaum bounds sensitivity tests 2.73 2.73 2.73 2.73 2.73 2.73 2.73 2.73
Standardized biases (p-value) 0.72 0.93 0.99 0.99 0.95 1.00 0.72 1.00
Pseudo R2 0.02 0.01 0.01 0.01 0.01 0.00 0.02 0.00
Table 3: Matching results for tax structure
1-Nearest 2-Nearest 3-Nearest
Radius Matching
Local
Treatment Variable Neighbour Neighbour Neighbour Linear Kernel
Matching Matching Matching Regression Matching
r=0.005 r=0.01 r=0.05 Matching Non-Cooperatives countries Dependent variable: General Goods & Services Taxes
[1] Average Treatment on the Treated (ATT) -2.018*** -2.033*** -2.234*** -2.405*** -2.508*** -2.500*** -2.540*** -2.508***
Using Government Effectiveness (0.636) (0.577) (0.544) (0.491) (0.443) (0.396) (0.383) (0.374)
Number of observations 539 539 539 539 539 539 539 539
Number of Treated observations 105 105 105 105 105 105 105 105
Number of Control observations 434 434 434 434 434 434 434 434
Standardized biases (p-value) 0.80 0.87 0.84 0.97 0.96 0.98 0.80 0.98
Pseudo R2 0.02 0.01 0.02 0.01 0.01 0.01 0.02 0.01
Rosenbaum bounds sensitivity tests 6.03 6.03 6.03 6.03 6.03 6.03 6.03 6.03
Non-Cooperatives countries Dependent variable: VAT Revenue
[1] Average Treatment on the Treated (ATT) -1.675*** -1.499*** -1.444*** -1.759*** -1.566*** -1.737*** -1.754*** -1.720***
Using Government Effectiveness (0.538) (0.491) (0.477) (0.559) (0.426) (0.373) (0.409) (0.369)
Number of observations 461 461 461 461 461 461 461 461
Number of Treated observations 84 84 84 84 84 84 84 84
Number of Control observations 377 377 377 377 377 377 377 377
Standardized biases (p-value) 0.03 0.38 0.80 0.19 0.41 0.85 0.03 0.85
Pseudo R2 0.08 0.04 0.02 0.06 0.04 0.02 0.08 0.02
Rosenbaum bounds sensitivity tests 5.92 5.92 5.92 5.92 5.92 5.92 5.92 5.92
Non-Cooperatives countries Dependent variable: Excises Tax
[1] Average Treatment on the Treated (ATT) -0.781** -0.567* -0.528* -0.654** -0.468* -0.504*** -0.495*** -0.491**
Using Government Effectiveness (0.306) (0.296) (0.276) (0.284) (0.246) (0.192) (0.172) (0.193)
Number of observations 479 479 479 479 479 479 479 479
Number of Treated observations 81 81 81 81 81 81 81 81
Number of Control observations 398 398 398 398 398 398 398 398
Standardized biases (p-value) 0.47 0.89 0.98 0.80 0.85 1.00 0.47 1.00
Pseudo R2 0.04 0.02 0.01 0.02 0.02 0.00 0.04 0.00
Rosenbaum bounds sensitivity tests 1.99 1.99 1.99 1.99 1.99 1.99 1.99 1.99
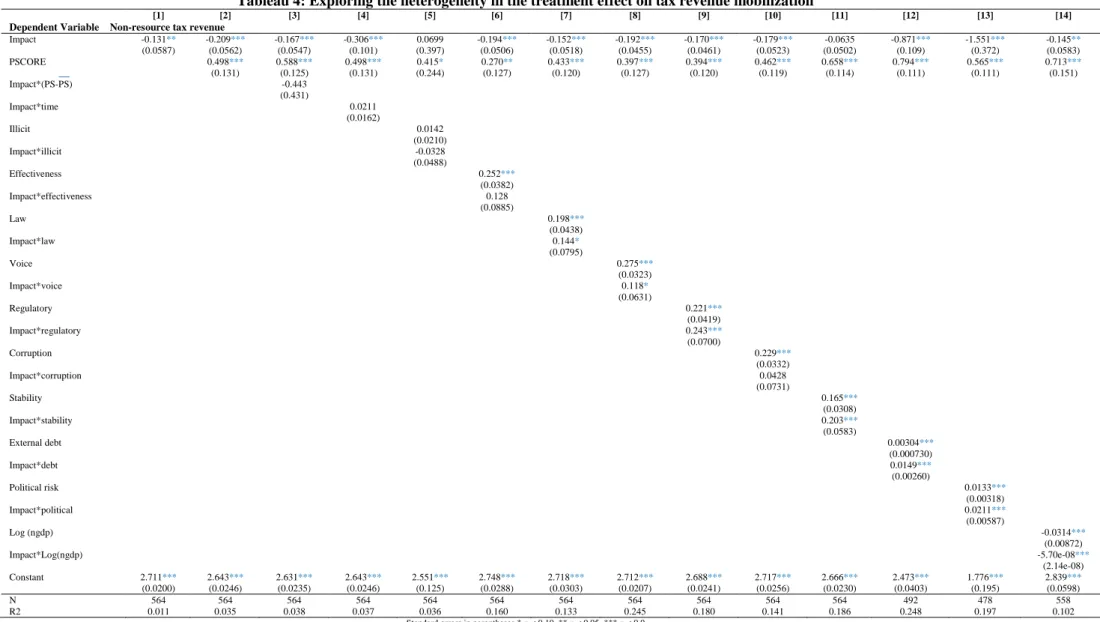
5. Exploring the heterogeneity in the treatment effects
Developing countries generally show notable heterogeneity in their macroeconomic conditions and their institutional framework (Acemuglu, 2002, 2003, 2014, 2016; Easterly, 2002; Wei, 2006; Hameed,
2005; Minea and Tapsoba, 2014; Balima et al., 2017; Lin and Ye, 2009, etc.). It is then important to
explore the heterogeneity feature (Lin and Ye, 2009) of an effective compliance with international standards in terms of combating money laundering and the financing of terrorism.
Following Lin and Ye (2009), we explore some possible sources of heterogeneity (five in total) employing control function approach. We first examine if countries which meet the preconditions of compliance with standards show better performance in terms of tax revenue mobilization. Secondly, we see if the time length since the identification as non-cooperative country mostly affect tax revenue mobilization. Thirdly, we check if the amount of IFFs from a country magnify the negative effect of non-compliance on tax revenue. Fourth, we are considering whether the country’s fiscal space matter in the effectiveness of compliance on tax revenue mobilization. Last but not least, we examine the effects of institutional and governance quality on the link between compliance and tax revenue mobilization.
The estimated treatment effect on tax revenue mobilization (based on control function approach16) is reported in Table 4 below. We report an OLS regression of tax revenue on compliance dummy within the common support. The estimated coefficient represents the mean difference between Non-cooperative and Cooperative countries in terms of tax revenue value. The negative and significant sign indicates that Non-cooperative countries collect less tax revenue than Cooperatives countries. In the second column, we add the estimated propensity score obtained from our baseline probit model as a control function (see Lin and Ye, 2009). The statistically significant coefficient of the propensity score means that there is selectivity in the model. The estimated coefficient after controlling for self-selectivity (coefficient of the compliance dummy) is around -0.209 and is closer to the ATT resulting from various matching methods.
The last eleven columns highlight the heterogeneity feature of our treatment effect. We include an interaction term of the compliance dummy and the difference between the estimated propensity score and its sample average (third column). A statistically significant interaction term indicates the presence of heterogeneity17. As we can observe, the ATT at mean propensity score is negative and statistically
significant. Non-cooperatives countries collect less tax revenue (-1.2% of GDP) than Cooperatives countries. The interaction term is not statistically significant, meaning that there is no evidence that tax revenue mobilization is more effective in countries that meet the preconditions of compliance with international standards. We also find no evidence of effective tax revenue mobilization regarding the time length since the identification of a country as Non-cooperative by FATF.
We further investigate the effect of fiscal space in affecting the effectiveness of tax revenue mobilization (column 12). The positive and significant interaction term show that more indebted
16See Wooldridge (2015) for more details.
countries are subject to broaden their tax base and collect more revenue. The following columns (5-13) underscore the effect of institutional and governance variables in improving tax collection in developing countries. All the interaction terms are positive and significant. This make an evidence of heterogeneity: countries with sound institutions and high quality of governance can mobilize more domestic tax revenue. This positive effect varies from +1% (low political risk) to +1.32% (high regulatory quality) of GDP.
Finally, we explore whether the level of income influence the effectiveness of domestic tax revenue mobilization. The last column of Table 4 indicates that middle-income countries are less predisposed to collect more tax revenue in comparison with low income countries (negative and significant interaction term). This result could be explained by the fact that middle-income countries are less sensitive to comply with FATF Recommendations as they have relatively better institutions.
As we have shown in previous section, Non-Cooperation vis-à-vis FATF Recommendations stifles tax revenue mobilization in DCs. We explore the sensitivity of this result to several additional structural characteristics (Table A9 & Table A10 in the Appendix). In this line, we first account for the phase of the business cycle (whether it is good or bad). This is explained by the fact that the impact of Non-Cooperation on tax revenue mobilization could depend of the business cycle (Woodford, 2011; Ilzetzki et al., 2013; Corsetti et al., 2012; Giavazzi and Pagano, 2000; Giambattista and Pennings, 2017; Debrun
and Kinda, 2016). The effect of Non-Cooperation on tax revenue is not altered by the phase of the
business cycle. Secondly, we account for the fiscal policy stance, following the empirical literature
(Sutherland, 1997; Sargent and Wallace, 1981; Reinart and Rogoff, 2010; Abiad and Ostry, 2005). Our
results are not sensitive to the fiscal policy stance.Thirdly, we consider the saving glut period (Balima
et al., 2017) and our results still are unchanged. Fourthly, our results are not sensitive when we account
for debt intolerance (Reinart et al., 2003), original sin (McCauley and Ho, 2003; Eichengreen et al.,
2003a) and currency mismatch (Goldstein and Turner, 2004). Fifth, our results still hold when we
consider episodes of high inflation (Tanzi, 1997), natural resource curse (Bornhorst et al., 2009; Tanzi;
1992; Gupta, 2007), financial development (Brada et al., 2013), government size (Martins and Veiga,
2014; Chen et al., 2017; Kotera and Okada, 2017) and external financing such as FDI inflows (Demir,
2016) and official development assistance (Burnside and Dollar, 2000; Collier et Dollar, 2001, 2002;
Tableau 4: Exploring the heterogeneity in the treatment effect on tax revenue mobilization
[1] [2] [3] [4] [5] [6] [7] [8] [9] [10] [11] [12] [13] [14]
Dependent Variable Non-resource tax revenue
Impact -0.131** -0.209*** -0.167*** -0.306*** 0.0699 -0.194*** -0.152*** -0.192*** -0.170*** -0.179*** -0.0635 -0.871*** -1.551*** -0.145** (0.0587) (0.0562) (0.0547) (0.101) (0.397) (0.0506) (0.0518) (0.0455) (0.0461) (0.0523) (0.0502) (0.109) (0.372) (0.0583) PSCORE 0.498*** 0.588*** 0.498*** 0.415* 0.270** 0.433*** 0.397*** 0.394*** 0.462*** 0.658*** 0.794*** 0.565*** 0.713*** (0.131) (0.125) (0.131) (0.244) (0.127) (0.120) (0.127) (0.120) (0.119) (0.114) (0.111) (0.111) (0.151) Impact*(PS-PS) -0.443 (0.431) Impact*time 0.0211 (0.0162) Illicit 0.0142 (0.0210) Impact*illicit -0.0328 (0.0488) Effectiveness 0.252*** (0.0382) Impact*effectiveness 0.128 (0.0885) Law 0.198*** (0.0438) Impact*law 0.144* (0.0795) Voice 0.275*** (0.0323) Impact*voice 0.118* (0.0631) Regulatory 0.221*** (0.0419) Impact*regulatory 0.243*** (0.0700) Corruption 0.229*** (0.0332) Impact*corruption 0.0428 (0.0731) Stability 0.165*** (0.0308) Impact*stability 0.203*** (0.0583) External debt 0.00304*** (0.000730) Impact*debt 0.0149*** (0.00260) Political risk 0.0133*** (0.00318) Impact*political 0.0211*** (0.00587) Log (ngdp) -0.0314*** (0.00872) Impact*Log(ngdp) -5.70e-08*** (2.14e-08) Constant 2.711*** 2.643*** 2.631*** 2.643*** 2.551*** 2.748*** 2.718*** 2.712*** 2.688*** 2.717*** 2.666*** 2.473*** 1.776*** 2.839*** (0.0200) (0.0246) (0.0235) (0.0246) (0.125) (0.0288) (0.0303) (0.0207) (0.0241) (0.0256) (0.0230) (0.0403) (0.195) (0.0598) N 564 564 564 564 564 564 564 564 564 564 564 492 478 558 R2 0.011 0.035 0.038 0.037 0.036 0.160 0.133 0.245 0.180 0.141 0.186 0.248 0.197 0.102
6. Concluding Remarks
Our objective was to assess the macroeconomic impact of tackling IFFs on domestic tax revenue mobilization in developing countries. We exploit a large sample of 67 developing countries around the world and use propensity score matching to achieve this objective. Then we implement various matching method including nearest neighbor matching, radius matching, kernel matching, and local linear matching proposed in the literature.
We find a significant difference between countries which comply with international standards in comparing to countries which do not comply. Specifically, tackling IFFs improve domestic revenue mobilization by around 1.2 pp of GDP in a given country. We also shed light on the fact that the negative effect of Non-compliance with FATF Recommendations depends on tax structure. Indeed, this effect is higher for goods and services taxes, followed by VAT and excise taxes, respectively. This effect is robust to many robustness checks as well as to alternative matching estimator.
Furthermore, they still hold when we explore their sensitivity regarding several structural macroeconomic conditions (business cycle, fiscal policy stance, debt intolerance, original sin, currency mismatch, natural resources, government size, saving glut, high inflation and external financing) and political situations (corruption, political stability, political risk, government effectiveness, regulatory quality, rule of law and voice and accountability).
The policy implications which can draw from this study is that developing countries could improve their domestic revenue mobilization by combating IFFs. This is possible if they implement policies to impede IFFs such as compliance vis-à-vis international standards in terms of anti-money laundering and combating the financing of terrorism. They need also to establish sound institutions if they really aim to enhance domestic tax revenue mobilization.
Bibliography:
Aaskoven, L. (2018). Budget institutions and taxation. Public Choice, 174(3-4), 335-349.
Abuzeid, F. (2009). Foreign Aid and the" Big Push" Theory: Lessons from Sub-Saharan Africa. Stanford
Journal of international relations, 11(1), 16-23.
Agbeyegbe, T. D., Stotsky, J., & WoldeMariam, A. (2006). Trade liberalization, exchange rate changes, and tax revenue in Sub-Saharan Africa. Journal of Asian Economics, 17(2), 261-284.
Ajayi, S., & Ndikumana, L. (2015). Scale, Causes and Effect of Capital Flight from Africa. Capital
Flight from Africa: Causes, Effects and Policy Issues, Oxford University Press, Oxford, 1-11.
Alesina, A., & Tabellini, G. (1989). External debt, capital flight and political risk. Journal of
International Economics, 27(3-4), 199-220.
Arezki, R., & Sy, A. (2016). Financing Africa's Infrastructure Deficit: From Development Banking to Long-term Investing. Journal of African Economies, 25(suppl_2), ii59-ii73.
Ayogu, M. D., & Gbadebo-Smith, F. (2014). Governance and illicit financial flows. Capital Flight from
Africa: Causes, Effects and Policy Issues.
Baker, R. W. (2005). Capitalism's Achilles heel: Dirty money and how to renew the free-market system: John Wiley & Sons.
Bird, R. M., Martinez-Vazquez, J., & Torgler, B. (2008). Tax effort in developing countries and high income countries: The impact of corruption, voice and accountability. Economic analysis and
policy, 38(1), 55-71.
Blackburn, K., & Forgues-Puccio, G. F. (2010). Financial liberalization, bureaucratic corruption and economic development. Journal of International Money and Finance, 29(7), 1321-1339. Boyce, J. K. (1992). The revolving door? External debt and capital flight: A Philippine case study. World
Development, 20(3), 335-349.
Boyce, J. K., & Ndikumana, L. (2005). 13. Africa's Debt: Who Owes Whom? Capital flight and capital
controls in developing countries, 334.
Boyce, J. K., & Ndikumana, L. (2012a). Capital Flight from Sub-Saharan African Countries: Updated Estimates, 1970-2010. Polit. Econ. Res. Inst. Inst. Res. Rep., no.
Boyce, J. K., & Ndikumana, L. (2012b). Debt audits and the repudiation of odious debts. Association of
Concerned African Scholars, 87, 36-41.
Brada, J. C., Kutan, A. M., & Vukšić, G. (2013). Capital flight in the presence of domestic borrowing: Evidence from Eastern European economies. World Development, 51, 32-46.
Brunnschweiler, C. N., & Bulte, E. H. (2008). Linking natural resources to slow growth and more conflict. SCIENCE-NEW YORK THEN WASHINGTON-, 320, 616.
Buchanan, B. (2004). Money laundering—a global obstacle. Research in International Business and
Finance, 18(1), 115-127.
Calderón, C., & Servén, L. (2004). The effects of infrastructure development on growth and income
distribution: The World Bank.
Caliendo, M., & Kopeinig, S. (2008). Some practical guidance for the implementation of propensity score matching. Journal of economic surveys, 22(1), 31-72.
Chelliah, R. J., Baas, H. J., & Kelly, M. R. (1975). Tax Ratios and Tax Effort in Developing Countries, 1969-71Pression fiscale et effort fiscal dans les pays en développement, 1969-71Coeficientes y esfuerzo tributarios en los países en desarrollo, 1969-71. Staff Papers, 22(1), 187-205.
Cobham, A. (2014). The impacts of illicit financial flows on peace and security in Africa.
Collier, P., Hoeffler, A., & Pattillo, C. (2004). Africa's exodus: Capital flight and the brain drain as portfolio decisions. Journal of African Economies, 13(suppl_2), ii15-ii54.
Cuddington, J. T. (1986). Capital flight: Estimates, issues, and explanations (Vol. 58): International Finance Section, Department of Economics, Princeton University ….
Cuddington, J. T. (1987a). Capital flight∗. European Economic Review, 31(1-2), 382-388.
Cuddington, J. T. (1987b). Macroeconomic determinants of capital flight: an econometric investigation.
Capital Flight and Third World Debt. Washington, DC: Institute for International Economics,
85-96.
Dev, K., & Curcio, K. (2011). Illicit Financial Flows from Developing Countries: 2000-2009. Global
Devarajan, S., Miller, M. J., & Swanson, E. V. (2002). Goals for development: History, prospects, and
costs: The World Bank.
Dickinson, B. (2014). Illicit Financial Flows and Development. Revue d'économie du développement,
22(HS02), 125-130.
Dooley, M. P. (1996). A survey of literature on controls over international capital transactions. Staff
Papers, 43(4), 639-687.
Easterly, W. (2006). Reliving the 1950s: the big push, poverty traps, and takeoffs in economic development. Journal of Economic Growth, 11(4), 289-318.
Eltony, N. (2002). Measuring tax effort in Arab countries.
Fofack, H., & Ndikumana, L. (2009). Potential gains from capital flight repatriation for sub-Saharan
African countries: The World Bank.
Forstater, M. (2018a). Defining and Measuring Illicit Financial Flows. Global Governance to Combat
Illicit Financial Flows, 12.
Forstater, M. (2018b). Illicit Financial Flows, Trade Misinvoicing, and Multinational Tax Avoidance: The Same or Different?
Friedman, E., Johnson, S., Kaufmann, D., & Zoido-Lobaton, P. (2000). Dodging the grabbing hand: the determinants of unofficial activity in 69 countries. Journal of public economics, 76(3), 459-493. Ghura, M. D. (1998). Tax revenue in Sub-Saharan Africa: Effects of economic policies and corruption:
International Monetary Fund.
Guerguil, M., Mandon, P., & Tapsoba, R. (2017). Flexible fiscal rules and countercyclical fiscal policy.
Journal of Macroeconomics, 52, 189-220.
Gupta, A. S. (2007). Determinants of tax revenue efforts in developing countries: International Monetary Fund.
Hearson, M. (2014). Tax-motivated illicit financial flows: A guide for development practitioners. U4
Issue.
Heckman, J. J., Ichimura, H., & Todd, P. (1998). Matching as an econometric evaluation estimator. The
review of economic studies, 65(2), 261-294.
Hermes, N., & Lensink, R. (2000). Financial system development in transition economies. Journal of
Banking & Finance, 24(4), 507-524.
Holzenthal, F. (2017). Five trends shaping the fight against financial crime. Computer Fraud & Security,
2017(3), 5-9.
Imam, P. A., & Jacobs, D. (2014). Effect of corruption on tax revenues in the Middle East. Review of
Middle East Economics and Finance Rev. Middle East Econ. Fin., 10(1), 1-24.
Integrity, G. F. (2015). Illicit financial flows from developing countries: Washington, DC. Available at
http://www. gfintegrity. org/report/illicit ….
James, A., & Aadland, D. (2011). The curse of natural resources: An empirical investigation of US counties. Resource and Energy Economics, 33(2), 440-453.
Kar, D. (2011a). The Drivers and Dynamics of Illicit Financial Flows from India: 1948-2008. Economic
and Political Weekly (EPW), India, 46(15).
Kar, D. (2011b). An Empirical Study on the Transfer of Black Money from India: 1948-2008. Economic
and Political Weekly, 45-54.
Kar, D. (2011c). Illicit financial flows from the least developed countries: 1990-2008.
Kar, D. (2011d). Mexico: Illicit Financial Flows. Macroeconomic Imbalances, and the Underground
Economy, Global Financial Integrity, Washington DC.
Kar, D. (2012). Mexico: Illicit Financial Flows, Macroeconomic Imbalances, and the Underground Economy.
Kar, D. (2013). Illicit Financial Flows and the Problem of Net Resource Transfers from Africa: 1980-2009.
Kar, D., & Cartwright-Smith, D. (2008). Illicit Financial Flows from Developing Countries, 2002-2006. Global Financial Integrity Report: December.
Kar, D., & Cartwright-Smith, D. (2008). Illicit Financial Flows from Developing Countries: 2002-2006:
Executive Report: Global Financial Integrity, a program of the Center for International Policy.
Kar, D., & Cartwright-Smith, D. (2010). Global Financial Integrity. Illicit Financial Flows from Africa:
Kar, D., & Cartwright-Smith, R. (2008). Recent Capital Flight from Developing Countries 2002-2006.
Washington DC: Global Financial Integrity. Google Scholar.
Kar, D., & Freitas, S. (2011a). Illicit financial flows from developing countries over the decade ending
2009 (Vol. 100): Global Financial Integrity Washington, DC.
Kar, D., & Freitas, S. (2011b). Illicit Financial Flows from Developing Countries over the Decade Ending 2009. Global Financial Integrity.
Kar, D., & Freitas, S. (2013a). Illicit financial flows from china and the role of trade misinvoicing: Center for International Policy.
Kar, D., & Freitas, S. (2013b). Russia: Illicit financial flows and the role of the underground economy. Kar, D., & LeBlanc, B. Illicit Financial Flows from Developing Countries: 2002-2011, year= 2013,
institution= Global Financial Integrity: Technical report.
Kar, D., & LeBlanc, B. (2014). Illicit Financial Flows to and from the Philippines: A Study in Dynamic Simulation, 1960-2011. Global Financial Integrity.
Keynes, J. M. (1936). The general theory of employment, investment, and money. London and New
York, quoted from: https://sites. google. com/site/biblioeconomicus/KeynesJohnMaynard-TheGeneralTheoryOf EmploymentInterestAndMoney. pdf [Accessed 07 Jan 2014].
Khan, M. S., & Haque, N. U. (1985). Foreign borrowing and capital flight: A formal analysis. Staff
Papers, 32(4), 606-628.
Kose, M. A., Kurlat, S., Ohnsorge, F., & Sugawara, N. (2017). A cross-country database of fiscal space: The World Bank.
Lechner, M. (2001). Identification and estimation of causal effects of multiple treatments under the conditional independence assumption Econometric evaluation of labour market policies (pp. 43-58): Springer.
Lehmann, A. (2002). Foreign Direct Investment in Emerging Markets: Income, Repatriations and
Financial Vulnerabillities: International Monetary Fund.
Lensink, R., Hermes, N., & Murinde, V. (1998). The effect of financial liberalization on capital flight in African economies. World Development, 26(7), 1349-1368.
Leuthold, J. H. (1991). Tax shares in developing economies a panel study. Journal of Development
Economics, 35(1), 173-185.
Lin, S., & Ye, H. (2007). Does inflation targeting really make a difference? Evaluating the treatment effect of inflation targeting in seven industrial countries. Journal of monetary economics, 54(8), 2521-2533.
Lin, S., & Ye, H. (2009). Does inflation targeting make a difference in developing countries? Journal
of Development Economics, 89(1), 118-123.
Lotz, J. R., & Morss, E. R. (1967). Measuring “tax effort” in developing countries. Staff Papers, 14(3), 478-499.
Mehlum, H., Moene, K., & Torvik, R. (2006). Institutions and the resource curse. The Economic
Journal, 116(508), 1-20.
Mikkelsen, J. G. (1991). An econometric investigation of capital flight. Applied Economics, 23(1), 73-85.
Minea, A., & Tapsoba, R. (2014). Does inflation targeting improve fiscal discipline? Journal of
International Money and Finance, 40, 185-203.
Miskin, F. S., & Schmidt-Hebbel, K. (2007). Monetary policy under inflation targeting: An introduction.
Central Banking, Analysis, and Economic Policies Book Series, 11, 001-022.
Murphy, K. M., Shleifer, A., & Vishny, R. W. (1989). Industrialization and the big push. Journal of
political economy, 97(5), 1003-1026.
Ndikumana, L., & Boyce, J. K. (2003). Public debts and private assets: explaining capital flight from Sub-Saharan African countries. World Development, 31(1), 107-130.
Ndikumana, L., & Boyce, J. K. (2012a). Capital flight from North African countries. Massachusetts,
Amherst: Political Economy Research Institute, University of Massachusetts.
Ndikumana, L., & Boyce, J. K. (2012b). Rich presidents of poor nations: Capital flight from resource-rich countries in Africa. ACAS Bulletin, 87, 2-7.
Ndikumana, L., Boyce, J. K., & Ndiaye, A. S. (2014). Capital Flight from Africa. Capital Flight from
Africa: Causes, Effects, and Policy Issues, 15.
Nitsch, V. (2016). Trillion dollar estimate: Illicit financial flows from developing countries: Darmstadt Discussion Papers in Economics.
Nkurunziza, J. D. (2012). Illicit financial flows: a constraint on poverty reduction in Africa. ACAS
Bulletin, 87, 15-21.
North, D. C. (2002). Institutions and economic growth: a historical introduction International Political
Economy (pp. 57-69): Routledge.
Olopoenia, R. A. (2000). Capital flight from Uganda, 1971-94: Estimates, causes and consequences.
External debt and capital flight in sub-Saharan Africa, 238.
Papyrakis, E., & Gerlagh, R. (2007). Resource abundance and economic growth in the United States.
European Economic Review, 51(4), 1011-1039.
Pastor Jr, M. (1990). Capital flight from latin America. World Development, 18(1), 1-18.
Pérez, M. F., Brada, J. C., & Drabek, Z. (2012). Illicit money flows as motives for FDI. Journal of
Comparative Economics, 40(1), 108-126.
Quirk, P. J. (1997). Macroeconomic implications of money laundering. Trends in Organized Crime,
2(3), 10-14.
Reinhart, C. M., & Rogoff, K. S. (2009). This time is different: Eight centuries of financial folly: princeton university press.
Reuter, P. (2017). Illicit Financial Flows and Governance: The Importance of Disaggregation: World Bank.
Reuter, P., & Truman, E. M. (2004). Chasing dirty money. Institute for International Economics,
Washington, DC.
Riechel, M. K.-W. (2001). Financial Sector Regulation and Supervision: The Case of Small Pacific
Island Countries: International Monetary Fund.
Rosenbaum, P. R. (2002). Observational studies Observational studies (pp. 1-17): Springer.
Rosenbaum, P. R., & Rubin, D. B. (1983a). Assessing sensitivity to an unobserved binary covariate in an observational study with binary outcome. Journal of the Royal Statistical Society: Series B
(Methodological), 45(2), 212-218.
Rosenbaum, P. R., & Rubin, D. B. (1983b). The central role of the propensity score in observational studies for causal effects. Biometrika, 70(1), 41-55.
Rosenbaum, P. R., & Rubin, D. B. (1985). The bias due to incomplete matching. Biometrics, 103-116. Rosenstein-Rodan, P. (1976). The Theory of the Big Push: Leading Issues in Economic Development,
Oxford: Oxford University Press.
Rosenstein-Rodan, P. N. (1943). Problems of industrialisation of eastern and south-eastern Europe. The
Economic Journal, 53(210/211), 202-211.
Rosenstein-Rodan, P. N. (1961). Notes on the theory of the ‘big push’ Economic Development for Latin
America (pp. 57-81): Springer.
Sachs, J. D., & Warner, A. (1999). Natural resource intensity and economic growth. Development
policies in natural resource economies, 13-38.
Sachs, J. D., & Warner, A. M. (1995). Natural resource abundance and economic growth: National Bureau of Economic Research.
Sachs, J. D., & Warner, A. M. (1997). Sources of slow growth in African economies. Journal of African
Economies, 6(3), 335-376.
Sachs, J. D., & Warner, A. M. (1999). The big push, natural resource booms and growth. Journal of
Development Economics, 59(1), 43-76.
Sachs, J. D., & Warner, A. M. (2001). The curse of natural resources. European Economic Review, 45(4-6), 827-838.
Schneider, F. (2013). The financial flows of transnational crime and tax fraud in OECD countries: what do we (not) know? Public Finance Review, 41(5), 677-707.
SDGs, U. (2015). Transforming our world: The 2030 agenda for sustainable development. Resolution
Adopted by the UN General Assembly, 25.
Sianesi, B. (2004). An evaluation of the Swedish system of active labor market programs in the 1990s.
Review of Economics and Statistics, 86(1), 133-155.
Stotsky, M. J. G., & WoldeMariam, M. A. (1997). Tax effort in sub-Saharan Africa: International Monetary Fund.