HAL Id: hal-01102887
https://hal.sorbonne-universite.fr/hal-01102887
Submitted on 13 Jan 2015HAL is a multi-disciplinary open access archive for the deposit and dissemination of sci-entific research documents, whether they are pub-lished or not. The documents may come from teaching and research institutions in France or abroad, or from public or private research centers.
L’archive ouverte pluridisciplinaire HAL, est destinée au dépôt et à la diffusion de documents scientifiques de niveau recherche, publiés ou non, émanant des établissements d’enseignement et de recherche français ou étrangers, des laboratoires publics ou privés.
Type 2 Diabetes Remission After Gastric Bypass: What
Is the Best Prediction Tool for Clinicians?
Aurélie Cotillard, Christine Poitou, Guillemette Duchâteau-Nguyen, Judith
Aron-Wisnewsky, Jean-Luc Bouillot, Thomas Schindler, Karine Clément
To cite this version:
Aurélie Cotillard, Christine Poitou, Guillemette Duchâteau-Nguyen, Judith Aron-Wisnewsky, Jean-Luc Bouillot, et al.. Type 2 Diabetes Remission After Gastric Bypass: What Is the Best Prediction Tool for Clinicians?. Obesity Surgery, Springer Verlag, 2014, 25 (7), pp.1128-1132. �10.1007/s11695-014-1511-8�. �hal-01102887�
1
Title page
Full title
Type 2 diabetes remission after gastric bypass: what is the best prediction tool for clinicians?
Original contribution
Authors and affiliations
Aurélie Cotillard PhD1,2,3, Christine Poitou MD PhD1,2,3, Guillemette Duchâteau-Nguyen
PhD4, Judith Aron-Wisnewsky MD PhD1,2,3, Jean-Luc Bouillot MD PhD5, Thomas Schindler
PhD4, Karine Clément MD PhD*1,2,3
A Cotillard ([email protected]), C Poitou
([email protected]), J Aron-Wisnewsky ([email protected]) and K
Clément ([email protected])
Institute of Cardiometabolism and Nutrition, ICAN, Assistance Publique Hôpitaux de Paris,
Pitié-Salpêtrière Hospital, 75013, Paris, France
Sorbonne Universités, Université Pierre et Marie Curie-Paris 6, UMR_S U1166, Nutriomics,
75013, Paris, France
INSERM, UMR_S U1166, Nutriomics, 75013, Paris, France
G Duchâteau-Nguyen ([email protected]) and T Schindler
Roche Innovation Center Basel, Pharmaceutical Sciences, 4070, Basel, Switzerland
2
Assistance Publique-Hôpitaux de Paris, Ambroise Paré Hospital, Surgery Department, 92100,
Boulogne-Billancourt, France
Correspondence to
Karine Clément
Institute of Cardiometabolism and Nutrition
Hôpital Pitié-Salpêtrière 75013 Paris [email protected] Tel: 00 33 1 4217 7028 Fax: 00 33 1 42 34 6993 Shortened title
Predicting diabetes remission
Grants or fellowships
Clinical Research Contracts/ Direction of Clinical Research Assistance Publique des
Hôpitaux de Paris (PHRC 02076, CRC Macrophage Infiltration in Human Adipose Tissue,
FIBROTA), the National program “Investissements d’avenir” with the reference
ANR-10-IAHU-05 (National Agency of Research), Fondation pour la Recherche Médicale (FRM),
European Union Metacardis program (FP7). Nutriomics team received a grant from Institut
Roche de Recherche en Médicine Translationnelle.
3
We thank Dr Florence Marchelli and Valentine Lemoine, APHP, Pitié-Salpêtrière, Paris, for
the constitution of the database, Rohia Alili, UPMC, INSERM UMR_S U1166, Paris, for
samples preparation and logistics, and Jean-Philippe Bastard and Soraya Fellahi, Functional
Unit of Inflammatory and Metabolic Bio-markers, Tenon Hospital, Paris, for the
measurement of C-peptide. We also thank Guillemette Ramey, Institut Roche de Recherche
et Médecine Translationnelle, Boulogne-Billancourt, and Ludovic Le Chat, Institute of
Cardiometabolism and Nutrition, Paris, for management of the scientific collaboration
4
Abstract
Purpose
Statistical models and scores have been recently suggested to predict remission of type 2
diabetes after bypass surgery, but their relevance in routine clinical practice still needs
evaluation. Our objective was to assess these methods on a French cohort and to compare
them with other easy-to-use models.
Materials and Methods
We investigated a cohort of 84 diabetic obese subjects who underwent Roux-en-Y gastric
bypass surgery. Diabetes remission one year after surgery was defined based on the American
Diabetes Association criteria. We tested six methods from the literature and four other
models to predict remission of diabetes after bypass surgery using pre-operative bioclinical
parameters. Predictive methods for diabetes remission were assessed using cross-validation
error rates when appropriate.
Results
60% of the subjects had diabetes remission. Models from the literature had high error rates in
our cohort (from 22.6 to 40.5 %), while published simple scoring systems behaved much
better (15.9 and 16.7%). Using other apprehensible models learned on our cohort did not
improve the prediction error (from 17.2 to 19.9%).
Conclusions
We showed that the scoring system DiaRem is easy to use and provide the best prediction
error (15.9%) compared to other methods. We additionally propose a DiaRem score threshold
of ≤ 6 for likely remission of a subject one year after surgery, which may be considered in clinical decision-making.
5
Key words
6
Introduction
Gastric bypass surgery has been shown to improve type 2 diabetes (T2D) condition in severe
obesity [1,2] and is increasingly used worldwide in the purpose of metabolic surgery [3].
Despite its recognized efficacy, operated patients respond differently to the intervention. T2D
remission is observed in 41 to 100% of subjects after bypass surgery and the percentage of
remission depends on the cohort under study as well as on the criteria used to define
remission [4–6]. It is thus important for patients, clinicians and surgeons to identify methods
that accurately predict patients’ outcomes, and to test their relevance in clinical practice.
Attempts have been made to find pre-operative bioclinical parameters associated with T2D
remission or to predict remission based on these parameters. Lower fasting plasma glucose
and HbA1c levels, shorter diabetes duration and persistent insulin secretion (as seen with
higher C-peptide values and absence of insulin therapy), younger age, higher Body Mass
Index (BMI) and lower prevalence of hypertension are common clinical variables that have
been the most frequently found associated with T2D remission [7,8]. Models including
logistic regression, decision trees or specific scoring systems have been used to predict T2D
remission [9–13]. However, the predictive performances of these methods have not been
validated in independent cohorts. They were often evaluated in only one cohort, using various
definitions of T2D remission, and sometimes mixing different surgical procedures. In
addition, most of the prediction errors were computed on the same dataset also used to build
the model, which can lead to an overly optimistic error estimate.
Our purpose here was to assess these available models and scoring systems on a French
cohort of morbidly obese diabetic subjects and compare them with other models built on our
cohort using usual bioclinical parameters associated with T2D remission. We focused on
models that could easily be used by clinicians and that were based on established methods
7
lasso regression [14] or elastic nets [15]. We used a cross-validation estimate of the error rate
8
Materials and Methods
Anthropometric and biochemical parameters
Eighty-four type 2 diabetic subjects with BMI ≥ 35 kg/m2 were recruited in the Department of Nutrition, Center of Reference for Medical and Surgical Care of Obesity, at the Institute of
Cardiometabolism and Nutrition (ICAN), Pitié-Salpêtrière Hospital (Paris, France). All
subjects underwent gastric Roux-en-Y bypass (RYGB) surgery. T2D was defined as fasting
glycemia ≥ 7 mmol/L or upon oral glucose tolerance test diagnostic (ie. glycemia at 120 min > 11mmol/L) or use of any anti-diabetic treatment. The diagnosis of type 1 diabetes was
excluded by the clinical presentation of the diabetes and the absence of documented history
of diabetic ketoacidosis. One year after RYGB, diabetes remission was defined in agreement
with the American Diabetes Association (ADA) criteria of partial remission: no anti-diabetic
drug, glycemia < 7mmol/L and HbA1c < 6.5% [16]. Remission was assessed using the ADA
partial criteria to take into account subjects with overall improvement of their glycemic status
[6]. Blood samples were obtained after 12 hours of fasting prior to surgery and one year after.
Glucose and HbA1c were measured according to standard methods used in routine care at
Pitié-Salpêtrière hospital. Circulating C-peptide was measured using the Architect
immunoassay (Abbot, USA). The ethic committee of the CPP Ile de France 1 approved the
clinical investigations (NCT00476658, NCT01655017, NCT01454232).
Statistical analysis
Six methods from the literature were used: simple logistic and J48 decision tree models from
Hayes et al. [9], two logistic regressions from Dixon et al. [10], and two scoring systems: one
from Lee at al. and the DiaRem score from Still et al. [11,12] (see detail in Supplementary
Information). In addition to those published methods, we applied logistic regression,
9
usually associated with T2D remission: sex, age, BMI, fasting glycemia, HbA1c,
hypertension, T2D duration, insulin therapy, number of anti-diabetic drugs and C-peptide
value [7]. Decision trees and logistic regression hypothesize different kinds of data structures.
Lasso regression, which is based here on logistic regression, allows automatic feature
selection, but does not handle well correlated variables, while elastic nets are able to deal
with them. Specific scoring systems are built from usual statistical models, but are much
simpler to use, with the score being usually incremented when the value of a variable is
below or above a predetermined threshold. More detail is given in Supplementary
Information.
For logistic regression and decision trees a simple stratified 10×10 fold cross-validation was
used to compute the prediction error. When model parameters needed to be estimated, i.e.
thresholds for Lee and Still scoring systems and parameters for lasso regression and elastic
nets, prediction error was computed using a nested stratified 10×10 fold cross-validation
(Supplementary Figure 1). The internal cross-validation was used to estimate the
parameters of the models and the external cross-validation was used to estimate the
prediction error. All statistical analyses were done using the R software [17] and the “party”
10
Results
Bioclinical parameters
Among the 84 diabetic obese subjects who underwent RYGB surgery, 50 (60%) achieved
diabetes remission (DR subjects) one year after surgery whereas 34 (40%) did not (DNR
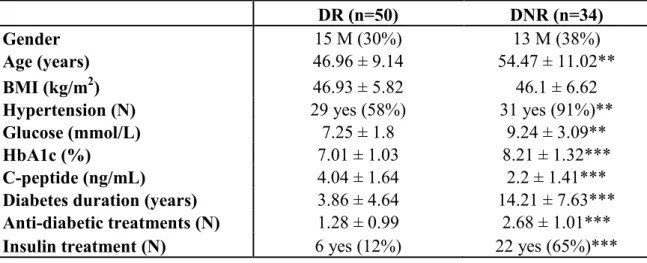
subjects). The patient’s baseline bioclinical parameters are presented in Table 1. Gender and
BMI were not different between groups. However, as expected, DNR subjects were older,
had higher fasting plasma glucose, HbA1c and diabetes duration, as well as lower C-peptide
values. DNR subjects also presented a higher prevalence of hypertension and took more
anti-diabetic drugs at baseline, especially insulin therapy.
Scoring systems performed the best among state of the art methods
We then compared state of the art methods for prediction of T2D remission one year after
surgery on this cohort (Table 2). The Hayes and Dixon models featured good error rates in
their original cohorts (between 12 and 16%) but did not perform well on our French cohort
with error rates between 22.6 and 40.5%. The two scoring systems from Lee and Still did not
provide prediction error in their publications, but we were able to extrapolate information
from the published data (Table 2). Their methods behaved in a satisfactory manner on our
cohort with close cross-validation error rates of 15.9 (DiaRem score, Still et al.) and 16.7%
(Lee et al.). We estimated the cross-validation optimized thresholds, that were 5 for Lee et al.
(remission if score ≥ 5) and 6 for the DiaRem score (remission if score ≤ 6).
Other readable methods do not improve the prediction error
In an attempt to improve the cross-validated prediction error, we also built other easily
interpretable models (logistic regression, decision trees, lasso regression and elastic nets) in
our cohort using bioclinical parameters often associated with T2D remission (see Materials
and Methods) (Table 2). Not surprisingly, we managed to improve the error on the training
11
prediction error and, in the absence of an independent test dataset, we estimated the error by
cross-validation. Here, the four methods displayed a similar behavior with elastic nets
presenting the lowest error rate (17.2%). None of the newly built models achieved better
12
Conclusion
Different models have recently been suggested to predict T2D remission after gastric bypass
surgery, but are not currently used in routine clinical practice to predict patient outcomes.
These models appeared to provide relatively good prediction errors between 12 and 16%
[9,10], but only poorly predicted T2D remission one year after RYGB surgery in our cohort
of 84 French diabetic obese subjects. This might be due to differences in the criteria used for
T2D remission: Dixon et al. solely based the definition on HbA1c value after surgery,
independently of glucose level or the use of anti-diabetic treatment [10]. Significantly higher
error rates in additional cohorts can be expected when error rates were not estimated by
cross-validation or on a separate test dataset. Hayes et al. indeed mentioned that they used
cross-validation for their variable selection, but not for their error rate computation [9].
Specifically, in the case of insulin therapy, their J48 decision tree predicts non-remission of
T2D for pre-operative fasting glycemia below 16.4 mmol/L. Since elevated fasting glycemia
is usually associated with non-remission [7], this prediction seems counter-intuitive and could
reflect overfitting of the data.
Two scoring systems have also been recently proposed by Still et al. (DiaRem score) and Lee
et al. to estimate the likelihood of T2D remission [11,12]. Although these scores were tested
in several cohorts, no threshold for prediction or a prediction error estimate was provided in
the original publications and we extrapolated information from the published data. The error
for the DiaRem score was lower in the original publication [12] compared to Lee’s (19.4% vs
27.3%) but it had been estimated from the training dataset, while Lee’s score error was
estimated from a test dataset, which makes them difficult to compare. In addition, Lee et al.
excluded subjects with low C-peptide values from their protocol, which may have enriched
the dataset for subjects who were more difficult to classify [11]. Interestingly, these scoring
13
error rates (15.9 and 16.7%) when predicting remission one year after surgery according to
the ADA partial criteria [16]. This means that out of 100 patients, we can obtain an accurate
prediction for 84 of them. However, the DiaRem score from Still et al. requires easily
accessible clinical information (age, HbA1c and anti-diabetic treatment), while the score
from Lee et al. might be more difficult to obtain. This score requires age and BMI, but also
diabetes duration which is frequently self-reported and difficult to assess, and C-peptide
which is not always measured in routine care. Our paper brings additional information by
providing a threshold for the DiaRem score, recommending to predict T2D remission of a
subject one year after bypass surgery for a DiaRem score below or equal to 6. We hope that
this threshold may be useful in clinical practice, and it would be interesting to confirm its
relevance in cohorts where the DiaRem score was already applied [12,20] and in others from
different countries.
It should be noted that we did not manage to improve the prediction error using other
classical methods that would be easy to use for clinicians. For example, current methods
often fail in subsets of subjects who resolve their diabetes despite very high pre-operative
HbA1c and the use of insulin therapy, most of them even achieving complete remission
according to the ADA criteria (glycemia < 5.6 mmol/L, HbA1c < 6%) [16]. Some other
crucial parameters, such as compliance to therapy, could partly explain such situations but
remain difficult to quantify properly.
We should point however to a few caveats of our approach. Firstly, the number of patients is
relatively small. Secondly, we focused on T2D remission one year after bypass surgery, but it
would be interesting to assess how these methods behave to predict longer term remission
[5], as well as for different bariatric surgery techniques. In addition to that, only easily
interpretable models were used, while more sophisticated methods might be needed to further
14
overfitting control and non-linear separation, or random forests, which combine multiple
decision trees in the hope of obtaining a better predictor, might be useful.
Within the limitations of the study, data suggest that a DiaRem Score below or equal to 6
15
Conflict of Interest
16
Informed Consent
17
Human and Animal Rights
All procedures performed in studies involving human participants were in accordance with
the ethical standards of the institutional and/or national research committee and with the 1964
18
References
1. Ferchak CV, Meneghini LF. Obesity, bariatric surgery and type 2 diabetes--a systematic review. Diabetes Metab. Res. Rev. 2004;20:438‑445.
2. Mingrone G, Panunzi S, De Gaetano A, Guidone C, Iaconelli A, Leccesi L, et al. Bariatric surgery versus conventional medical therapy for type 2 diabetes. N. Engl. J. Med.
2012;366:1577‑1585.
3. Buchwald H. The Evolution of Metabolic/Bariatric Surgery. Obes Surg. 2014;1‑10.
4. Pories WJ, Swanson MS, MacDonald KG, Long SB, Morris PG, Brown BM, et al. Who would have thought it? An operation proves to be the most effective therapy for adult-onset diabetes mellitus. Ann. Surg. 1995;222:339‑350; discussion 350‑352.
5. Davies SW, Efird JT, Guidry CA, Penn RI, Sawyer RG, Schirmer BD, et al. Long-term diabetic response to gastric bypass. J. Surg. Res. 2014;
6. Pournaras DJ, Aasheim ET, Søvik TT, Andrews R, Mahon D, Welbourn R, et al. Effect of the definition of type II diabetes remission in the evaluation of bariatric surgery for metabolic disorders. Br J Surg. 2012;99:100‑103.
7. Adams ST, Salhab M, Hussain ZI, Miller GV, Leveson SH. Preoperatively determinable factors predictive of diabetes mellitus remission following Roux-en-Y gastric bypass: a review of the literature. Acta Diabetol. 2013;50:475‑478.
8. Wang G-F, Yan Y-X, Xu N, Yin D, Hui Y, Zhang J-P, et al. Predictive Factors of Type 2 Diabetes Mellitus Remission Following Bariatric Surgery: a Meta-analysis. Obes Surg. 2014;
9. Hayes MT, Hunt LA, Foo J, Tychinskaya Y, Stubbs RS. A model for predicting the resolution of type 2 diabetes in severely obese subjects following Roux-en Y gastric bypass surgery. Obes Surg. 2011;21:910‑916.
10. Dixon JB, Chuang L-M, Chong K, Chen S-C, Lambert GW, Straznicky NE, et al. Predicting the glycemic response to gastric bypass surgery in patients with type 2 diabetes. Diabetes Care. 2013;36:20‑26.
11. Lee W-J, Hur KY, Lakadawala M, Kasama K, Wong SKH, Chen S-C, et al. Predicting success of metabolic surgery: age, body mass index, C-peptide, and duration score. Surg Obes Relat Dis. 2013;9:379‑384.
12. Still CD, Wood GC, Benotti P, Petrick AT, Gabrielsen J, Strodel WE, et al. Preoperative prediction of type 2 diabetes remission after Roux-en-Y gastric bypass surgery: a
retrospective cohort study. The Lancet Diabetes & Endocrinology. 2014;2:38‑45.
13. Ramos-Levi AM, Matia P, Cabrerizo L, Barabash A, Sanchez-Pernaute A, Calle-Pascual AL, et al. Statistical models to predict type 2 diabetes remission after bariatric surgery. J
19
14. Tibshirani R. Regression shrinkage and selection via the lasso. Journal of the Royal Statistical Society Series B. 1996;58:267‑288.
15. Zou H, Hastie T. Regularization and Variable Selection via the Elastic Net. Journal of the Royal Statistical Society Series B. 2005;67:301‑320.
16. Buse JB, Caprio S, Cefalu WT, Ceriello A, Prato SD, Inzucchi SE, et al. How Do We Define Cure of Diabetes? Dia Care. 2009;32:2133‑2135.
17. R Core Team. R: A Language and Environment for Statistical Computing [Internet]. 2014. Disponible sur: http://www.R-project.org/
18. Hothorn T, Hornik K, Zeileis A. Unbiased recursive partitioning: A conditional inference framework. Journal of Computational and Graphical Statistics. 2006;15:651‑74.
19. Friedman J, Hastie T, Tibshirani R. Regularization Paths for Generalized Linear Models via Coordinate Descent. J Stat Softw. 2010;33:1‑22.
20. Aminian A, Brethauer SA, Kashyap SR, Kirwan JP, Schauer PR. DiaRem score: external validation. Lancet Diabetes Endocrinol. 2014;2:12‑13.
21. Benjamini Y, Hochberg Y. Controlling the False Discovery Rate: A Practical and Powerful Approach to Multiple Testing. Journal of the Royal Statistical Society. Series B
20
Tables
Table 1: Comparison between DNR and DR subjects
DR (n=50) DNR (n=34)
Gender 15 M (30%) 13 M (38%)
Age (years) 46.96 ± 9.14 54.47 ± 11.02**
BMI (kg/m2) 46.93 ± 5.82 46.1 ± 6.62
Hypertension (N) 29 yes (58%) 31 yes (91%)**
Glucose (mmol/L) 7.25 ± 1.8 9.24 ± 3.09**
HbA1c (%) 7.01 ± 1.03 8.21 ± 1.32***
C-peptide (ng/mL) 4.04 ± 1.64 2.2 ± 1.41***
Diabetes duration (years) 3.86 ± 4.64 14.21 ± 7.63***
Anti-diabetic treatments (N) 1.28 ± 0.99 2.68 ± 1.01***
Insulin treatment (N) 6 yes (12%) 22 yes (65%)***
Data are mean±sd. DR: subjects who resolved their diabetes one year after surgery. DNR:
subjects who did not resolve their diabetes. N: number. M: males. Groups were compared
with Student t-tests for quantitative parameters and Fisher exact tests for qualitative
parameters. P-values were adjusted for multiple testing using the Benjamini-Hochberg
21
Table 2: Prediction errors of the different models in percentage
Train error Test error
Cross-validation error Hayes - SL 13.4 31 Hayes - J48DT 12.6 34.5 Dixon - LR6 16 40.5 Dixon - LR7 12 22.6 Lee - Score 27.3 a 16.7 16.7 Still - Score 19.4 b 15.5 15.9 LR 7.1 19.9 DT 13.1 17.6 Lasso 14.3 18.9 EN c 13.1 17.2
Train error is the error from the original cohort. Test error is the error on our French cohort
with no cross-validation. Cross-validation error is the error on our cohort using stratified
10×10 fold cross-validation. The 3 best results per column are in bold font. SL: simple
logistic. J48DT: J48 decision tree. LR6: logistic regression for prediction of HbA1c ≤ 6 one year after surgery. LR7: logistic regression for prediction of HbA1c ≤ 7 one year after surgery. LR: logistic regression. DT: decision trees. EN: elastic nets. aDeduced from the data
provided in the paper using the best possible cut-off on the test dataset (remission is predicted
if score ≥ 5). bDeduced from the data provided in supplementary material for the partial remission definition at 14 months using the best cut-off, but with the limitation that the score
was already grouped by ranges (remission is predicted if score ≤ 7). cAll variables were included in the model.