HAL Id: hal-02295608
https://hal.archives-ouvertes.fr/hal-02295608
Submitted on 25 Sep 2019
HAL is a multi-disciplinary open access
archive for the deposit and dissemination of
sci-entific research documents, whether they are
pub-lished or not. The documents may come from
teaching and research institutions in France or
abroad, or from public or private research centers.
L’archive ouverte pluridisciplinaire HAL, est
destinée au dépôt et à la diffusion de documents
scientifiques de niveau recherche, publiés ou non,
émanant des établissements d’enseignement et de
recherche français ou étrangers, des laboratoires
publics ou privés.
Mid-mantle deformation inferred from seismic
anisotropy
James Wookey, J-Michael Kendall, Guilhem Barruol
To cite this version:
James Wookey, J-Michael Kendall, Guilhem Barruol. Mid-mantle deformation inferred from
seis-mic anisotropy. Nature, Nature Publishing Group, 2002, 415, pp.777-780. �10.1038/415777a�.
�hal-02295608�
...
Mid-mantle deformation inferred
from seismic anisotropy
James Wookey*, J.-Michael Kendall* & Guilhem Barruol²
* School of Earth Sciences, University of Leeds, Woodhouse Lane, Leeds LS2 9JT, UK
² CNRS, Universite Montpellier, 34095 Montpellier, Cedex 05, France
... With time, convective processes in the Earth's mantle will tend to align crystals, grains and inclusions. This mantle fabric is detect-able seismologically, as it produces an anisotropy in material propertiesÐin particular, a directional dependence in seismic-wave velocity. This alignment is enhanced at the boundaries of the mantle where there are rapid changes in the direction and magnitude of mantle ¯ow1, and therefore most observations of
anisotropy are con®ned to the uppermost mantle or lithosphere2,3
and the lowermost-mantle analogue of the lithosphere, the D0 region4. Here we present evidence from shear-wave splitting
measurements for mid-mantle anisotropy in the vicinity of the 660-km discontinuity, the boundary between the upper and lower mantle. Deep-focus earthquakes in the Tonga±Kermadec and New Hebrides subduction zones recorded at Australian seismo-graph stations record some of the largest values of shear-wave splitting hitherto reported. The results suggest that, at least locally, there may exist a mid-mantle boundary layer, which could indicate the impediment of ¯ow between the upper and lower mantle in this region.
Seismic anisotropy in the upper 200 km of the Earth's mantle is primarily attributed to the preferred alignment of olivine crystals which have deformed by dislocation creep5. The origin of
aniso-tropy at greater depths is more speculative, but there is evidence for anisotropy in the transition zone in some regions6±8, but not in
others9,10. In an effort to reconcile discrepancies in global velocity
models derived from body-wave travel times and normal-mode observations, Montagner and Kennett11 allowed both anisotropy
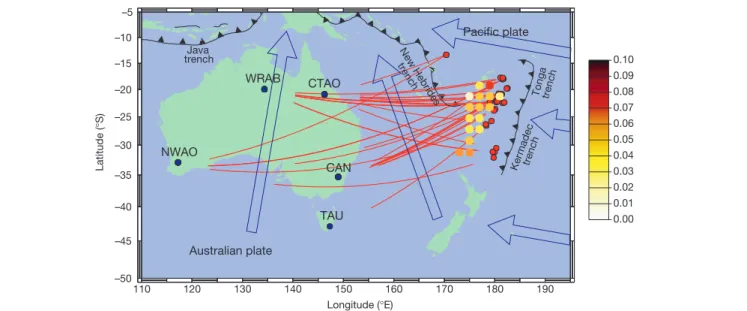
and attenuation in a joint inversion of these data sets. Their ®nal model shows signi®cant levels of anisotropy in the uppermost and lowermost mantle, but also in the vicinity of the 660-km disconti-nuity (hereafter referred to as the `660'). This motivated an investigation of mid-mantle anisotropy on a regional scale. Here we investigate shear-wave splitting in deep-focus events that image a region below the Australian plate (Fig. 1).
Stations in Australia are ideal for investigating near-source anisotropy, as studies have shown that they exhibit very little, if any, receiver-side shear-wave splitting12±14 (see Supplementary
Information for a summary of observations). For example, 52 SKS measurements with good azimuthal coverage at the station CAN (see Fig. 1 for location) show that shear waves that are travelling nearly vertically are not split while crossing the Australian lithosphere beneath this station12. In contrast, we ®nd that
deep-focus events from the Tonga±Kermadec and New Hebrides sub-duction zones show very large degrees of shear-wave splitting at this and four other Australian stations (Fig. 2), suggesting anisotropy deeper in the mantle, away from the receiver.
We made splitting measurements from 92 events, at epicentral distances of 248 to 598 from the Australian stations, using the method of ref. 15, which estimates the time separation between the fast and slow shear wave, dt, and the polarization of the fast shear wave at the receiver, f. This method attempts to remove the anisotropy-induced splitting by minimizing the shear-wave signal in the direction perpendicular to the polarization direction of the shear wave before entering the anisotropic region16. A grid search
over dt and f is used to estimate the splitting parameters, and a statistical F-test is used to assess errors. The correction for splitting
should produce a linear S-wave particle motion, thus providing a further measure of con®dence in the results. Of 164 splitting measurements, 66 gave very convincing resultsÐthat is, the error in dt is less than 0.5 s, and the error in f is less than 108. In an effort to isolate mid-mantle anisotropy, we further restricted our study to the 30 events deeper than 300 km which gave 35 high-quality splitting estimates (see Supplementary Information; 75% of the events are greater than 500 km deep). The magnitude of splitting for these events ranges from 0.6 s to 7.1 s. Many measurements show splitting in excess of 4 s (Fig. 2), and suggest either very high degrees of localized anisotropy or wave propagation through a more moderately anisotropic region of large extent. It should be noted that the maximum free-surface incidence angle for our data set is less than 328, thus avoiding the effects of waveform distortion due to free- and near-surface coupling.
The azimuthal ray coverage at the midpoint between source and receiver spans a 608 region centred around 2608. The polariza-tion of the fast shear wave is roughly aligned with the transverse component, but there is some scatter in this (back-azimuth -f = 1088 6 318). Although the azimuthal ray coverage is not complete, the results suggest a transversely isotropic symmetry with the symmetry axis in the vertical plane, perpendicular to the ray direction. For horizontally travelling rays, this would imply a horizontally polarized fast shear wave (that is, SH leads SV).
To help guide interpretations of these observations, we model wave propagation through an anisotropic slab region using ray theory17. The linear slab extends to a depth of 660 km and has a 608
dip angle. Anisotropy in the deeper parts of the slab may be due to the alignment of metastable olivine18, or the preferred alignment of
akimotoite, a polymorph of enstatite, which may exist under slab pressures and temperatures19. Alternatively, transition-zone
defor-mation above the slab may align its dominant minerals, wadsleyite and ringwoodite. Finally, anisotropy below the `660' may be due to the alignment of lower-mantle minerals such as perovskite, periclase and/or stishovite, all of which are highly anisotropic20. Perovskite is
the most likely candidate as it constitutes nearly 80% of the minerals in this region, but an alignment mechanism for perovskite is still uncertain21,22. Both experimental measurements23and
®rst-princi-ples calculations24,25suggest that perovskite is only mildly
orthor-hombic in symmetry and can be well approximated as being transversely isotropic. Unfortunately, these elastic constants predict that for horizontally travelling waves, vertically polarized shear waves are faster than horizontally polarized shear waves. Alterna-tively, the anisotropy may not be due to crystal alignment, but rather to the horizontal alignment of tabular inclusions, as has been suggested for the lowermost mantle4.
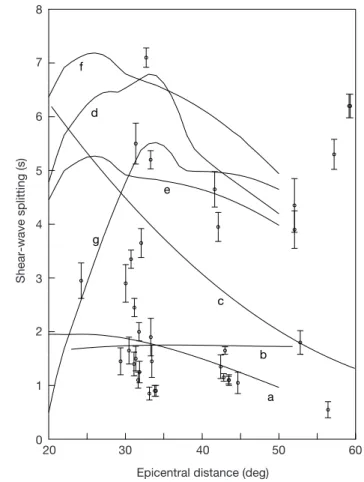
Figure 2 compares predicted splitting for a variety of models and the observed splitting values. Consistent with the observations, the anisotropy is constrained to have a fast horizontally polarized shear wave. Very high degrees of anisotropy, distributed throughout the slab, are required to explain the observations with slab anisotropy. It is virtually impossible to explain 6 seconds of splitting in the deepest events (.600 km) with slab anisotropy. An absence of slab aniso-tropy is further suggested from an analysis of depth-dependent splitting for vertically travelling shear waves beneath Tonga, which shows no evidence of azimuthal anisotropy below 400 km (ref. 10). A lack of SKS splitting does not necessarily mean that the uppermost mantle beneath the receivers is isotropic. Transverse isotropy any-where in the mantle will not split vertically polarized SKS phases, but will split an arbitrarily polarized S wave. However, Fig. 2 shows that the splitting for an uppermost mantle with 4% anisotropy26
cannot explain the results. Similarly, they cannot be explained with anisotropy con®ned to the transition zone, a conclusion reinforced by the fact that ringwoodite, the dominant mineral between depths of 520 and 660 km, is thought to be only very mildly anisotropic20. It
is dif®cult to explain the splitting with combinations of transverse isotropy in the uppermost mantle and in transition-zone regions. A problem with models where anisotropy is con®ned to the upper mantle is that they predict very large amounts of splitting at near offsets and little at large offsets, an effect not seen in the data. Such anisotropy may contribute to the splitting, but cannot explain the observations.
The modelling shows that moderate amounts of anisotropy in the lower mantle generate large amounts of splitting owing to long horizontal ray-paths below the `660' at these epicentral distances. Assuming that the anisotropy is con®ned to a layer 100 km below the `660', the average anisotropy magnitude is 3.0%. However, Fig. 1 shows that there is spatial variation in this estimate, with the largest
Australian plate Java trench Tonga trench Ker madec trench Pacific plate 110 120 130 140 150 Longitude (°E) Latitude ( ° S) 160 170 180 190 –50 –45 –40 –35 –30 –25 –20 –15 –10 –5 0.10 0.09 0.08 0.07 0.06 0.05 0.04 0.03 0.02 0.01 0.00 CAN TAU NWAO WRAB CTAO New Hebrides trench
Figure 1 Event±station combinations used to study mid-mantle anisotropy. Small red dots show events; blue dots show stations; red swaths show corresponding lower-mantle ray-paths. Subduction zones and directions of absolute plate motion are also indicated. The larger circles near the events are colour-coded averages (minimum 3 hits) over a 28 radius surface region of the anisotropy magnitude required to explain observed
shear-wave splitting, plotted at the point a ray enters the lower mantle. This is calculated assuming that the anisotropy is distributed throughout a 100-km-thick layer just below the 660-km discontinuity (the `660'). Colour scale bar to the right indicates the magnitude of the anisotropy (fractional difference between slow and fast shear wave velocity).
magnitude of anisotropy lying in the northernmost and southern-most regions. This north±south variation is also seen in the raw splitting values, with a large range of splitting near 208 S (see Supplementary Information). Alternatively, the magnitude of the anisotropy may grade into the isotropic mantle over a few hundred kilometres, thereby requiring even less anisotropy. Figure 2 also shows that it is dif®cult accurately to constrain the anisotropy to a layer immediately beneath the `660'. In fact, anisotropy between depths of 760 km and 900 km explains the trend in the large residuals quite well. In summary, the modelling shows that there must be anisotropy below the `660', but not deeper than 900 km, and there may or may not be a contribution from anisotropy above the `660'.
Although there must be anisotropy in the lower mantle, it may still be slab related. Numerical simulations have shown that large deviatoric stresses are transmitted into the lower mantle when a rigid slab encounters an increase in viscosity at the `660' (ref. 27). Large stresses increase the likelihood of dislocation creep mechan-isms being active. With time, the associated strains will induce alignment in a broad region below the slab. Perovskite may therefore align with a rotated symmetry axis conformal to the shape of this region. Aligned perovskite rotated more than 308 predicts SH waves faster than SV wave for horizontally travelling S waves.
Another possibility is that the anisotropy is associated with slab material which has broadened and pooled at the `660', before sinking into the deeper mantle. This may be slab material horizontally emplaced on the `660', but our modelling shows that a signi®cant portion of the slab must be well below a depth of 660 km. An alternative is the idea that eclogitic oceanic crust delaminates from the slab, residing in a `megalith' just below the `660' (ref. 28). This thin crustal layer may thicken appreciably with long-lived subduction into the high-viscosity lower mantle29.
Furthermore, it has been argued that basalt may be near its solidus in the uppermost and lowermost parts of the lower mantle30. Thus the anisotropy may be due to the preferred
alignment of melt inclusions (a mechanism which generates anisotropy very effectively4), which results from shear deformation
at the `660'.
Supporting evidence for the anisotropy being con®ned to a broad region around the base of the slab comes from recent tomographic images for both P and S waves for the Tonga±Kermadec region31.
This raises the question of to what degree tomographic images obtained assuming isotropy are in¯uenced by anisotropy. Tomo-graphic images also show along-strike variations in the Tonga±
b e f d c a g 8 7 6 5 3 4 2 1 0 20 30 40
Epicentral distance (deg)
Shear-wave splitting (s)
50 60
Figure 2 Shear-wave splitting versus epicentral distance. Circles with error bars show observations and estimated uncertainty. Solid lines show predictions for a 500-km-deep source in models with a fast horizontally polarized shear wave: trace a, 4% transverse-isotropy in the uppermost 210 km of upper mantle; b, 5% antransverse-isotropy in a subducted slab that extends to a depth of 660 km; c, 5% anisotropy con®ned to a 100-km-thick layer immediately beneath the `660'; d, anisotropy that grades from 3% to 1% between the `660' and 900 km; e, 2% anisotropy in 100-km-thick layers above and below the `660', and 1% anisotropy in a layer between 760 km and 900 km; f, 4% anisotropy in the uppermost 210 km, 2% anisotropy in 100-km-thick layers above and below the `660', and 1% anisotropy in a layer between 760 km and 900 km; g, anisotropy that grades from 2.5% to 1.5% in a layer between 760 km and 900 km. Although there is some ambiguity as to the best model, only models with anisotropy in the lower mantle can explain the large splitting observations. 660 km discontinuity Subducting slab 660 km discontinuity Subducting slab Subducting slab 660 km discontinuity ?? b c a
Figure 3 Three models for anisotropy below the 660-km discontinuity. a, An anisotropic mid-mantle boundary layer near the `660' that may or may not be a global feature of this boundary. Our results suggest that the magnitude of anisotropy in such a layer must vary
laterally quite signi®cantly. b, Slab forces on the surrounding mantle lead to strain-induced anisotropy. c, Anisotropy associated with slab material pooling in the lower mantle.
Kermadec slab morphology, with a signi®cant change in slab dip near 258 (ref. 32). We note that it is from this region that we observe the smallest amounts of splitting.
Although the precise origin of the anisotropy is not clear at present, our observations and linked modelling show evidence for anisotropy in the uppermost lower mantle beneath the eastern part of the Australian plate. The anisotropy is probably inhomogeneous, as there appears to be an appreciable north±south variability in its magnitude. There must be large strains in this region, which are probably related to slab interaction with the sharp increase in viscosity at this boundary. Figure 3 summarizes the potential mechanisms that we propose. Our results may help describe to what extent there is an impediment of ¯ow at this boundary between the upper and lower mantle. M
Received 5 September; accepted 31 December 2001.
1. Montagner, J.-P. Where can seismic anisotropy be detected in the Earth's mantle? In boundary layers .... Pure Appl. Geophys. 151, 223±256 (1998).
2. Silver, P. G. Seismic anisotropy beneath the continents: Probing the depths of geology. Annu. Rev. Earth Planet Sci. 24, 385±432 (1996).
3. Savage, M. K. Seismic anisotropy and mantle deformation: What have we learned from shear wave splitting? Rev. Geophys. 37, 65±106 (1999).
4. Kendall, J.-M. & Silver, P. G. in The Core-Mantle Boundary Region (eds Gurnis, M., Wysession, M., Knittle, E. & Buffett, B.) 97±118 (Geodynamics series 28, American Geophysical Union, Washington DC, 1998).
5. Karato, S. & Wu, P. Rheology of the upper mantle: A synthesis. Science 260, 771±778 (1993). 6. Vinnik, L. P. & Montagner, J.-P. Shear wave splitting in the mantle Ps phase. Geophys. Res. Lett. 23,
2449±2452 (1996).
7. Vinnik, L. P., Chevrot, S. & Montagner, J.-P. Seismic evidence of ¯ow at the base of the upper mantle. Geophys. Res. Lett. 25, 1995±1998 (1998).
8. Tong, C., Gudmundsson, O. & Kennett, B. L. N. Shear wave splitting in refracted waves returned from the upper mantle transition zone beneath northern Australia. J. Geophys. Res. 99, 15783±15797 (1994).
9. Fouch, M. J. & Fischer, K. M. Mantle anisotropy beneath northwest Paci®c subduction zone. J. Geophys. Res. 101, 15987±16002 (1996).
10. Fischer, K. & Wiens, D. The depth distribution of mantle anisotropy beneath the Tonga subduction zone. Earth Planet. Sci. Lett. 142, 253±260 (1996).
11. Montagner, J.-P. & Kennett, B. L. N. How to reconcile body-wave and normal-mode reference Earth models. Geophys. J. Int. 125, 229±248 (1996).
12. Barruol, G. & Hoffmann, R. Upper mantle anisotropy beneath Geoscope stations. J. Geophys. Res. 104, 10757±10773 (1999).
13. Clitheroe, G. & Van der Hilst, R. in Structure and Evolution of the Australian Continent (ed. Braun, J. et al.) 73±78 (Geodynamics series 28, American Geophysical Union, Washington DC, 1998).
14. OÈzalaybey, S. & Chen, W. Frequency dependent analysis of SKS/SKKS waveforms observed in Australia: evidence for null birefringence. Phys. Earth Planet. Inter. 114, 197±210 (1999). 15. Silver, P. G. & Chan, W. W. Implications for continental structure and evolution from seismic
anisotropy. Nature 335, 34±39 (1988).
16. Wolfe, C. J. & Silver, P. G. Seismic anisotropy of oceanic upper mantle: Shear-wave splitting methodologies and observations. J. Geophys. Res. 103, 749±771 (1998).
17. Kendall, J.-M. & Thomson, C. J. Seismic modelling of subduction zones with inhomogeneity and anisotropy, I: Teleseismic P-wavefront geometry. Geophys. J. Int. 112, 39±66 (1993).
18. Kirby, S. H., Durham, W. B. & Stern, L. A. Mantle phase changes and deep-earthquake faulting in subducting lithosphere. Science 252, 216±225 (1991).
19. Anderson, D. L. Thermally induced phase changes, lateral heterogeneity of the mantle, continental roots and deep slab anomalies. J. Geophys. Res. 92, 13968±13980 (1987).
20. Mainprice, D., Barruol, G. & IsmaõÈl, W. B. in Earth's Deep Interior: Mineral Physics and Tomography from the Atomic to the Global Scale (eds Karato, S., Fortre, A., Masters, T. G. & Stixrude, L.) 237±264 (Geophysical Monographs 117, American Geophysical Union, Washington DC, 2000). 21. Karato, S., Dupas-Bruzek, C. & Rubie, D. Plastic deformation of silicate spinel under the
transition-zone conditions of the Earth's mantle. Nature 395, 266±269 (1998).
22. Meade, C. P., Silver, P. G. & Kaneshima, S. Laboratory and seismological observations of lower mantle isotropy. Geophys. Res. Lett. 22, 1293±1296 (1995).
23. Yeganeh-Haeri, A. Synthesis and re-investigation of the elastic properties of single-crystal magnesium silicate perovskite. Phys. Earth Planet. Inter. 87, 111±121 (1994).
24. Oganov, A. R., Brodholt, J. P. & Price, G. D. The elastic constants of MgSiO3perovskite at pressures
and temperatures of the Earth's mantle. Nature 411, 934±937 (2001).
25. Stixrude, L. in The Core-Mantle Boundary Region (eds Gurnis, M., Wysession, M., Knittle, E. & Buffett, B.) 83±96 (Geodynamics series 28, American Geophysical Union, Washington DC, 1998).
26. Gaherty, J. B. & Jordan, T. H. Lehmann discontinuity as the base of an anisotropic layer beneath continents. Science 268, 1468±1471 (1995).
27. Kusznir, N. J. Subduction body force stresses and viscosity structure at the 410 km and 660 km phase transitions. Eos 81, 1081 (2000).
28. Ringwood, A. E. Role of the transition zone and 660 km discontinuity in mantle dynamics. Phys. Earth Planet. Inter. 86, 5±24 (1994).
29. Mitrovica, J. X. & Forte, A. M. Radial pro®le of mantle viscosity: Results from the joint inversion of convection and postglacial rebound observations. J. Geophys. Res. 102, 2751±2769 (1997).
30. Hirose, K., Fei, Y., Ma, Y. & Mao, H.-K. The fate of subducted basaltic crust in the Earth's lower mantle. Nature 397, 53±56 (1999).
31. Widiyantoro, S., Kennett, B. L. N. & Van der Hilst, R. Seismic tomography with P and S data reveals lateral variations in the rigidity of deep slabs. Earth Planet. Sci. Lett. 173, 91±100 (1999). 32. Van der Hilst, R. Complex morphology of subducted lithosphere in the mantle beneath the Tonga
trench. Nature 374, 154±157 (1995).
Supplementary Information accompanies the paper on Nature's website (http://www.nature.com).
Acknowledgements
We thank K. Fischer, G. Houseman and M. Casey for comments on the manuscript, and K. Fischer for suggesting alternative models to test.
Competing interests statement
The authors declare that they have no competing ®nancial interests. Correspondence and requests for materials should be addressed to J.-M.K. (e-mail: [email protected]).