HAL Id: hal-00301060
https://hal.archives-ouvertes.fr/hal-00301060
Submitted on 10 Mar 2006HAL is a multi-disciplinary open access
archive for the deposit and dissemination of sci-entific research documents, whether they are pub-lished or not. The documents may come from teaching and research institutions in France or abroad, or from public or private research centers.
L’archive ouverte pluridisciplinaire HAL, est destinée au dépôt et à la diffusion de documents scientifiques de niveau recherche, publiés ou non, émanant des établissements d’enseignement et de recherche français ou étrangers, des laboratoires publics ou privés.
The influence of polar vortex ozone depletion on NH
mid-latitude ozone trends in spring
S. B. Andersen, B. M. Knudsen
To cite this version:
S. B. Andersen, B. M. Knudsen. The influence of polar vortex ozone depletion on NH mid-latitude ozone trends in spring. Atmospheric Chemistry and Physics Discussions, European Geosciences Union, 2006, 6 (2), pp.1793-1811. �hal-00301060�
ACPD
6, 1793–1811, 2006 NH mid-latitude ozone trends in spring S. B. Andersen and B. M. Knudsen Title Page Abstract Introduction Conclusions References Tables Figures J I J I Back CloseFull Screen / Esc
Printer-friendly Version Interactive Discussion
Atmos. Chem. Phys. Discuss., 6, 1793–1811, 2006 www.atmos-chem-phys-discuss.net/6/1793/2006/ © Author(s) 2006. This work is licensed
under a Creative Commons License.
Atmospheric Chemistry and Physics Discussions
The influence of polar vortex ozone
depletion on NH mid-latitude ozone
trends in spring
S. B. Andersen and B. M. Knudsen
Danish Meteorological Institute, Research and Development Department, Lyngbyvej 100, 2100 Copenhagen Ø, Denmark
Received: 28 November 2005 – Accepted: 10 January 2006 – Published: 10 March 2006 Correspondence to: S. B. Andersen (sba@dmi.dk)
ACPD
6, 1793–1811, 2006 NH mid-latitude ozone trends in spring S. B. Andersen and B. M. Knudsen Title Page Abstract Introduction Conclusions References Tables Figures J I J I Back CloseFull Screen / Esc
Printer-friendly Version Interactive Discussion
Abstract
Reverse domain-filling trajectory calculations have been performed for the years 1993, 1995, 1996, 1997, and 2000 to calculate the spreading of ozone depleted air from the polar vortex to midlatitudes in spring. We find that for these years with massive Arctic ozone depletion the zonal mean total ozone column at midlatitudes is reduced 5
with between 7 and 12 DU in the April-May period. The polar vortex and remnants have preferred locations which leads to longitudinal differences in the midlatitude ozone trends. Together with decadal variations in circulation the dilution of ozone depleted air may explain the major fraction of longitudinal differences in midlatitude ozone trends. The dilution also has a significant impact on the zonal mean ozone trends. With a 10
multiple linear regression model we find that the dilution may explain 39% of the trend in the period 1979–1997 and 54% of the trend in the period 1979–2002. By calculting the effect of simply removing the dilutions we get the possibly more reliable estimates that that dilution may explain 29% of the trend in the period 1979–1997 and 33% of the trend in the period 1979–2002.
15
1 Introduction
Massive ozone depletion inside the Arctic vortex has frequently occurred during the past decade resulting in dilution of the Northern Hemisphere ozone layer down to midlatitudes. Several studies have tried to quantify the impact of polar ozone deple-tion on midlatitude zonal average ozone changes in both hemispheres (Chipperfield, 20
2003; Marchand et al., 2003, Ajtic, 2004; Fioletov and Shepherd, 2005). Observa-tions by satellite instruments as for example the merged TOMS/SBUV data show that the largest spring ozone depletions over the northern and southern midlatitudes oc-cur over Europe and Russia, except for large depletions south of 55◦S (WMO, 1999). It is well known that trends in the circulation can explain a substantial fraction of the 25
ACPD
6, 1793–1811, 2006 NH mid-latitude ozone trends in spring S. B. Andersen and B. M. Knudsen Title Page Abstract Introduction Conclusions References Tables Figures J I J I Back CloseFull Screen / Esc
Printer-friendly Version Interactive Discussion
Hood, 1997; Peters and Entzian, 1998; Hood et al., 1999). Several studies indicate that trends in the 300 hPa geopotential height from 1979–1992 explain around half the longitudinal trend differences from 1979–1992 all the year round (Entzian and Peters, 2000). They do, however, not explain the strong April and May trends over Scandinavia and especially Russia which have occurred during the past decade. We have earlier 5
shown that these longitudinal differences in trends may be explained by a combination of decadal variations in the circulation and transport of ozone depleted air from the polar vortex focussing on the polar ozone depletion in the two years 1993 and 1997 (Knudsen and Andersen, 2001). In this paper we extend the study and show that the explanation holds for more years and is related to the fact that the polar vortex and its 10
remnants have preferred locations where the contained ozone depletion enhances the midlatitude trends. We will also investigate the influence of the polar ozone depletion on zonal average ozone trends. The study will concentrate on the Northern hemi-sphere midlatitudes (30–60◦N) in April and May. This period is interesting for several reasons; it is at the end of the winter where the accumulated Arctic ozone depletion 15
is at its highest, the UV-radiation is relatively high and it is the growth period for many biological systems.
2 Dilution of polar vortex ozone depletion
We have calculated the spreading of ozone depleted air from the polar vortex to mid-latitudes in spring for the months April and May. This is what we will refer to as the 20
“dilution”. The calculations were performed for the years 1993, 1995, 1996, 1997, and 2000.
Calculations of the dilution for April and May were performed using diabatic regrid-ded reverse domain-filling (RDF) trajectory calculations covering the altitude region of the ozone depletion (350–550 K potential temperature (θ) or approximately 13–22 km 25
height). ECWMF 6 hourly analyses were used and the RDF calculations were made on a 111 km (1◦of latitude) equal area grid at 350, 375, 400, 425, 450, 475, 500, 525,
ACPD
6, 1793–1811, 2006 NH mid-latitude ozone trends in spring S. B. Andersen and B. M. Knudsen Title Page Abstract Introduction Conclusions References Tables Figures J I J I Back CloseFull Screen / Esc
Printer-friendly Version Interactive Discussion
550 K. The ozone depletions in 1993, 1995, 1996, and 2000 were taken from Rex et al. (2004) while the ozone depletions from 1997 were taken from Knudsen and Gross (2000). Diabatic descent was calculated by the Morcrette (1991) radiation scheme. The descent calculations have been verified against observed tracers (Christensen et al., 2005). There is a good agreement except at levels below 400 K. The ozone deple-5
tions were regridded every 7th day. This introduces a horizontal mixing equivalent to a diffusivity of 1.65×10³m2 s−1 (Knudsen and Grooß, 2000; Hauchecorne et al., 2002). In the vertical the regridding is done by linear interpolation with respect to potential temperature within the 25 K (about 1 km) vertical spacing. Using an aspect ration of 250 this corresponds to a diffusivity of 8.25×10³m2 s−1. Furthermore the use of 6-10
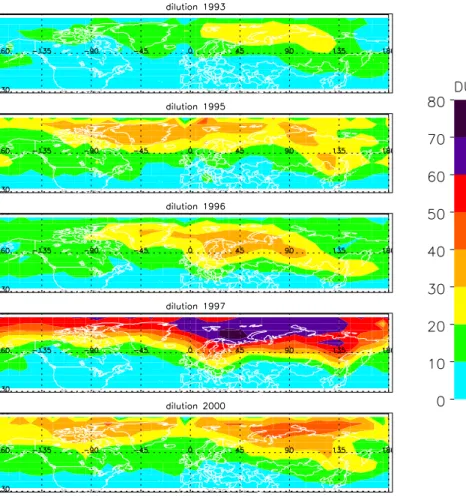
hourly analysis, which are not dynamically consistent with each other, might introduce spurious mixing (Stohl et al., 2004; Schoeberl et al., 2003). Part of the depletion re-sults in an irreversible dilution of the midlatitude ozone. The calculations started on different dates each year depending on the break-up time of the polar vortex. Start dates of the RDF-calculations may bee seen in Table 1. The resulting column dilution 15
for an average of April and May is shown in Fig. 1. It is seen that the major part of the dilution reaching midlatitudes is over Russia an Scandinavia. The zonal mean dilution is between 7 DU and 12 DU and may be seen in Table 1.
By the end of the calculations on 31 May, some of the depletion had descended below 350 K or entered the troposphere and was neglected (e.g. 9% in 1993). Inac-20
curacies in the RDF mass advection on the other hand lead to apparent increases (up to 27%) in the total amount of depletion, but calculated column depletions have been scaled to keep the total depletion constant. Photochemistry leads to recovery from ozone depletion, but has been neglected here. For example in 1997 the recovery in May is 12% of the total depletion (Knudsen and Gross, 2000). However, the average 25
recovery for April and May is considerably smaller.
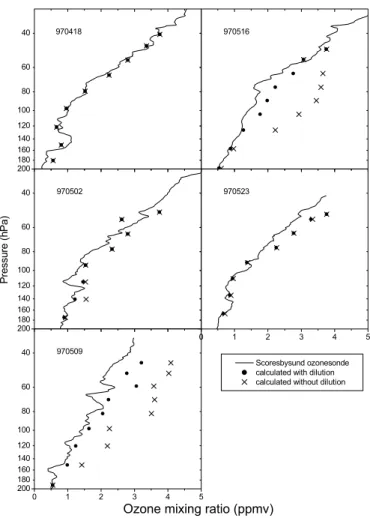
In Fig. 2 the modeled ozone mixing ratios are compared to ozone sondes from Scoresbysund (70.5◦N, 338.0◦E). The agreement is good, except perhaps for the top levels, where the neglect of photochemistry could lead to an overestimation of the
ACPD
6, 1793–1811, 2006 NH mid-latitude ozone trends in spring S. B. Andersen and B. M. Knudsen Title Page Abstract Introduction Conclusions References Tables Figures J I J I Back CloseFull Screen / Esc
Printer-friendly Version Interactive Discussion
ozone mixing ratios. The RDF calculations have also been performed without the vor-tex depletions by adding the calculated depletion (Knudsen et al., 1998a) to the ob-served ozone mixing ratios on the initial day (11 April 1997). The figure shows that this would lead to far too large ozone mixing ratios, when Scoresbysund was inside the vortex remnants, as it was on the 9 and 16 May 1997.
5
By picking the years 1993, 1995, 1996, 1997, and 2000 we have included the major part of the vortex depletion. It has been shown that at 475 K the depletion in the winters 1991/1992 and 1988/1989 was small, and only in the winter 1989/1990 ozone deple-tions comparable to the depletion in 1993 have been found. In the winter 1990/1991, 1993/1994, 1997/1998, 1998/1999, 2000/2001 and 2001/2002 little PSC activation has 10
been predicted, so little ozone depletion is expected (Braathen et al., 2000; Manney et al., 2005; Rex et al., 2004). In earlier winters the depletion potential is consider-ably reduced due to smaller amounts of chlorine and bromine. These considerations are in line with the March 63◦–90◦N averaged total ozone variations (Newman et al., 1997), although the interpretation of these averages with respect to ozone depletion 15
are complicated by movements of the polar vortex.
3 Vortex position
To see whether the preferred positions for the vortex and its remnants over Scandinavia and Russia found in the dilution calculations are valid also for a longer period and to see what the influence is in March, the vortex occurrence frequency at any given point 20
is calculated for the years of strongest vortex depletion 1993, 1995, 1996, 1997, and 2000, and also for other years 1979–2000. The edge of the vortex is determined as where the PV gradient with respect to equivalent latitude (Nash et al., 1996) is largest. When the average wind speed at the edge of the vortex gets below 15.2 ms−1 for at least two consecutive days the vortex is considered broken down. Hereafter the 25
equivalent latitude of the edge of the vortex remnants is kept constant. If the vortex decreases substantially in size during the last 5 days before break-up, the largest size
ACPD
6, 1793–1811, 2006 NH mid-latitude ozone trends in spring S. B. Andersen and B. M. Knudsen Title Page Abstract Introduction Conclusions References Tables Figures J I J I Back CloseFull Screen / Esc
Printer-friendly Version Interactive Discussion
during these 5 days is used. As shown by Knudsen and Grooß (2000), the vortex remnants contain a lot of the depletion. In fact on May 25, 1997, the vortex remnants at 435 K defined in this way (PV<17 PVU (1 PVU=10−6K m2 s−1 kg−1)) contain 42% of the depletion originating from the vortex. On 31 May 1993, the vortex remnants (PV<16.9 PVU) contain 29% of the depletion. This definition of vortex remnants might 5
contain air masses outside the region of largest PV gradients, but was selected to follow a larger part of the dilution. The statistic was calculated for 475 K because in some years no vortex exists in March at 435 K. The calculation is based on ERA-40 data, but did not go further back than 1979 because the vortex generally gets weaker backwards in time. Karpetchko et al. (2005) arrive at similar occurence frquencies for 10
March based on the whole ERA40 period.
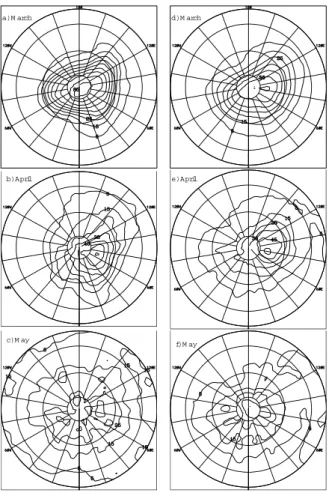
Figure 3 shows the frequency of the occurrence of the vortex and its remnants in March, April, and May. In all 3 months the most likely occurrence of the vortex (rem-nants) in the midlatitudes is Europe and Eastern Russia both during the years with most vortex depletion and during the other years.
15
4 Longitudinal ozone trends
To calculate ozone trends the merged TOMS/SBUV version 7 data set with a resolu-tion of 5◦×10◦was used (Miller et al., 2002). A newer version 8 data set exists which should be more applicable to absolute trend studies. This dataset however has a lower longitudinal resolution which makes it less suited to study longitudinal differences. Two 20
different periods have been analyzed. First the period 1979–1997, which is the period that shows the largest longitudinal differences. In addition the analysis has been up-dated to include the period 1979–2002. Figures 4 and 5 show the trend from 30–90◦N. However the region we focus on is the midlatitudes 30–60◦N.
A multiple linear regression model was applied to the April and May average ozone 25
column assuming a linear trend and including the quasi-biannual oscillation and solar cycle as independent variables. The resulting trends may be seen in Figs. 4a and 5a.
ACPD
6, 1793–1811, 2006 NH mid-latitude ozone trends in spring S. B. Andersen and B. M. Knudsen Title Page Abstract Introduction Conclusions References Tables Figures J I J I Back CloseFull Screen / Esc
Printer-friendly Version Interactive Discussion
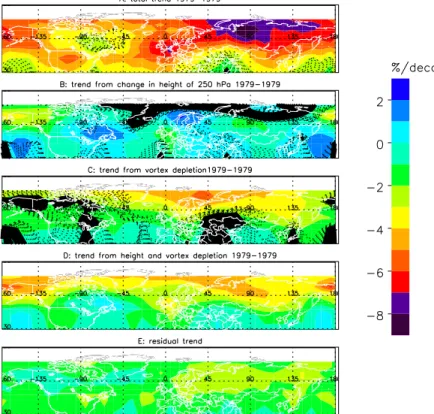
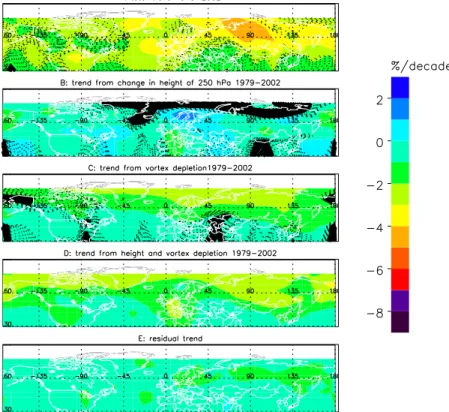
Trends calculated in the period 1979–1997 vary between −2% and −9% while trends calculated between 1979 and 2002 vary between −2% and −6%. The same pattern in the longitudinal variation is seen, although less pronounced for the period 1979–2002. This is probably due to very small ozone depletions in the Arctic vortex in most of the later winters except 2000 (Manney et al., 2005).
5
To calculate the effect of circulation changes and vortex depletions on the ozone trends, the ECMWF 250 hPa geopotential as well as the dilution in 1993, 1995, 1996, 1997 and 2000 (zero in other years) is used instead of the linear ozone trend in the regression model.
Figures 4b and 5b shows the trend in ozone that may be explained by the trend in the 10
250 hPa geopotential taken from ECWMF analysis. It is clear that the height trend helps explain that the downward ozone trend is weak south of Greenland and strong over the UK. But it does not explain the strong trends over e.g. Scandinavia and Russia. At midlatitudes (30–60◦N) the 250 hPa geopotential height may explain 32% (correlation 0.57) of the longitudinal differences in ozone trends for the period 1979–1997 and 27% 15
(correlation 0.53) for the period 1979–2002. There is no significant trend in the zonal mean ozone due to changes in the 250 hPa geopotential height.
Figures 4c and 5c shows the trend in ozone that may be explained by vortex de-pletion. This helps explain the strong downward ozone trends over Scandinavia and Russia. At midlatitudes (30–60◦N) the dilution may explain 50% (correlation 0.71) of 20
the longitudinal differences in ozone trends until for the period 1979–1997 and 45% (correlation 0.67) for the period 1979–2002. In zonal mean the trend at midlatitudes re-lated to dilution amounts to −1.7%/decade (39% of the total trend) for 1979–1997 and −1.3%/decade (54% of the total trend) for 1979–2002 of the observed ozone trend. However there is a strong correlation between a linear decrease with time (or equiv-25
alent effective stratospheric chlorine (EESC) proxy) and the dilution proxy. Therefore these numbers may include some trend related to local ozone depletion out side the polar vortex and should therefore be regarded with some caution. Also the dilution may be correlated to low ozone due to less poleward transport in years with a strong
ACPD
6, 1793–1811, 2006 NH mid-latitude ozone trends in spring S. B. Andersen and B. M. Knudsen Title Page Abstract Introduction Conclusions References Tables Figures J I J I Back CloseFull Screen / Esc
Printer-friendly Version Interactive Discussion
vortex. By neglecting the vortex depletion in other years than 1993, 1995, 1996, 1997 and 2000 the effect of the vortex depletion will be underestimated.
In Figs. 4d and 5d the trends in panels (b) and (c) have been added and the com-bination explains the major part of the longitudinal trend variations. From 30◦–60◦N it explains 80% of the variation until 1997 and 62% of the variation until 2002, whereas 5
the height trend alone only explains 32% and 27% respectively. Note that since the total trend is smaller in the period 1979–2002, the part of the variation that remains un-explained is not larger than for the period 1979–1997. The fact that the trends in panels (a) generally are more negative than the trends in panels (d) is due to e.g. local ozone depletion outside the vortex (Solomon et al., 1996). Figures 4e and 5e show the trend 10
of the residuals which in zonal mean amounts to −1.5%/decade and −0.6%/decade for the periods 1979–1997 and 1979–2002, respectively.
The underlying assumption in the calculations of the effect of the vortex depletions is that the position of the vortex and its remnants is independant of the ozone depletion itself. Another related shortcoming is the neglect of radiative cooling impacts of the 15
ozone depletion. However, Prather et al. (1990) found that the reduction of the ozone transport into the troposphere is only a minor fraction of the photochemical recovery during the Antarctic spring.
5 Zonal average ozone trends
A complicating factor in determining the influence of dilution is that the dilution is cor-20
related with the clorine loading of the stratosphere and thus with local ozone depletion. There is no reson to believe that the local ozone depletion is not zonally symmetric. Therefore it is mainly the absolute contribution to the zonal mean trends which is ques-tionable. We have therefore tried to calculte the contribution of dilution to the ozone trends in an alternative way also. This has been done by simply subracting the dilution 25
from the total column ozone and calculating the trends of the resulting ozone fields. This results in smaller ozone trends as they might have been without dilution. By
com-ACPD
6, 1793–1811, 2006 NH mid-latitude ozone trends in spring S. B. Andersen and B. M. Knudsen Title Page Abstract Introduction Conclusions References Tables Figures J I J I Back CloseFull Screen / Esc
Printer-friendly Version Interactive Discussion
paring these trends with the real trends we find that 29% of the midlatitude ozone trend in the period 1979–1997 and 33% in the period 1979–2002 may be explained by di-lution. Again the fact that we neglected vortex depletion in other winters than the five with most ozone depletion will lead to underestimation of the effect of dilution.
Several other studies have tried to quantify the impact of polar ozone depletion on 5
midlatitude zonal average ozone changes. Using a chemical transport model Chip-perfield et al. (2003) found that 30–50% of year round trend from 35◦–60◦N is due to dilution. Through a correlation study Fioletov and Shepherd (2005) found that 15% of the 35◦–60◦N year round decline can be attributed to polar ozone depletion. The results presented here are valid for April–May only and can therefore not be compared 10
directly, since the influence of dilution will be smaller year round due to further dilu-tion and photochemical recovery of ozone. However we find our results to be most in line with the first especially when considering that they are lower limits due to the neglect of polar ozone depletion in other years than the five worst winters. For the Southern Hemisphere Ajtic et al. (2004) neglecting photo chemistry find an upper limit 15
of 16–19 DU to the reduction of SH 15 October–15 January total column ozone due to dilution. In this paper we find a reduction 7–12 DU for the Northern Hemisphere.
6 Conclusion
We have shown that longitudinal differences in trends at midlatitudes in spring may be explained by a combination of decadal variations in the circulation and transport 20
of ozone depleted air from the polar vortex. From 30◦–60◦N it explains 80% of the variation until 1997 and 62% of the variation until 2002, the dilution of ozone depleted air alone explains 50% and 45% respectively. This is related to the fact that the polar vortex and its remnants have preferred locations where the contained ozone depletion enhances the midlatitude trends.
25
We also investigated the influence of the polar ozone depletion on zonal average ozone trends. With a multiple linear regression model we find that the dilution may
ACPD
6, 1793–1811, 2006 NH mid-latitude ozone trends in spring S. B. Andersen and B. M. Knudsen Title Page Abstract Introduction Conclusions References Tables Figures J I J I Back CloseFull Screen / Esc
Printer-friendly Version Interactive Discussion
explain 39% of the trend in the period 1979–1997 and 54% of the trend in the period 1979–2002. By calculting the effect of simply removing the dilutions we get the possibly more reliable estimates that that dilution may explain 29% of the trend in the period 1979–1997 and 33% of the trend in the period 1979–2002.
It is seen that the large vortex ozone depletions seen in the later years contribute to 5
the observed spring ozone depletion over Europe and Russia mainly. Eastern Russia is at the climatological maximum of ozone, so the depletion here might not matter as much as the depletion over Europe, which is at the climatological minimum (longitudi-nally).
Acknowledgements. This work was done as part of the EU-project CANDIDOZ
(EVK2-CT-10
2001-00133). We acknowlegde J. Morcrette for the radiation code, ECMWF for the meteoro-logical analyses, The Ozone Processing Team of NASA for the TOMS/SBUV data and M. Rex for the ozone depletions.
References
Ajtic, J., Connor, B. J., Lawrence, B. N., Boedcker, G. E., Hoppel, K. W., Rosenfield, J. E., and
15
Heuff, D. N.: J. Geophys. Res., 109, D17107, doi:10.1029/2003JD004500, 2004.
Braathen, G. O., M ¨uller, M., Sinnhuber, B.-M., von der Gathen, P., Kyr ¨o, E., Mikkelsen, I. S., Bojkov, B., Dorokhov, V., Fast, H., Parrondo, C., and Kanzawa, H.: Temporal evolution of ozone in the Arctic vortex from 1988–89 to 1999–2000, paper presented at the SOLVE-THESEO 2000 Science Meeting, Palermo, 25–29 Sept., 2000.
20
Chipperfield, M. P.: A three-dimensional model study of long-term mid-high latitude lower strato-sphere ozone changes, Atmos. Chem. Phys., 3, 1253–1265, 2003.
Christensen, T., Knudsen, B. M., Streibel, M., Andersen, S. B., Benesova, A., Braathen, G., Claude, H., Davies, J., De Backer, H., Dier, H., Dorokhov, V., Gerding, M., Gil, M., Henchoz, B., Kelder, H., Kivi, R., Kyr ¨o, E., Litynska, Z., Moore, D., Peters, G., Skrivankova, P., St ¨ubi,
25
R., Turunen, T., Vaughan, G., Viatte, P., Vik, A. F., von der Gathen, P., and Zaitcev, I.: Vortex-averaged Arctic ozone depletion in the winter 2002/2003, Atmos. Chem. Phys., 5, 131–138, 2005.
ACPD
6, 1793–1811, 2006 NH mid-latitude ozone trends in spring S. B. Andersen and B. M. Knudsen Title Page Abstract Introduction Conclusions References Tables Figures J I J I Back CloseFull Screen / Esc
Printer-friendly Version Interactive Discussion
Entzian, G. and Peters, D.: Seasonal longitude dependent total ozone variations induced by large scale wave structure of the geopotential field over the northern hemisphere, Proc. Quadrennial Ozone Symposium, Sapporo, 3–8 July, 2000.
Fioletov, V. E. and Shepherd, T. G.: Summertime total ozone variations over middle and polar latitudes, Geophys. Res. Lett., 32, L04807, doi:10.1029/2004GL022080, 2005.
5
Hauchecorne, A., Godin, S., Marchand, M., Heese, B., and Souprayen, C.: Quantification of the transport of chemical constituents from the polar vortex to midlatitudes in the lower stratosphere using the high-resolution advection model MIMOSA and effective diffusivity, J. Geophys. Res., 107(D20), 8289, doi:10.1029/2001JD000491, 2002.
Hood, L. L. and Zaff, D. A.: Lower stratospheric stationary waves and the longitude dependence
10
of ozone trends in winter, J. Geophys. Res., 100, 25 791–25 800, 1995.
Hood, L. L., Rossi, S., and Beulen, M.: Trends in lower stratospheric zonal winds, Rossby wave breaking behavior, and column ozone at northern midlatitudes, J. Geophys. Res., 104, 23 321–24 339, 1999.
Karpetchko, A., Kyro, E., and Knudsen, B.: Arctic and Antarctic polar vortices
15
1957-2002 as seen from the ERA-40 reanalyses, J. Geophys. Res., 110, D21109, doi:10.1029/2005JD006113, 2005.
Knudsen, B. M. and Grooss, J.-U.: Northern mid-latitude stratospheric ozone dilution in spring modeled with simulated mixing, J. Geophys. Res., 105, 6885–6890, 2000.
Knudsen, B. M., Lahoz, W. A., O’Neill, A., and Morcrette, J.-J.: Evidence for a substantial role
20
for dilution in northern mid-latitude ozone depletion, Geophys. Res. Lett., 25, 4501–4504, 1998a.
Knudsen, B. M., Larsen, N., Mikkelsen, I. S., Morcrette, J.-J., Braathen, G. O., Kyr ¨o, E., Fast, H., Gernandt, H., Kanzawa, H., Nakane, H., Dorokhov, V., Yushkov, V., Hansen, G., Gil, M., and Shearman, R. J.: Ozone depletion in and below the Arctic vortex for 1997, Geophys.
25
Res. Lett., 25, 627–630, 1998b.
Knudsen, B. M. and Andersen, S. B.: Longitudinal variation in springtime ozone trends, Nature, 413, 699–700, 2001.
Manney, G. L., Kr ¨uger, K., Sabutis, J. L., Sena, S. A., and Pawson, S.: The remarkable 2003– 2004 winterr and other recent warm winter in the Arctic stratosphere since the lata 1990s, J.
30
Geophys. Res., 110, D4107, doi:10.1029/2004JD005367, 2005.
Marchand, M., Godin, S., Hauchecorne, A., Lef `evre, F., Bekki, S., and Chipperfield, M.: Influ-ence of polar ozone loss on northern midlatitude regions estimated by a high-resolution
ACPD
6, 1793–1811, 2006 NH mid-latitude ozone trends in spring S. B. Andersen and B. M. Knudsen Title Page Abstract Introduction Conclusions References Tables Figures J I J I Back CloseFull Screen / Esc
Printer-friendly Version Interactive Discussion
chemistry transport model during winter 1999/2000, J. Geophys. Res., 108(D5), 8326, doi:10.1029/2001JD000906, 2003.
McCormack, J. P. and Hood, L. L.: Modeling the spatial distribution of total ozone in northern hemisphere winter: 1979–1991, J. Geophys. Res., 102, 13 711–13 717, 1997.
McPeters, R. D., Hollandsworth, S. M., Flynn, L. E., Herman, J. R., and Seftor, C. J.:
Long-5
term ozone trends derived from the 16-year combined Nimbus 7/Meteor 3 TOMS Version 7 record, Geophys. Res. Lett., 23, 3699–3702, 1996.
Miller, A. J., Nagatani, R. M., Flynn, L. E., Kondragunta, S., Beach, E., Stolarski, R., McPeters, R., Bhartia, P. K., DeLand, M., Jackman, C. H., Wuebbles, D. J., Patten, K. O., and Cebula, R. P.: A cohesive total ozone data set from the SBUV(/2) satellite system, J. Geophys. Res.,
10
107(D23), 4701, doi:10.1029/2001JD000853, 2002.
Morcrette, J.-J.: Radiation and cloud radiative properties in the ECMWF operational weather forecast model, J. Geophys. Res., 96, 9121–9132, 1991.
Nash, E. R., Newman, P. A., Rosenfield, J. E., and Schoeberl, M. R.: An objective determination of the polar vortex using Ertel’s potential vorticity, J. Geophys. Res., 101, 9471–9478, 1996.
15
Newman, P. A., Gleason, J. F., McPeters, R. D., and Stolarski, R. S.: Anomalously low ozone over the Arctic, Geophys. Res. Lett., 24, 2689–2692, 1997.
Pawson, S., Naujokat, B., and Labitzke, K.: On the PSC formation potential of the northern stratosphere, J. Geophys. Res., 100, 23 215–23 225, 1995.
Peters, D. and Entzian, G.: On the longitude-dependent total ozone trend over the
Atlantic-20
European region in boreal winter months, in: Atmospheric Ozone: Proceedings of the XVIII Quadrennial Ozone Symposium, L’Aquila, Italy, 12–21 Sptember 1996, edityed by: Bojkov, R. D. and Visconti, G., 69–72, 1998.
Prather, M., Garcia, M. M., Suozzo, R., and Rind, D.: Global impact of the Antarctic ozone hole: dynamical dilution with a three-dimensional chemical transport model, J. Geophys. Res., 95,
25
3449–3471, 1990.
Rex, M., Salawitch, R. J., von der Gathen, P., Harris, N. R. P., Chipperfield, M. P., and Naujokat, B.: Arctic ozone loss and climate change, Geophys. Res. Lett., 31, L04116, doi:10.1029/2003GL018844, 2004.
Schoeberl, M. R., Douglass, A. R., Zhu, Z., and Pawson, S.: A comparison of the lower
strato-30
spheric age spectra derived from a general circulation model and two data assimilation sys-tems, J. Geophys. Res., 108(D3), 4113, doi:10.1029/2002JD002652, 2003.
ACPD
6, 1793–1811, 2006 NH mid-latitude ozone trends in spring S. B. Andersen and B. M. Knudsen Title Page Abstract Introduction Conclusions References Tables Figures J I J I Back CloseFull Screen / Esc
Printer-friendly Version Interactive Discussion
M. P.: The role of aerosol variations in anthropogenic ozone depletion at northern midlati-tudes, J. Geophys. Res., 101, 6713–6727, 1996.
Stohl, A., Cooper, O. R., and James, P.: A cautionary note on the use of meteorological analysis fields for quantifying atmospheric mixing, J. Atmos. Sci., 61, 1446–1453, 2004.
World Meteorological Organization (WMO): Scientific assessment of ozone depletion: 1998,
5
ACPD
6, 1793–1811, 2006 NH mid-latitude ozone trends in spring S. B. Andersen and B. M. Knudsen Title Page Abstract Introduction Conclusions References Tables Figures J I J I Back CloseFull Screen / Esc
Printer-friendly Version Interactive Discussion
Table 1. Start date and polar ozone depletion amount used in RDF calculations together with
the resulting 30–60◦N zonal mean dilution in April and May.
Year 1993 1995 1996 1997 2000 Start date 5 March 30 March 25 March 4 April 12 March Polar ozone depletion 68 DU 81 DU 102 DU 79 DU 97 DU 30◦–60◦N dilution 7 DU 11 DU 12 DU 8 DU 11 DU
ACPD
6, 1793–1811, 2006 NH mid-latitude ozone trends in spring S. B. Andersen and B. M. Knudsen Title Page Abstract Introduction Conclusions References Tables Figures J I J I Back CloseFull Screen / Esc
Printer-friendly Version Interactive Discussion
Fig. 1. April–May averages of the ozone depletion originating from the polar vortex in 1993,
1995, 1996, 1997, and 2000. 5◦latitude-longitude boxes were used. In 1997 the total depletion was largest and the vortex broke up latest, so that the mixing to lower latitudes was weakest.
ACPD
6, 1793–1811, 2006 NH mid-latitude ozone trends in spring S. B. Andersen and B. M. Knudsen Title Page Abstract Introduction Conclusions References Tables Figures J I J I Back CloseFull Screen / Esc
Printer-friendly Version Interactive Discussion 0 1 2 3 4 5 200 180 160 140 120 100 80 60 40 200 180 160 140 120 100 80 60 40 0 1 2 3 4 5 200 180 160 140 120 100 80 60 40
Ozone mixing ratio (ppmv) 970509
Scoresbysund ozonesonde calculated with dilution calculated without dilution 970516 P ressu re (h Pa ) 970418 970523 970502
Fig. 2. Comparison of modelled ozone mixing ratios (circles) with ozonesonde observations
ACPD
6, 1793–1811, 2006 NH mid-latitude ozone trends in spring S. B. Andersen and B. M. Knudsen Title Page Abstract Introduction Conclusions References Tables Figures J I J I Back CloseFull Screen / Esc
Printer-friendly Version Interactive Discussion a)M arch b)April c)M ay d)M arch e)April f)M ay
Fig. 3. Percentage occurrence frequency of the vortex (remnants) for 1993, 1995, 1996, 1997,
and 2000 in(a) March, (b) April, and (c) May, and for other years 1979–2000 in (d) March, (e) April, and (f) May. Contours at 5, 15, 25, . . . %. Latitude circles 30, 40, 60, and 80◦N. Greenwich meridian at the bottom.
ACPD
6, 1793–1811, 2006 NH mid-latitude ozone trends in spring S. B. Andersen and B. M. Knudsen Title Page Abstract Introduction Conclusions References Tables Figures J I J I Back CloseFull Screen / Esc
Printer-friendly Version Interactive Discussion
Fig. 4. (a) The April–May 1979–1997 ozone trend (%/decade). (b) The ozone trend due to the
trend in the 250 hPa height. The height trends explains that the downward ozone trend is weak south of Greenland and strong over the UK.(c) The ozone trend due to the vortex depletions
in 1993, 1995, 1996 and 1997. This helps explain the strong downward ozone trends over Scandinavia and Russia. (d) The sum of (b) and (c). This explains 80% of the midlatitude
ozone trend variations in (a). The general offset between (a) and (d) is caused by e.g. local ozone depletion outside the vortex. Dots show if the trends are insignificant at the 2σ level and solid black areas show if the trends are insignificant at the 1σ level.
ACPD
6, 1793–1811, 2006 NH mid-latitude ozone trends in spring S. B. Andersen and B. M. Knudsen Title Page Abstract Introduction Conclusions References Tables Figures J I J I Back CloseFull Screen / Esc
Printer-friendly Version Interactive Discussion
Fig. 5. Same as Fig. 4 for the period 1979–2002. (a) The April-May 1979-2002 ozone trend
(%/decade). (b) The ozone trend due to the trend in the 250 hPa height. The height trends
explains that the downward ozone trend is weak south of Greenland and strong over the UK.
(c) The ozone trend due to the vortex depletions in 1993, 1995, 1996, 1997 and 2000. This
helps explain the strong downward ozone trends over Scandinavia and Russia. (d) The sum
of (b) and (c). This explains 62% of the midlatitude ozone trend variations in (a). The general offset between (a) and (d) is caused by e.g. local ozone depletion outside the vortex. Dots show if the trends are insignificant at the 2 s level and solid black areas show if the trends are