HAL Id: hal-02110579
https://hal.archives-ouvertes.fr/hal-02110579
Submitted on 3 May 2019
HAL is a multi-disciplinary open access
archive for the deposit and dissemination of
sci-entific research documents, whether they are
pub-lished or not. The documents may come from
teaching and research institutions in France or
abroad, or from public or private research centers.
L’archive ouverte pluridisciplinaire HAL, est
destinée au dépôt et à la diffusion de documents
scientifiques de niveau recherche, publiés ou non,
émanant des établissements d’enseignement et de
recherche français ou étrangers, des laboratoires
publics ou privés.
On the fast quenching of young low-mass galaxies up to
z
∼ 0.6: new spotlight on the lead role of environment
Thibaud Moutard, Marcin Sawicki, Stéphane Arnouts, Anneya Golob, Nicola
Malavasi, Christophe Adami, Jean Coupon, Olivier Ilbert
To cite this version:
Thibaud Moutard, Marcin Sawicki, Stéphane Arnouts, Anneya Golob, Nicola Malavasi, et al.. On the
fast quenching of young low-mass galaxies up to z
∼ 0.6: new spotlight on the lead role of environment.
Monthly Notices of the Royal Astronomical Society, Oxford University Press (OUP): Policy P - Oxford
Open Option A, 2018, 479 (2), pp.2147-2160. �10.1093/mnras/sty1543�. �hal-02110579�
On the fast quenching of young low-mass galaxies up to z ∼ 0.6: new
spotlight on the lead role of environment
Thibaud Moutard,
1?Marcin Sawicki,
1†
Stéphane Arnouts,
2Anneya Golob,
1Nicola Malavasi,
3Christophe Adami,
2Jean Coupon,
4and Olivier Ilbert
21Department of Astronomy& Physics and Institute for Computational Astrophysics, Saint Mary’s University, 923 Robie Street, Halifax,
Nova Scotia, B3H 3C3, Canada
2Aix Marseille Université, CNRS, LAM - Laboratoire d’Astrophysique de Marseille, 38 rue F. Joliot-Curie, F-13388, Marseille, France 3Department of Physics and Astronomy, Purdue University, 525 Northwestern Avenue, West Lafayette, IN 47907, USA
4Astronomical Observatory of the University of Geneva, ch. d’Ecogia 16, 1290 Versoix, Switzerland
Accepted XXX. Received YYY; in original form ZZZ
ABSTRACT
We investigate the connection between environment and the different quenching channels that galaxies are prone to follow in the rest-frame NUVrK colour diagram, as identified by
Moutard et al. (2016b). Namely, the fast quenching channel followed by young low-mass galaxies and the slow quenching channel followed by old high-mass ones. We make use of the>22 deg2covered the VIPERS Multi-Lambda Survey (VIPERS-MLS) to select a galaxy
sample complete down to stellar masses of M∗> 109.4M up to z ∼ 0.65 (M∗> 108.8M up to
z ∼0.5) and including 33,500 (43,000) quiescent galaxies properly selected at 0.2 < z < 0.65, while being characterized by reliable photometric redshifts (σδz/(1+z) ≤ 0.04) that we use to measure galaxy local densities. We find that (1) the quiescence of low-mass [M∗ ≤ 109.7M ]
galaxies requires a strong increase of the local density, which confirms the lead role played by environment in their fast quenching and, therefore, confirms that the low-mass upturn observed in the stellar mass function of quiescent galaxies is due to environmental quenching. We also observe that (2) the reservoir of low-mass star-forming galaxies located in very dense regions (prone to environmental quenching) has grown between z ∼ 0.6 and z ∼ 0.4 whilst the share of low-mass quiescent galaxies (expected to being environmentally quenched) may have simultaneously increased, which would plead for a rising importance of environmental quenchingwith cosmic time, compared to mass quenching. We finally discuss the composite picture of such environmental quenching of low-mass galaxies and, in particular, how this picture may be consistent with a delayed-then-rapid quenching scenario.
Key words: galaxies: photometry – galaxies: distances and redshifts – galaxies: statistics – galaxies: interactions – galaxies: star formation – galaxies: evolution
1 INTRODUCTION
The fact that galaxies can be classified according to their star-formation activity into a blue/star-forming population, mostly made of disc galaxies, and a red/quiescent population, mainly consist-ing of elliptical galaxies, has been extensively documented in the last decade (e.g.,Hogg et al. 2003;Kauffmann et al. 2004;Baldry
et al. 2006;Haines et al. 2007;Williams et al. 2009;Arnouts et al.
2013;Moutard et al. 2016a;Pacifici et al. 2016a). This bimodality,
which can be observed to redshift z ∼ 4 (e.g.,Ilbert et al. 2013;
Muzzin et al. 2013;Tomczak et al. 2014;Mortlock et al. 2015;
Davidzon et al. 2017), is the statistical expression of a fairly rapid
phenomenon of star-formation shutdown, the so-called quenching.
† Canada Research Chair
The processes that are involved in such quenching of star formation are, however, still a matter of debate. In particular, the quenching mechanism(s) that turn(s) star formation off in low-mass galaxies may be quite different from what is at play in massive galaxies.
Now well established, the predominance of the quiescence in massive galaxies (see, e.g.,Bundy et al. 2006;Ilbert et al. 2010;
Baldry et al. 2012;Davidzon et al. 2013;Moutard et al. 2016b)
un-derlies a downsizing of the star-formation quenching (i.e., the more massive a galaxy is, the earlier its star formation stops, on aver-age). Furthermore, the high constancy of the stellar mass function (SMF) of star-forming galaxies at high mass supports the idea that star-formation activity is preferentially impeded above a given stel-lar mass (i.e., the star-formation efficiency declines exponentially above this stellar mass;Ilbert et al. 2010;Peng et al. 2010), which has been confirmed to be remarkably stable over several Gyrs from
z ∼ 1 (namely, M?sf = 1010.64±0.01M
at 0.2 < z < 1.5;Moutard
et al. 2016b). Actually, this characteristic stellar mass may also be
considered as a dark matter halo critical mass of Mh ∼ 1012M
(assuming a stellar-to-halo mass ratio; e.g.,Coupon et al. 2015). This may be consistent with virial shock-heating processes (e.g.,
Kereš et al. 2005;Dekel & Birnboim 2006;Cattaneo et al. 2006),
but other mechanisms able to halt the cold-gas supply such as feed-back from a radio-loud active galactic nucleus (AGN) may also ex-plain the star-formation quenching in massive galaxies (e.g.,Best
et al. 2005;Croton et al. 2006;Karouzos et al. 2014), which
ap-pears to be characterised by quite long timescales (of 1-to-a few Gyrs) over the last ten Gyrs (e.g.,Schawinski et al. 2014;Ilbert
et al. 2015;Moutard et al. 2016b;Pandya et al. 2017). However,
such mass quenching processes can not be invoked in low-mass galaxies, and environmental effects have been put forth to explain the star-formation suppression in these galaxies.
Indeed, the latest measurements of the SMF reveal a clear excess of low-mass quiescent galaxies, which underlies an upturn around stellar masses of M∗ ∼ 109.7M observed in the local
Uni-verse (e.g.,Baldry et al. 2012;Moustakas et al. 2013) and at low redshift (Drory et al. 2009;Moutard et al. 2016b, to z ∼ 0.5), and whose build-up is observed at higher redshift (e.g.,Muzzin et al.
2013;Tomczak et al. 2014, to z ∼ 1 for the later). We recently
showed that quiescent galaxies that are responsible for this low-mass upturn in the SMF are young quiescent galaxies (Moutard
et al. 2016b) –i.e. they exhibit colours typical of young stellar
popu-lations (making them good candidates to being post-starburst galax-ies; e.g.,Kriek et al. 2010;Whitaker et al. 2012)– and are expected to have experienced a rapid quenching (turning quiescent over just ∼ 0.4 Gyr). Such observations support a picture where galaxies fol-low different quenching channels depending on their stellar mass, which is consistent with a scenario mixing different modes of star-formation quenching as proposed byFaber et al.(2007). In particu-lar, the excess of low-mass quiescent galaxies has been suggested to be associated with the environmental quenching of satellite galax-ies, whose importance is expected to grow with large-scale struc-ture and, thus, to decrease with increasing redshift (Peng et al.
2010).
The connection between environment and star-formation quenching is now well illustrated at low redshift (z < 0.5; e.g.,
Balogh et al. 1997;Lewis et al. 2002;Hogg et al. 2003;Kau
ff-mann et al. 2004;Baldry et al. 2006;Haines et al. 2007;Yang et al.
2009;Peng et al. 2012), and a clear picture has emerged where, on
average, red/quiescent galaxies are characterised by richer/denser environments than blue/star-forming ones. Several quenching pro-cesses involving rich environments have therefore been proposed, such as ram-pressure stripping, in which the gas is expelled from the galaxy that becomes satellite (Gunn & Gott 1972); strangula-tion/starvation,1 in which the cold gas supply is heated and then
halted (Larson et al. 1980;Peng et al. 2015); galaxy harassment, in which multiple encounters deprive galaxies from stars and/or gas through tidal stripping (Farouki & Shapiro 1981;Moore et al. 1996); or major merging triggering a subsequent starburst episode and/or an AGN that consumes/expels the remaining reservoir of cold gas (Schawinski et al. 2014); all assuming that cold gas fu-elling is impeded in dense environments. This stresses indeed that
1 We emphasise that the terms strangulation/starvation might either refer
to environment (e.g., when a galaxy enters the hot gas of a cluster) or to peculiar evolution (e.g., when the radio-loud AGN feedback halts the cold gas infall).
these processes must be addressed in the cosmological context of the hierarchical growth of large-scale structures, and especially the evolution of filaments along which flows the cold gas that fuels star formation inside galaxies (Sancisi et al. 2008;Dekel et al. 2009).
Much effort has been made over the last decade to observe the impact of environment on star formation across cosmic time (e.g.,
Cucciati et al. 2006,2010;Muzzin et al. 2012;Lani et al. 2013;
Scoville et al. 2013;Muzzin et al. 2014;Fossati et al. 2017;Cucciati
et al. 2017;Malavasi et al. 2017;Laigle et al. 2018). However, for
different reasons, these studies focused on relatively massive galax-ies and were not able to probe a low-mass population whose prime interest is precisely the fact that, by "nature", it is not expected to quench. While the impact of environment on the quenching of low-mass quiescent galaxies has been observed for a while in the local Universe (Hogg et al. 2003) where these galaxies have appeared to be essentially satellites (e.g.,Haines et al. 2007;Peng et al. 2012), the impact of environment on the quenching of low-mass galax-ies was not observed at higher redshift until recently (namely, at 0.5 < z < 1; Guo et al. 2017). This reemphasized the question of the impact of environment on the quenching of low-mass galaxies across cosmic time while raising the question of the associated con-tribution to the build-up of the quiescent population, in particular, in the light of the picture described previously where galaxies are prone to follow different quenching channels depending on their stellar mass.
In this paper, we analysed the relation between environment and the different quenching channels that galaxies are prone to fol-low in the rest-frame NUV-r vs. r-K colour diagram, notably de-pending on their stellar mass. In particular, we intended to ver-ify whether environment drives the fast quenching channel fol-lowed by low-mass galaxies and responsible for the upturn ob-served in the SMF of quiescent galaxies, as shown inMoutard et al.
(2016b). At the same time, we took this opportunity to question the
importance of such quenching channel across cosmic time, com-pared to the quenching channel that can be associated with mass quenching. We made use of the unique combination of area, depth and photometric multi-wavelength coverage of the VIPERS Multi-Lambda Survey2(VIPERS-MLS;Moutard et al. 2016a), assembled
in the fields of the VIMOS Public Extragalactic Redshift Survey3
(VIPERS;Guzzo et al. 2014). Covering>22 deg2down to K s< 22,
the VIPERS-MLS is indeed remarkable as (a) it allows the use of the rest-frame NUV-r vs. r-K (NUVrK) diagram to properly sep-arate quiescent and star-forming galaxies; (b) it provides a com-plete sample of galaxies down to stellar masses of M∗ ' 109.4M
at z < 0.65 (M∗' 108.8M at z < 0.5) including more than 33,500
(43,000) quiescent galaxies, which enabled us to probe the evolu-tion of fairly low-mass galaxies from z ∼ 0.6; while (c) these galax-ies are all characterised by accurate photometric redshifts, with σδz/(1+z) < 0.04, which allows for reliable local density measure-ments.
The paper is organised as follows. In Sect. 2 we give an overview of the VIPERS-MLS data and measurements used in the present study. We then review the NUVrK diagram and its ability to distinguish between fast and slow quenching channels in Sect.3. In Sect.4we present our results regarding the connection between environment and quenching channels to finally discuss these results in Sect.5.
Throughout this paper, we use the standard cosmology
2 http://cesam.lam.fr/vipers-mls/ 3 http://vipers.inaf.it/
(Ωm = 0.3, ΩΛ = 0.7 with H0 = 70 km s−1Mpc−1). Magnitudes
are given in the AB system (Oke 1974) and galaxy stellar masses are given in units of solar masses (M ) for aChabrier(2003) initial
mass function.
2 DATA: VIPERS-MLS
Observational data, photometric redshifts and stellar mass esti-mates were discussed extensively inMoutard et al.(2016a,b) and here we only present a brief overview of key elements (Sect.2.1). To these preexisting measurements, we have now also added the measurement of local galaxy density, as described in Sect.2.2.
2.1 Observational data, photometric redshifts, and mass estimates
Our data consist of (FUV, NUV,) u, g, r, i, z and Ks imaging of
22.38 deg2 –after masking and quality cuts– within the
VIPERS-MLS (Moutard et al. 2016a), a follow-up program in the fields of the spectroscopic survey VIPERS (Guzzo et al. 2014), i.e., in the fields W1 and W4 of the Canada-France-Hawaii Telescope Legacy Survey4 (CFHTLS). The VIPERS-MLS optical imaging
has been based on the CFHTLS T0007 release (Hudelot et al. 2012) that reaches 80per cent completeness depth to i∼ 23.7, while the Ks-band data were obtained through new observations
reach-ing Ks ∼ 22 over ∼ 27 deg2. The multi-wavelength coverage of
the VIPERS-MLS has been complemented by GALEX (Martin &
GALEX Team 2005) FUV and NUV data combining preexisting
and new observations over ∼ 12.7 deg2, incorporated after using
u-band images as priors. For full details of the data processing and catalogue creation seeMoutard et al.(2016a).
Photometric redshifts were derived as described inMoutard
et al.(2016a) by using the template-fitting code Le Phare (Arnouts
et al. 2002; Ilbert et al. 2006). Photometric redshift (photo-z)
estimates were validated using extensive VIPERS spectroscopy (∼90,000 spectroscopic redshifts to i = 22.5; Scodeggio et al. 2018), combined with smaller numbers of high-quality redshifts taken from deeper spectroscopic datasets. Their accuracy is char-acterized by σδz/(1+z) ∼ 0.03 to i < 22.5 and σδz/(1+z) ∼ 0.05 for i > 22.5 galaxies, with corresponding catastrophic outlier rates of η = 1.2 per cent and η = 9 per cent (Moutard et al. 2016b, Figure 3). In the case of the faintest galaxies we considered in this paper, namely low-mass quiescent galaxies with M∗ < 109.7M around
z ∼ 0.65, the photo-z accuracy is better than σδz/(1+z) ∼ 0.04.
Star/galaxy separation (described in Moutard et al. 2016a) dis-carded 97 per cent of stars while keeping 99 per cent of galaxies.
Galaxy stellar masses were derived as described inMoutard
et al.(2016b) with Le Phare using dust-correctedBruzual &
Char-lot(2003, hereafter BC03) models of spectral energy distribution (SED), modified to include the effects of emission lines. Rest-frame colours were computed using the nearest observed-frame band in order to minimize dependence on model spectra. The depth of our data allows us to push our analysis to galaxies with M∗> 108.8M
around z ∼ 0.5, and M∗> 109.4M around z ∼ 0.65.
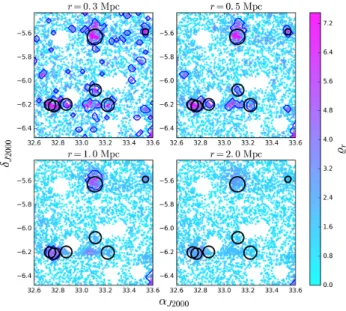
Figure 1. Map of the local density %rat 0.2 < z < 0.5, as measured in one
1 × 1 deg2patch of the VIPERS-MLS for different aperture radii r of 0.3,
0.5, 1 and 2 physical Mpc. Each point indicates the position of one galaxy and the colour codes the corresponding local density, as derived from Eq.
2, while blue contours delineate regions where %r> 4. Black circles reflect
the position and size of bright X-ray clusters identified in the XXL survey
(Pacaud et al. 2016).
2.2 Measurement of the local density
To measure the local density of environment surrounding galaxies in our photo-z sample, we adopted a method similar toLani et al.
(2013) andMalavasi et al.(2016). In brief, we counted the number of galaxies lying in a cylinder of fixed aperture centered on each galaxy for which we measured the density. The cylinder physical depth was set at 1 Gyr, which turned out to be a good compromise to avoid galaxy exclusion and excessive dilution in our case5(for a
detailed analysis of the completeness and purity associated with the use of photometric redshifts for reconstructing the galaxy density field, please refer toMalavasi et al. 2016).
It is convenient to define %, as the local density ρ normalized by the mean density of the Universe h ρ i at the same redshift:
% = ρ
hρ i =1+ δ (1)
where one can see that % can also be expressed in terms of the density contrast δ, as it is commonly defined.6Quoting %
rthe
nor-malized local density measured in cylinder of aperture radius r, we can write
%r =
nr/ ar
N/ A , (2)
where nris the number of surrounding galaxies within a cylinder
of aperture radius r and effective (i.e., non masked) area ar, and
Nis the total number of galaxies within the corresponding 1 Gyr
4 http://www.cfht.hawaii.edu/Science/CFHTLS/
5 A depth of 1 Gyr represents a redshift depth of∆z ' 0.13 − 0.15 around
z ∼0.65, i.e., ∼ 2 × the typical photo-z uncertainty affecting the faintest (quiescent) galaxies of our sample (namely, σδz/(1+z)' 0.04) and a redshift depth of∆z ' 0.1 − 0.13 at z . 0.5 (where σδz/(1+z) ' 0.03), which then corresponds to ∼ 3 × the photo-z uncertainty of our faintest galaxies.
6 The density contrast is defined by δ=ρ − h ρ i hρ i .
redshift layer over the entire effective area of the survey A (namely, 22.38 deg2 in the present analysis7). We emphasize that, while we
made use the normalized local density % in the present study, it is generally simply referred as the "local density" in the following, for sake of simplicity.
Aiming to better take advantage of the angular information, we tried several cylinder apertures with radii ranging from 0.3 to 2 physical Mpc (i.e., around the typical galaxy cluster size in the considered redshift range). Figure1shows the local density mea-sured in one 1 × 1 deg2patch of the VIPERS-MLS where we can
compare with a map of relaxed galaxy clusters from the XXL sur-vey (Pierre et al. 2016). Namely, we made use of ∼ 100 confirmed X-ray clusters from the XXL bright cluster sample (Pacaud et al. 2016). Selected with a flux lower limit of 3 × 10⁻¹⁴ergs−1cm−2in
the [0.5 − 2] keV band of the XMM-Newton satellite, most of XXL bright clusters have masses 7 × 10¹³M
≤ M500 ≤ 3 × 10¹⁴M
and redshifts 0.1 ≤ z ≤ 0.5. Unsurprisingly, as one can see, large apertures (r ≥ 1 Mpc) tend to smooth the density field, while small apertures (r . 0.3 Mpc) may provide noisier measurements of %r. We verified that a radius of 0.5 Mpc appears to be a good
compromise enabling the detection of over-dense regions whose angular distribution and size match that of bright X-ray clusters, while preventing the measured local density field from being too noisy8 by ensuring that over-densities are basically defined from
a significant number of galaxies (typically,& 20 galaxies for r=0.5 Mpc). As a matter of fact, by considering over-dense regions where %0.5 Mpc> 4 (blue contours in Fig.1), we recover 19/19 XXL bright
clusters lying in the VIPERS-MLS field at 0.2 < z < 0.5 (and 2/2 at 0.5 < z < 0.65).9
Figure2shows the local density map in the two fields of the VIPERS-MLS at 0.2 < z < 0.5, as measured in 0.5 Mpc radius apertures. The use of photo-z prevents us from being able to trace the subtleties of large-scale structures, like filaments. On the other hand, the method enables the detection of the most massive struc-tures such as clusters (typically seen with %0.5Mpc> 4, as shown in
Fig.1). As for over-densities having no bright XXL counterparts where the VIPERS-MLS and XXL survey overlap, we cannot ex-clude some of them to be artefacts. For example, due to the fact that our measure of the local density is projected along the cylinder depth, some large-scale structures may organise along the line of sight (e.g., filament or pair of overlapping groups/clusters).
However, the contribution of such alignments is expected to be low in a large-scale survey and, as shown and discussed in previous studies (see, e.g.,Muldrew et al. 2012;Haas et al. 2012;Lani et al.
2013;Malavasi et al. 2016), the uncertainties associated with the
use of photometric redshifts tend, on the contrary, to dilute real over-densities along the line of sight,10which therefore makes fake
detection of over-dense regions even less probable in our analysis. Moreover, some of these clusters may be not yet virialised clusters (i.e., they are faint or not X-ray emitters) or, even, simply not part of this early XXL release.
7 We used the K
spart of the VIPERS-MLS.
8 This may typically happen when a few galaxies are concentrated over
tiny effective areas.
9 Matching was performed according to both the angular position and the
redshift, within an angular radius corresponding to XXL cluster M500radii
and by considering the median angular position of our detected over-dense regions, while the redshift tolerance was determined by the typical photo-z uncertainties associated with the median redshift of the over-dense regions.
10 In the absence of any significant photometric-redshift bias or
catas-trophic outlier rate, which is the case in the present study.
We verified that our results were self-consistent by measuring local densities using an alternative approach based on distances to the nth-nearest neighbour (typically when n= 7). At the same time,
densities based on fixed aperture deal naturally well with masked areas (critical in W4) and were shown to correlate very well with high-mass halos (more precisely, when the aperture diameter scales with the virial radius of the halo, typically, < 1 Mpc;Muldrew et al.
2012;Haas et al. 2012), which is well suited to our analysis (where
the use of photometric redshifts allows the detection of fairly mas-sive galaxy clusters).
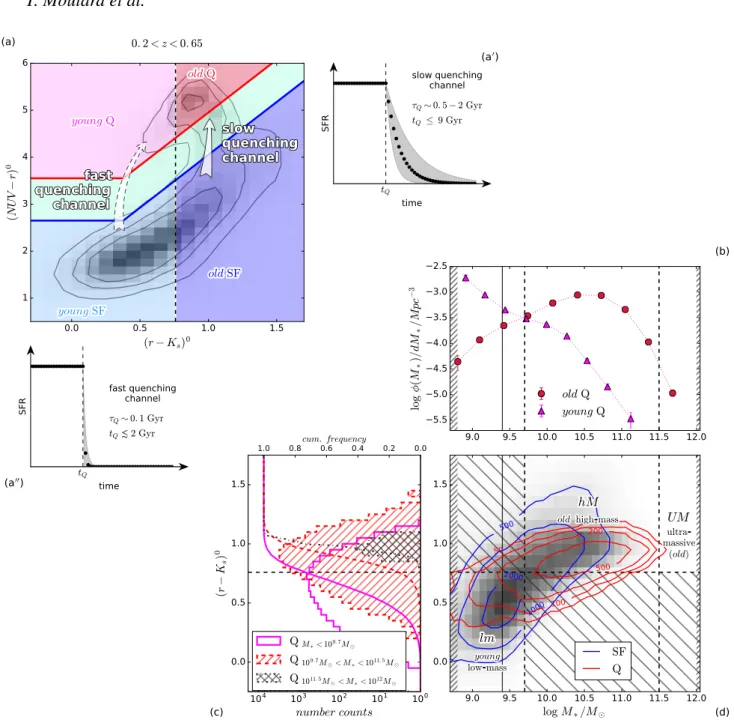
3 THE NUVRK DIAGRAM AS A TRACER OF GALAXY EVOLUTION
As shown byArnouts et al.(2013), the rest-frame NUV–r vs. r–K diagram (hereafter NUVrK diagram) is a powerful alternative to the rest-frame UVJ diagram (Williams et al. 2009) to separate quies-cent (Q) galaxies from (very dusty) star-forming (SF) galaxies. By extending the wavelength scope of the SED from NUV to NIR, the NUVrK diagram is indeed more sensitive to instantaneous SFR11
while being sensitive to stellar ageing and dust attenuation. This re-sults in the enlargement of the so-called green valley, i.e, the space that separates SF and Q galaxies, which allows for a robust selec-tion of star-forming, quiescent, and transiselec-tioning (i.e., quenching) galaxies.
3.1 Identifying two quenching channels in the NUVrK diagram
As shown inMoutard et al. (2016a), the volume probed in the VIPERS-MLS is well suited to probe rare populations, which may notably enable us to catch transitioning galaxies that were not ob-served in smaller surveys. This led us to identify a quenching chan-nel followed by fairly massive galaxies (typically when reaching stellar masses around the characteristic mass M?sf ' 1010.64M
;
Moutard et al. 2016b), as recalled in the following.
By quenching channel, we mean a pathway in the rest-frame NUVrK colour diagram that quenching galaxies follow from the star-forming population to the quiescent population. A quenching channel can be associated with an average star-formation history (SFH), which may be highlighted through comparison between colour evolution tracks predicted by stellar-population synthesis models and the actual distribution of galaxy rest-frame colours (see, e.g.,Schawinski et al. 2014;Marchesini et al. 2014;Moutard et al.
2016b;Pacifici et al. 2016a). In particular, the NUVrK diagram
turns out to be very well suited to distinguish SFHs characterized by different quenching time-scales (Moutard et al. 2016b, Fig. 20) for it is sensitive to very different star lifetimes on each of its axis: < 0.1 Gyr along the rest-frame NUV–r colour (Salim et al. 2005;
Martin et al. 2007), hereafter quoted (NUV − r)0, and > 1 Gyrs
along the rest-frame r–K colour (Arnouts et al. 2007;Williams et al. 2009), hereafter quoted (r − Ks)0. Indeed, (NUV − r)0traces recent
star-formation (thanks to rest-frame NUV), while (r − Ks)0results
from the combination of stellar ageing (i.e., the accumulation of generations of low-mass stars, notably traced by rest-frame r) and dust extinction (rest-frame r–Ksbeing a good tracer of the infrared
excess, i.e., the ratio between the UV light absorbed by dust and its
11 UV emission is sensitive to the lifetime of B/A stars, i.e., 10−2–10−1
Figure 2. Map of the local density measured at 0.2 < z < 0.5 in the fields W1 (top) and W4 (bottom) of the VIPERS-MLS. As in Fig.1, each point shows the position of a galaxy while the colour codes %0.5 Mpc, the local density measured in 0.5 Mpc radius apertures around each galaxy, and dark-blue contours
outline regions where %0.5 Mpc> 4 (associated with massive optical clusters). Black open circles shows the position of bright X-ray clusters identified as part
of the XXL survey, for comparison (only available in W1).
re-emission in the infrared;Arnouts et al. 2013): galaxy (r − Ks)0
colours are therefore expected to redden with cosmic time, on aver-age. Thus, in the NUVrK diagram, a galaxy experiencing an early and rapid quenching of the star formation will see its (NUV − r)0
colour rapidly reddened (typically by ∼ 1 mag) whilst its (r − Ks)0
colour will simultaneously remain blue, while a slow quenching will be characterised by the slow reddening of both the (NUV − r)0 and (r − Ks)0colours.
In Fig.3a, we show the NUVrK distribution of our galaxy sample at 0.2 < z < 0.65 and the corresponding selection of quies-cent and star-forming galaxies, as defined on both sides of the so-called "green valley" where one can identify a line of transitioning (i.e., quenching) galaxies concentrated at 0.76 < (r − Ks)0 < 1.23
that turn out to be fairly massive (> 60 per cent of galaxies with 1010.5< M
∗/M < 1011). We used the upper and lower limits of the
time-dependant selection of Q and SF galaxies defined inMoutard
et al.(2016b), so that galaxies in transition in the green valley are
excluded from our analysis. Namely, Q galaxies were selected with h (NUV − r)0> 3.772 − 0.029 × tl i ∩ h (NUV − r)0> 2.25 × (r − K s)0+ 2.768 − 0.029 × tl i (3) and SF galaxies with
h (NUV − r)0< 2.922 − 0.029 × tl i ∪ h (NUV − r)0< 2.25 × (r − K s)0+ 1.918 − 0.029 × tli , (4)
where tlis the look-back time at gigen redshift
12(for more detail,
please refer toMoutard et al. 2016b, Sect. 5.1).
One can see how a conservative cut at (r − Ks)0> 0.76 allows
us to isolate a population of old quiescent galaxies –i.e., galax-ies that exhibit colours typical of evolved (old and dusty) stel-lar populations– that is expected to be fed by the quenching of fairly high-mass star-forming galaxies reaching ∼ M?sf= 1010.64M
12 E.g., t
0.0 0.5 1.0 1.5
(
r
−K
s)
0 1 2 3 4 5 6(
N
U
V
−r
)
00
.
2
< z <
0
.
65
tQ time SFR slow quenching channel τQ∼0.5−2 Gyr tQ 9 Gyr tQ time SFR fast quenching channel τQ∼0.1 Gyr tQ 2 Gyr 9.0 9.5 10.0 10.5 11.0 11.5 12.0log
M
∗/M
¯ 0.0 0.5 1.0 1.5 500 1000 2000 50 100 200 500SF
Q
100 101 102 103 104number counts
0.0 0.5 1.0 1.5(
r
−K
s)
0Q
M∗< 109.7M¯Q
109.7M ¯< M∗< 1011.5M¯Q
1011.5M ¯< M∗< 1012M¯ 9.0 9.5 10.0 10.5 11.0 11.5 12.0 5.5 5.0 4.5 4.0 3.5 3.0 2.5lo
g
φ
(
M
∗)
/d
M
∗/M
pc
− 3old
Q
young
Q
0.0 0.2 0.4 0.6 0.8 1.0 cum. frequency(a)
(a
0)
(a
00)
(b)
(c)
(d)
Figure 3. NUVrK/stellar-mass selection scheme of the different classes of galaxies adopted in our analysis. (a) Galaxy distribution at 0.2 < z < 0.65 in the NUVrK diagram, which allows for the selection of quiescent (Q) galaxies (above the red line; see Eq.3) and star-forming (SF) ones (below the blue line; see Eq.4) on both sides of the so-called green valley (in green). The rest-frame colour cut at (r − Ks)0 = 0.76 (vertical black dashed line) enables the separation
between old galaxies (right), prone to slow quenching, and young galaxies (left), susceptible to fast quenching. Corresponding models of star-formation history (SFH) are shown in subpanels a0and a00, respectively: namely, constant star-formation rate (SFR) until the time of the quenching t
Q, followed by an exponential
decline with form SFR(time)∝ e−(time−tQ)/τQ, where the slow quenching of old galaxies is characterized by fairly long time-scales of τ
Q∼ 0.5 − 2 Gyrs while
younggalaxies are characterized by quenching time-scales of τQ ∼ 0.1 Gyr (Moutard et al. 2016b). (b) Stellar mass function (SMF) of old (red circles) and
young(magenta triangles) quiescent galaxies, as defined in panel a. (c) Number counts and cumulative frequencies in (r − Ks)0for quiescent galaxies of the
stellar-mass bins described in Sect.3.2: [M∗< 109.7M ] (magenta solid lines), [109.7< M∗/M < 1011.5] (red dashed lines) and [1011.5< M∗/M < 1012]
(grey dot-dashed lines). (d) Galaxy distribution at 0.2 < z < 0.65 in the stellar-mass vs. (r − Ks)0plan, and corresponding selection of young low-mass galaxies
(lm, Eq.5; responsible for the upturn observed in the quiescent SMF and susceptible to fast quenching), old high-mass galaxies (hM, Eq.6; responsible for the quiescent SMF build-up around M?sf∼ 1010.64M
and prone to quench slowly) and ultra-massive galaxies (UM, Eq.7; predominantly old and quiescent
at these redshifts). Isodensity contours for the star-forming population are reported in blue (namely for 500, 1000 and 2000 galaxies/pixel) and in red for the quiescent population (for 50, 100, 200, and 500 galaxies/pixel). The vertical thin black solid line shows the stellar mass completeness limit considered to z ∼0.65, with log Mlim/M = 9.4. Hatched regions indicate the stellar-mass and rest-frame color regimes that are excluded from our study (see Sect.3.2).
(red points in Fig.3b), while quiescent galaxies exhibiting bluer (r − Ks)0 < 0.76 colours –typical of younger stellar populations–
must have followed another quenching channel to turn quiescent (since galaxy (r − Ks)0colours only redden with time, as explained
above). Furthermore, as pointed out inMoutard et al.(2016b), these youngquiescent galaxies are essentially low-mass galaxies, and are thus responsible for the upturn observed in the SMF of quiescent galaxies at M∗< 109.7M (magenta triangles in Fig.3b).
Actually, considering simple e-folding SFH models turns out to be qualitatively and quantitatively well adapted to approximate the average SFHs associated with the flux of quenching galax-ies that cross the green valley (see, e.g.,Schawinski et al. 2014;
Moutard et al. 2016b;Pacifici et al. 2016b), the direction of this flux
being supported by the rising fraction of quiescent galaxies that ob-served with cosmic time from z ∼ 4 (e.g.,Muzzin et al. 2013;
Mort-lock et al. 2015). Doing so, rejuvenation episodes13that may affect
the SFR –and so, the (NUV − r)0colour14– of individual galaxies
are neglected. Indeed, considering an average SFH is equivalent to stacking the SFHs of individual galaxies, which tends to smooth the stochasticity that may characterise their SFRs across cosmic time. As detailed inMoutard et al.(2016b), the average SFH models con-sidered to explain the different quenching channels identified in the NUVrK diagram are characterised by a constant SFR while galax-ies are on the star-formation main sequence, until the time of the quenching tQ where the SFR drops as SFR(time) ∝ e−(time−tQ)/τQ
with a quenching time-scales τQ(as represented in panels a0and a00
of Fig.3).
The quenching channel followed by old high-mass galaxies has thus been shown to be characterised by fairly long time-scales of τQ∼ 0.5 − 2 Gyrs (Figs.3a,3a
0
). This corresponds to quenching durations of ∼ 1 − 3.5 Gyrs to cross the green valley after leaving the main sequence,15which is compatible with a strangulation
sce-nario where the cold gas inflows are impeded and the galaxy con-sumes slowly its reservoir of remaining gas (see, e.g.,Peng et al. 2015). In contrast, the quenching channel that would allow us to explain the presence of young low-mass quiescent galaxies must be characterised by shorter time-scales of τQ∼ 0.1 Gyrs (see Figs.3a,
3a00
), which corresponds to quenching durations of only ∼ 0.4 Gyrs to cross the green valley; as a corollary, young low-mass quiescent galaxies are also characterised by a recent quenching.
The NUVrK diagram is therefore a powerful tool to explore the different quenching channels that may be followed by galaxies across cosmic time: fast for (young) low-mass galaxies, slow for (old) high-mass ones.
3.2 Selection of (young) low-mass and (old) massive and ultra-massive galaxies
While young [(r − Ks)0 < 0.76] quiescent galaxies are essentially
low-mass galaxies, their stellar-mass distribution stretches to & 1010.5M
(Fig.3b). The relative fraction of these fairly massive
youngquiescent galaxies is therefore negligible when the stellar mass completeness limit Mlim lies below the upturn seen around
13 As observed in the local Universe (Salim & Rich 2010;Thomas et al.
2010) or predicted at higher redshift (Trayford et al. 2016).
14 SFR variations only affect (NUV − r)0, which traces recent
star-formation, not (r − Ks)0.
15 The set of tracks presented inMoutard et al.(2016b, Fig. 20) is limited
to the cases that are able to explain the presence of transitioning high-mass galaxies in the green valley, found to be concentrated at 0.76 < (r − Ks)0<
1.23, which is also visible here in Fig.3a.
M∗∼ 109.7M (namely, when Mlim 109.7M ), which is the case
in the VIPERS-MLS at z < 0.5 with Mlim ' 108.8M . Conversely,
low-mass [M∗ < 109.7M ] galaxies are mostly young at z < 0.5
(Fig.3c). In other words, on average, young galaxies are low-mass galaxies, and conversely. However, at higher redshift, our stellar mass completeness limit reaches Mlim' 109.4M at z < 0.65 due to
the Malmquist bias. The fraction of fairly massive [M∗> 109.7M ]
galaxies among young galaxies and, conversely, the fraction of old galaxies among low-mass [M∗ < 109.7M ] galaxies then become
non negligible. We therefore have to take this into account if we want to focus on low-mass galaxies that are prone to fast quench-ing at z > 0.5.
Aiming to push our analysis to z ∼ 0.65 (see Sect.4.2) while ensuring a simultaneous focus on (1) young low-mass galaxies, whose fast quenching is expected to be responsible for the low-mass upturn observed in the SMF of quiescent galaxies, and (2) old high-mass galaxies, whose slow quenching provides the bulk of the quiescent population around M?, we selected galaxies by combin-ing (r − Ks)0and stellar mass. As illustrated in Fig.3d, our refined
sample of low-mass (lm) galaxies was therefore selected with [ (r − Ks)0< 0.76 ] ∩ [Mlim≤ M∗≤ 109.7M ] (5)
and high-mass (hM) galaxies with
[ (r − Ks)0> 0.76 ] ∩ [ 109.7M < M∗≤ 1011.5M ] , (6)
which ensured the low-mass galaxies we considered to be mostly young(i.e., prone to fast quenching), even at 0.5 < z < 0.65 (where Mlim' 109.4M ).
We also selected a sample of ultra-massive (UM) galaxies with 1011.5M < M∗≤ 1012M , (7)
these galaxies being also essentially old to z= 0.65 (Fig.3c). This later stellar-mass bin with M∗ > 1011.5M was motivated by the
fact that these ultra-massive galaxies seem to be characterised by a peculiar evolution of their number density since z ∼ 1 with respect to less massive galaxies (seeMoutard et al. 2016b, Fig. 15). Being all old galaxies and (almost) all quiescent since this epoch, their evolution is expected to be mostly driven by dry mergers in rich en-vironments. Moreover, these ultra-massive galaxies embody a very advanced stage of galaxy stellar-mass assembly and set therefore a benchmark that is relevant to compare with when considering less massive galaxies.
Combining with the selection of quiescent and star-forming galaxies allowed by the NUVrK diagram (Eqs.3and4), this led to defining five classes of galaxies:
i)quiescent (young) low-mass galaxies, quoted Qlm, responsible for
the upturn observed in the quiescent SMF and expected to have ex-perienced a fast quenching and
ii)star-forming (young) low-mass galaxies, quoted SFlm,
consti-tuting the reservoir of galaxies that might experience such fast quenching;
iii)quiescent (old) high-mass galaxies, quoted QhM, responsible for
the build-up of the quiescent SMF around M?sf∼ 1010.64M and
ex-pected to follow a slow quenching channel and
iv)star-forming (old) high-mass galaxies, quoted SFhM, that are
prone to follow this slow quenching channel;
v)and finally ultra-massive galaxies, quoted QUM, already old and
4 RESULTS
4.1 Environments vs. quenching channels
Aiming to explore the impact of environment on the quenching of star formation, we compared the probability distribution functions (PDFs) of the local density % measured for the different categories of galaxies defined in Sect.3.2.
In Fig.4a, we focus on the quiescent population, divided into low-mass, high-mass and ultra-massive galaxies at 0.2 < z < 0.5. In order to characterise each PDF with one single value, that can be seen as the typical local density associated with the corresponding underlying population, we computed the median for each PDF(%), denoted ˜% (shown with vertical arrows). The PDF and PDF-median errorbars were estimated through bootstrap resampling (made of 5000 resamples), which accounts for Poissonian uncertainties. The first result springing up from the analysis is the confirmation that ultra-massive galaxies clearly reside in the densest environments, with a median local density found to be ˜%q
UM = 2.59+0.28−0.16(grey
ar-rows in Fig. 4a). Unsurprisingly, less massive quiescent galaxies are characterised by lower local densities.
Interestingly, however, low-mass quiescent galaxies clearly appear to be located in denser environments than high-mass ones, especially at 0.2 < z < 0.5 where ˜%q
lm = 1.80+0.02−0.02(magenta) and
˜%q
hM = 1.60+0.01−0.01 (red). We verified that the distributions were not
drown from an identical underlying population (with respect to the projected local density) with the popular and widely used K-S test and the more robust Anderson-Darling test (Anderson & Darling 1952,1954).16Both tests confirmed that the two distributions are
different at more than 99.99 per cent confidence.
Next, aiming to see if and how the quiescence of galaxies correlates with environment, we compared the PDFs of the local densities measured for quiescent (Q) galaxies with those of star-forming (SF) ones in Fig.4b. Similarly to Fig.4a, local density PDFs are shown for low-mass galaxies (light blue) and high-mass ones (dark blue).17One can first notice a weak –though detectable–
trend that tends to make us observe high-mass star-forming galax-ies in slightly denser environments than less massive ones. At the same time, star-forming galaxies exhibit local densities that peak near the average density of the Universe, clearly less dense than that of quiescent galaxies regardless of the stellar mass.
As a matter of fact, the difference of median density exhib-ited by low-mass galaxies according to the star-formation activity is unambiguously the strongest. We have indeed ˜%sf
lm = 1.20+0.01−0.01
for star-forming galaxies and ˜%q
lm = 1.80+0.02−0.02 for quiescent ones
at 0.2 < z < 0.5. In fact, we may define the deviation of local density associated with quiescence,∆q˜% = ˜%q− ˜%sf, which
repre-sents a deviation of∆q˜%
lm'+0.60 in the case of low-mass galaxies
(dashed light green arrow in Fig.4b). As for high-mass galaxies, we also report a non-negligible but weaker local density deviation between star-forming and quiescent galaxies, with ˜%sf
hM= 1.27+0.01−0.01
and ˜%q
hM = 1.60+0.01−0.01, i.e.∆ q˜%
hM '+0.33 (dark green arrow in Fig.
4b).
This confirms that quiescent galaxies are, on average, located in denser environments than star-forming ones, both for low-mass
16 The Anderson-Darling test is notably more sensitive to the tails of the
distributions (for more details on statistical tests for astronomy and compar-isons see, e.g.,Babu & Feigelson 2006;Hou et al. 2009).
17 Ultra-massive galaxies are almost all quiescent, only 4/110 galaxies
could have been classified as star-forming at 0.2 < z < 0.5 (and 7/55 at 0.5 < z < 0.65), which would prevent us from computing any robust local density PDF.
and high-mass galaxies. But the key finding of our analysis is that low-mass galaxies, also identified as prone to being quenched through a fast quenching channel (cf. Sect.3.2), require a much stronger increase of their typical local density to be observed as quiescent than high-mass galaxies, prone to follow a slow quench-ing channel, as we discuss later in this paper (Sect.5.2).
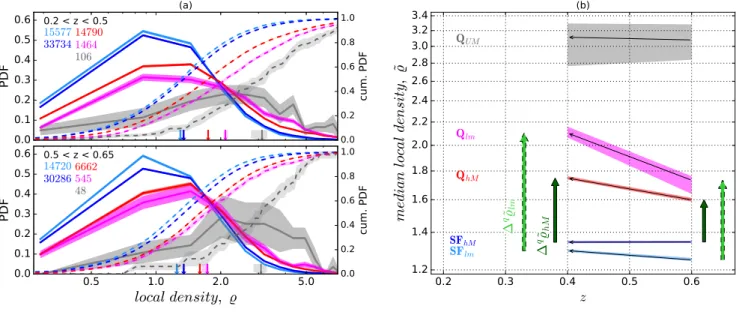
4.2 Local density evolution
Aiming to observe the evolution of typical densities across redshift, we considered the additional redshift bin 0.5 < z < 0.65. The up-per redshift limit was set so that it allowed us to probe the excess of low-mass quiescent galaxies at higher redshift while being com-plete in mass, in addition to ensuring two redshift bins of similar comoving volumes.18To enable comparison of local densities
be-tween our redshift bins, we repeated the same analysis than what is presented in Sect.4.1, but we only considered galaxies more massive than the stellar mass completeness limit of the highest redshift bin, namely Mlim = 109.4M , both at 0.2 < z < 0.5 and
0.5 < z < 0.65.
In Fig.5a we show PDF(%) for the different classes of galaxies we selected (cf. Sect.3.2), as traced by galaxies with M∗> 109.4M
both at 0.2 < z < 0.5 (top) and 0.5 < z < 0.65 (bottom), where ver-tical arrows reflect the corresponding values of ˜%, similarly to Fig. 4. One may notice how the introduction of a higher stellar-mass completeness limit (Mlim= 109.4M instead of Mlim= 108.8M )
re-duces the number of low-mass galaxies at 0.2 < z < 0.5 (compared to Fig.4), galaxies with Mlim < 109.4M being discarded, and
con-sequently how this affects the measurements of the local density % (as traced by the median local density ˜%). The total number of galaxies is indeed reduced when considering M∗> Mlim= 109.4M
instead of M∗> Mlim= 108.8M and we recall that % is normalized
by the mean density of the Universe at the same redshift (cf. Sect. 2.2), which proportional to the total number of considered galaxies (Eq.2). It is therefore expected to measure lower values of ˜% when considering a higher stellar-mass limit. The trends we measure are, however, consistent at z < 0.5 with Mlim(z < 0.5) = 108.8M or
Mlim(z < 0.65)= 109.4M , which confirms our conclusions.
One may thus notice that, as at 0.2 < z < 0.5, ultra-massive galaxies are characterized by the highest local density we mea-sured and that, at lower stellar mass, quiescent galaxies are gen-erally characterised by much higher local local densities than star-forming ones at 0.5 < z < 0.65. In particular, considering quies-cent galaxies, Qlmgalaxies may already be characterized by higher
local densities than QhM ones at 0.5 < z < 0.65, although
con-sidering PDF uncertainties, local densities of low-mass and high-mass quiescent galaxies may be considered to be similar.19In any
event, the deviation observed between the local density of quiescent and star-forming galaxies for low-mass galaxies (∆q˜%
lm '+0.48)
is already larger than for high-mass galaxies (∆q˜%
hM ' +0.35) at
0.5 < z < 0.65. The fact that the quiescence of low-mass galaxies,
18 Respectively, ∼ 4.97 × 10⁶h−3Mpc3 and ∼ 4.84 × 10⁶h−3Mpc3 at
0.2 < z < 0.5 and 0.5 < z < 0.65.
19 At 0.5 < z < 0.65, the confidence given by an Anderson-Darling test
of having ˜%lm> ˜%hMis 99.99 per cent for median PDFs, 93 per cent when
considering the ±1σ PDF uncertainties estimated from 5000 bootstrap re-samples (i.e., confidence level is at least of 93 per cent for 84 per cent of resamples; cf. envelops reported in Fig.5) and this confidence would drop to 57 per cent in a very conservative approach considering ±2σ PDF uncer-tainties (i.e., confidence level is > 57 per cent for 95.6 per cent of resam-ples).
0.5
1.0
2.0
5.0
local density, %
0.0
0.1
0.2
0.3
0.4
0.5
0.6
0.0
0.2
0.4
0.6
0.8
1.0
cum. PDF
(a)
0.5
1.0
2.0
5.0
local density, %
0.0
0.1
0.2
0.3
0.4
0.5
0.6
0.0
0.2
0.4
0.6
0.8
1.0
cum. PDF
(b)
Figure 4. Probability distribution function (PDF) of the local density %, as measured in 0.5 Mpc radius apertures at redshift 0.2 < z < 0.5 for (a) quiescent low-mass (magenta), high-mass (red) and ultra-massive (grey) galaxies and (b) comparison with star-forming counterparts for low-mass (cyan), high-mass (blue) galaxies. Dashed lines show the corresponding cumulative PDFs, while vertical arrows show the corresponding typical local densities, ˜%, defined as PDF medians. Only galaxies with M∗ ≥ Mlim(z < 0.5)= 108.8M are considered. Shaded envelops represent the corresponding ±1σ uncertainties derived from
5000 bootstrap resamples, while the galaxy number of each subsample is written in the upper left corner. Horizontal green arrows (in panel b) show the local density deviation associated with the different quenching channels: ∆q˜%
lm(dashed light green arrows) and∆q˜%hM(dark green arrows) for low-mass galaxies
prone to fast quenching and high-mass galaxies prone slow quenching, respectively (cf. Sect.3.2).
0.0
0.1
0.2
0.3
0.4
0.5
0.6
0.2 < z < 0.5
14790
1464
106
15577
33734
0.5
1.0
2.0
5.0
local density, %
0.0
0.1
0.2
0.3
0.4
0.5
0.6
0.5 < z < 0.65
6662
545
48
14720
30286
0.2
0.3
0.4
0.5
0.6
z
1.2
1.4
1.6
1.8
2.0
2.2
2.4
2.6
2.8
3.0
3.2
3.4
m
ed
ia
n
lo
ca
ld
en
si
ty
,
˜
%
(b)
Q
lmQ
hMQ
UMSFlm
SF
hM 0.0 0.2 0.4 0.6 0.8 1.0cum. PDF
(a)
0.0 0.2 0.4 0.6 0.8 1.0cum. PDF
Figure 5. Evolution of local densities with redshift, considering galaxies with M∗≥ Mlim(z < 0.65)= 109.4M . (a) PDF(%) (solid lines) and cumulative PDF(%)
(dashed lines) at redshift 0.2 < z < 0.5 (top) and 0.5 < z < 0.65 (bottom) for the different classes of galaxies defined in Sect.3.2: low-mass quiescent (Qlm;
magenta) and star-forming (SFlm; light blue) galaxies, high-mass quiescent (QhM; red) and star-forming (SFhM; dark blue) ones and ultra-massive galaxies
(QUM; grey). The galaxy number of each subsample is written in the upper left corner. (b) Corresponding evolution of the median local density ˜% (cf. Sect.4)
with redshift between z ∼ 0.6 and z ∼ 0.4 (median redshifts of 0.5 < z < 0.65 and 0.2 < z < 0.5, respectively). Similarly to Fig.4, shaded envelopes represent the corresponding ±1σ, as derived from bootstrap resampling. Vertical green arrows show the local density deviation associated with the different quenching channels, at 0.2 < z < 0.5 and 0.5 < z < 0.65;∆q˜%
lm(dashed light green arrows) and∆q˜%hM(dark green arrows) for low-mass galaxies prone to fast quenching
and high-mass galaxies prone slow quenching, respectively (cf. Sect.3.2).
associated with fast quenching (cf. Sect.3.2), requires a stronger increase of the local density to be observed than the quiescence of high-mass galaxies is therefore confirmed at 0.5 < z < 0.65 as well. Focussing on the redshift evolution of the typical local density, Fig.5b shows the evolution of ˜% between z ∼ 0.6 (median redshift of galaxies in our highest redshift bin, 0.5 < z < 0.65) and z ∼ 0.4
(median redshift of galaxies at 0.2 < z < 0.5) for the different classes of galaxies we considered. It is thus interesting to notice how constant the typical local density of high-mass star-forming galaxies appears to be constant (∆z˜%sf
hM' 0), whilst the typical local
density of their quiescent counterparts is characterised by a clear increase of∆z˜%q
results in the increase of the local density deviation between star-forming and quiescent high-mass galaxies from∆q˜%
hM'+0.25 at
z ∼0.6 to∆q˜%
hM '+0.40 at z ∼ 0.4, therefore essentially due to
the fact that the local density of high-mass quiescent galaxies has increased with cosmic time, on average.
At the same time, Fig.5b reveals an even stronger increase of the typical local density ˜%lmfor low-mass quiescent galaxies, with
a variation of∆z˜%q
lm '+0.52, which needs to be weighted by the
fact that their star-forming counterparts also experienced a small increase of their typical local density with∆z˜%sf
lm'+0.05. Still, this
results in what appears to be a strong increase of local density de-viation observed between star-forming and quiescent for low-mass galaxies from z ∼ 0.6 to z ∼ 0.4, namely, from∆q˜%
lm'+0.48 to
∆q˜%
lm'+0.80, compared to high-mass galaxies. While this traces
indeed the fact that, on average, the local density of low-mass qui-escent galaxies has increased faster with cosmic time than what we observe for high mass galaxies, we will see how the remarkable in-creases of both ˜%q lm(i.e.,∆ z˜%q lmby definition) and∆ q˜% lmwith cosmic
time may be explained by the simultaneous modest increase of ˜%sf lm
(see Sect.5.3).
One may finally notice that ˜%q
UM might exhibit a very small
increase with cosmic time, with∆z˜%q
UM '+0.03 between z ∼ 0.6
and z ∼ 0.4 (from ˜%q
UM = 3.08+0.20−0.24to ˜% q
UM = 3.11+0.18−0.35). However,
one can see how the uncertainties affecting ˜%q
UMallow for a
varia-tion −0.52. ∆z˜%q
UM. +0.45, which prevents us from drawing any
conclusion about the local density evolution experienced by ultra-massive galaxies.
5 DISCUSSION
We have seen in Sect.4how different may be the local density of galaxies depending on whether they are quiescent or not and, above all, depending on the quenching channel they are prone to follow (fast for low-mass galaxies or slow for high-mass galaxies), and then how this may evolve with cosmic time at 0.2 < z < 0.65. In this section, we discuss our results and notably the connection between environment and star-formation quenching that may be highlighted, in particular, the impact of environment on the (fast) quenching of (young) low-mass galaxies and its evolution with cos-mic time.
5.1 Ultra-massive galaxies reside in very dense environments As is obvious in Fig.5b, ultra-massive galaxies are by far located in the densest environments that were measured in our analysis. These ultra-massive galaxies are almost all quiescent and characterised by old stellar populations from z ∼ 0.6. This makes them good candi-dates for subsequent growth via (dry) mergers, as already proposed (see, e.g.,De Lucia et al. 2006;De Lucia & Blaizot 2007;Cattaneo
et al. 2011;Moutard et al. 2016b;Lee & Yi 2017;Groenewald et al.
2017).
At the same time, though non-negligible compared to smaller surveys at the similar redshift, the limited number of ultra-massive (M∗ > 1011.5M ) galaxies in our analysis (106 at 0.2 < z < 0.5,
48 at 0.5 < z < 0.65) prevented us from constraining the evolution of their local density at 0.2 < z < 0.65. Constraining such evolu-tion would be of high interest to explore the growth of structures on different scales. Indeed, for instance, a decreasing local density around an ultra-massive galaxy may support a picture where the galaxy merger rate within the host structure is higher than the rate at which new galaxies fall onto the structure, and vice versa.
In any case, the high local densities measured around ultra-massive galaxies support a picture where these galaxies are experi-encing a very advanced stage of both galaxy stellar-mass assembly and galaxy clustering.
5.2 The role of environment in the quenching of low-mass galaxies
As described in Sect.4, when focussing on high-mass galaxies, one can see that quiescent galaxies are characterised by higher typical local densities than star-forming ones, as traced by∆q˜%
hM, both at
0.2 < z < 0.5 and 0.5 < z < 0.65 (Fig.4b). This is expected because among high-mass star-forming galaxies, the most massive quench first (see, e.g.,Moutard et al. 2016b). At the same time, more mas-sive galaxies are expected to be more clustered on large-scales (typ-ically, what happens around filaments;Malavasi et al. 2017). More massive galaxies are indeed hosted by more massive DM halos, on average, while halo clustering increases with halo mass (given the hierarchical growth of DM structures with cosmic time). In this re-spect, our study is therefore consistent with many previous studies that have emphasized the fact that quiescent galaxies are preferen-tially located in denser environments, and in particular concerning massive galaxies with M∗& 1010M (e.g.,Kauffmann et al. 2004;
Baldry et al. 2006;Lani et al. 2013;Malavasi et al. 2017;
Ethering-ton et al. 2017;Cucciati et al. 2017).
The interest of the present analysis is, however, its ability to disentangle the impact of environment on different categories of galaxies that are prone to follow different quenching channels: slowly quenched (old) high-mass galaxies feeding the quiescent population around M?sf' 1010.64M
, and (young) low-mass
galax-ies subject to a fast quenching (cf. Fig.3) responsible for the ex-cess of quiescent galaxies at M∗ < 109.7M . Thus, the first
re-markable result of our analysis is the fact that these low-mass qui-escent galaxies were already located in denser environments than high-mass quiescent galaxies at 0.2 < z < 0.5 and probably as of 0.5 < z < 0.65, as observed in the local Universe (e.g.,Hogg et al.
2003;Haines et al. 2007).
The role of environment in the quenching of low-mass galax-ies is confirmed by the deviation of the typical local density ob-served between the star-forming and quiescent populations,∆q˜%:
besides the fact that quiescent low-mass galaxies appear to be lo-cated in much denser environment than their star-forming coun-terparts, the local density deviation between star-forming and qui-escent galaxies is more than twice stronger for low-mass galaxies (∆q˜%
lm ' +0.80) than for high-mass ones (∆q˜%hM ' +0.41). In
other words, the quiescence of low-mass galaxies requires a much stronger increase of the local density than the quiescence of high-mass galaxies.
This is therefore consistent with a picture where the upturn observed at low-mass in the SMF of quiescent galaxies is due to the (fast) quenching of (young) low-mass galaxies, due to mecha-nisms that involve rich environments, as observed in the local Uni-verse (Hogg et al. 2003;Haines et al. 2007;Peng et al. 2012). Our analysis shows that such a picture is also valid at 0.2 < z < 0.65, confirming and complementing the study ofGuo et al.(2017) who recently correlated the quenching of low-mass galaxies with rich environments at 0.5 < z < 1 in the CANDELS fields. While con-firming that environment already played a significant role at earlier times, when large-scale structures were less developed, this raises the question of the importance of environmental quenching across cosmic time.
5.3 A rising importance of environmental quenching with cosmic time?
When focussing on low-mass galaxies, we noticed in Sect.4.2that the typical local density of SF galaxies slightly increased from z ∼0.6 to z ∼ 0.420(∆z˜%sf
lmin Fig.5b), which reflects the fact that
an increasing fraction of SFlm galaxies has been characterised by
rich environments with decreasing redshift. At the same time, we observed a stronger increase of the typical density for Qlm
galax-ies, even already found to be located in much richer environments than their SFlmcounterparts from z ∼ 0.6 (∆z˜%qlmin Fig.5b). While
the increase of the typical local density is due to the growth of large-scale structures that host a growing number of galaxies, the fairly modest increase of∆z˜%sf
lmobserved for SFlmgalaxies is
ex-pected if the vast majority of these galaxies are field galaxies, while Qlm galaxies are preferentially located in rich environments and
fully experience the growing number of galaxies within large-scale structures.
Actually, while the number of SFlmgalaxies located in fairly
rich environments is small compared to the total number of SFlm
galaxies, it represents a significant number compared to the number of corresponding Qlmgalaxies. The size of the entire SFlmgalaxy
population is indeed 10–30 times larger than that of Qlmgalaxies in
our sample (cf. Fig5). For example, the fraction of SFlmgalaxies
located in very dense regions where we measure % > 4 (i.e., 4 times the mean local density of the Universe at the same redshift) is only 1.3 per cent at z ∼ 0.6 and 2.7 per cent at z ∼ 0.4, which represents an increase of the number of these galaxies from 195 to 435, whilst the corresponding fraction of Qlmgalaxies increased from 9.5 per
cent to 19.6 per cent, but involving fewer galaxies, with 52 and 287 Qlmgalaxies at z ∼ 0.6 and z ∼ 0.4, respectively. This highlights
how the increasing number of SFlmgalaxies that are characterised
by very rich environments is able to feed the strong increase of the number of Qlmobserved in corresponding environments (the
con-tribution of Qlmto the low-mass population increasing from 21 per
cent to 40 per cent between z ∼ 0.6 and z ∼ 0.4). It is, more-over, interesting to note here that SFlm galaxies remain more
nu-merous than their Qlmcounterparts (79 per cent to 60 per cent at
z ∼ 0.6 and z ∼ 0.4, respectively) in these very dense regions, as discussed in the next section. In other words, this tends to confirm a picture where the reservoir of low-mass galaxies susceptible to environmental quenching is growing with cosmic time, following the growth of large-scale structures that host a growing number of galaxies.
On the other hand, the fact that the comoving number den-sity of low-mass quenched galaxies has increased with cosmic time does not mean that the corresponding quenching has become more important: the number of low-mass galaxies having quenched via environmental quenching has to be compared with that of high-mass galaxies quenched via high-mass quenching across cosmic time. In order to quantify the contribution of the environmental quench-ing channel followed by low-mass galaxies, one may define the low-to-high-mass ratio of the quiescent population at given red-shift, Rq
lm/hM, derived as the comoving number density of low-mass
environmentally-quenched galaxies Nq
lm relative to that of
high-20 We recall that, to ensure completeness over the entire redshift range
0.2 < z < 0.65, low-mass galaxies have stellar masses 109.4M ≤ M∗ <
109.7M .
mass mass-quenched galaxies Nq hM, as Rq lm/hM= Nq lm Nq hM . (8)
One may thus observe a modest but detectable increase of this ratio from Rq
lm/hM= 0.082 ± 0.005 to 0.099 ± 0.003 between z ∼ 0.6 and
z ∼ 0.4. Yet, this seeming evolution of Rq
lm/hMmight be artificial,
due to the fact that faint quiescent galaxies are expected to be the firsts to suffer from incompleteness with increasing redshift. As a matter of fact, the completeness limit we adopted (namely, M∗ ≥
Mlim= 109.4M ) ensures our quiescent sample to be more than 95
per cent complete at z < 0.65, but in the particular case of low-mass quiescent galaxies, the completeness can drop to ∼ 80 per cent around z ∼ 0.6 (against ≥ 95 per cent at z < 0.5). If we assume, in a conservative approach, that all low-mass galaxies suffer from such incompleteness at z > 0.5, the low-to-high-mass ratio of the quiescent population would rather approach Rq
lm/hM= 0.097±0.005
at z ∼ 0.6 (against 0.099 ± 0.003 at z ∼ 0.4), which would therefore be consistent with no evolution of Rq
lm/hMwith cosmic time at 0.2 <
z < 0.65. In other words, the differential incompleteness of low-mass quiescent galaxies at z < 0.5 and z < 0.65 might be sufficient to explain the increase of Rq
lm/hMthat we detected between z ∼ 0.6
and z ∼ 0.4.
Nevertheless, the rapid build-up of the low-mass quiescent population observed over the same redshift range from deeper sur-veys (∼0.5 dex around M∗ ∼ 109M , against ∼0.1 dex around
M∗∼ 1010.5M , e.g., in COSMOS;Davidzon et al. 2017) suggests
a rising share of low-mass galaxies in the quiescent population, which might plead for a rising importance of the environmental-quenching channel (followed by low-mass galaxies) compared to the mass-quenching channel (followed by high-mass galaxies). This picture might be supported by the fact that the highest den-sity regions reveal a rising fraction of low-mass quiescent galax-ies with cosmic time from z ∼ 2 (e.g.,Papovich et al. 2018), but the corresponding number of environmentally-quenched galaxies should be compared to the simultaneous number of mass-quenched galaxies. Upcoming large surveys combining deeper optical and near-infrared observations will allow us to verify whether the im-portance of the environmental quenching channel followed by low-mass galaxies has risen with cosmic time at late epochs.
In any case, our results confirmed that a rising number of low-mass galaxies have been prone to experiencing environmen-tal quenching with cosmic time. The mechanism(s) that may be in-volved in such environment-driven quenching of low-mass galaxies remain(s), however, a matter of debate, which might be interesting to address in the light of all the elements we gathered so far.
5.4 Composite picture of the environmental quenching channel followed by low-mass galaxies
As discussed extensively in the present paper, the quenching of low-mass galaxies is associated with a strong increase of their local density, which allow us to link the quenching of these galaxies with environmental effects.
At the same time, low-mass quiescent galaxies have been shown to be essentially young quiescent galaxies (i.e., charac-terised by young stellar populations; cf. Sect.3.2), which has been shown to require a fast quenching (see, e.g.,Schawinski et al. 2014;
Moutard et al. 2016b;Pacifici et al. 2016a,b). Low-mass quiescent
galaxies are therefore recently quenched galaxies. This is consistent with the fact that they exhibit rest-frame colours that are similar to those of post-starburst galaxies (Kriek et al. 2010;Whitaker et al.