HAL Id: insu-03186685
https://hal-insu.archives-ouvertes.fr/insu-03186685
Submitted on 1 Jun 2021
HAL is a multi-disciplinary open access
archive for the deposit and dissemination of
sci-entific research documents, whether they are
pub-lished or not. The documents may come from
teaching and research institutions in France or
abroad, or from public or private research centers.
L’archive ouverte pluridisciplinaire HAL, est
destinée au dépôt et à la diffusion de documents
scientifiques de niveau recherche, publiés ou non,
émanant des établissements d’enseignement et de
recherche français ou étrangers, des laboratoires
publics ou privés.
J. Lewis, J. Eigenbrode, G. Wong, A. Mcadam, P. Archer, B. Sutter, M.
Millan, R. Williams, Melissa Guzman, A. Das, et al.
To cite this version:
J. Lewis, J. Eigenbrode, G. Wong, A. Mcadam, P. Archer, et al.. Pyrolysis of Oxalate, Acetate,
and Perchlorate Mixtures and the Implications for Organic Salts on Mars. Journal of Geophysical
Research. Planets, Wiley-Blackwell, 2021, �10.1029/2020JE006803�. �insu-03186685�
Abstract
Organic salts, such as Fe, Ca, and Mg oxalates and acetates, may be widespread radiolysis and oxidation products of organic matter in Martian surface sediments. Such organic salts are challenging to identify by evolved gas analysis but the ubiquitous CO2 and CO in pyrolysis data from the Sample Analysis at Mars (SAM) instrument suite on the Curiosity rover indirectly points to their presence. Here, we examined laboratory results from SAM-like analyses of organic salts as pure phases, as trace phases mixed with silica, and in mixtures with Ca and Mg perchlorates. Pure oxalates evolved CO2 and CO, while pure acetates evolved CO2 and a diverse range of organic products dominated by acetone and acetic acid. Dispersal within silica caused minor peak shifting, decreased the amounts of CO2 evolved by the acetate standards, and altered the relative abundances of the organic products of acetate pyrolysis. The perchlorate salts scrubbed Fe oxalate CO releases and shifted the CO2 peaks to lower temperatures, whereas with Ca and Mg oxalate, a weaker CO release was observed but the initial CO2 evolutions were largely unchanged. The perchlorates induced a stronger CO2 release from acetates at the expense of other products. Oxalates evolved ∼47% more CO2 and acetates yielded ∼69% more CO2 when the perchlorates were abundant. The most compelling fits between our organic salt data and SAM CO2 and CO data included Martian samples acquired from modern eolian deposits and sedimentary rocks with evidence for low-temperature alteration.Plain Language Summary
In our efforts to characterize indigenous Martian organic matter, we must contend with a near-surface record that has been substantially altered by radiation and oxidation. Under such conditions, much of the surficial organic record on Mars may have decomposed into organic salts, which are challenging for flight instruments to conclusively identify. If organic salts are widespread on the Martian surface, their composition and distribution could offer insight into the less-altered organic record at depth and they may play an important role in near-surface carbon cycling and habitability. The organic detection techniques employed by the Mars Science Laboratory Curiosity rover include thermal extraction in combination with mass spectrometry. In this work, we used laboratory thermal extraction techniques analogous to those of the rover to examine organic salts as pure standards, as minor phases in a silica matrix, and in mixtures with O2-evolving perchlorate salts. When we compared our results with flight data, we found that many of the CO2 profiles produced by our organic salt samples were similar to the CO2 evolutions observed by the rover. The best fits with our laboratory data included Martian materials acquired from modern eolian deposits and sedimentary rocks that had evidence for low-temperature alteration.© 2021. The Authors.
This is an open access article under the terms of the Creative Commons Attribution-NonCommercial-NoDerivs
License, which permits use and distribution in any medium, provided the original work is properly cited, the use is non-commercial and no modifications or adaptations are made.
J. M. T. Lewis1,2,3 , J. L. Eigenbrode2 , G. M. Wong4 , A. C. McAdam2 , P. D. Archer5, B. Sutter5 , M. Millan2,6 , R. H. Williams2,3,7, M. Guzman8 , A. Das9 , E. B. Rampe10 , C. N. Achilles2,11 , H. B. Franz2, S. Andrejkovičová12 , C. A. Knudson2,3,7 , and
P. R. Mahaffy2
1Department of Physics and Astronomy, Howard University, Washington, DC, USA, 2NASA Goddard Space Flight Center, Greenbelt, MD, USA, 3Center for Research and Exploration in Space Science and Technology, NASA GSFC, Greenbelt, MD, USA, 4Department of Geosciences, The Pennsylvania State University, University Park, PA, USA, 5Jacobs, NASA Johnson Space Center, Houston, TX, USA, 6Department of Biology, Georgetown University, Washington, DC, USA, 7Center for Research and Exploration in Space Science and Technology, University of Maryland, College Park, MD, USA, 8LATMOS/IPSL, UVSQ Université Paris-Saclay, Sorbonne Université, CNRS, Guyancourt, France, 9International Space University, Strasbourg, France, 10NASA Johnson Space Center, Houston, TX, USA, 11Universities Space Research Association, Columbia, MD, USA, 12Geosciences Department, GEOBIOTEC Unit, Aveiro University, Aveiro, Portugal
Key Points:
• Flight-like thermal analyses of organic salts suggest such phases may have been present in many of the samples analyzed by Mars missions
• Perchlorates greatly impacted the thermal decomposition of organic salts and enhanced CO2 production at the expense of other products • The most compelling hints of
organic salts occurred in pyrolysis data from altered Martian sedimentary rocks and modern eolian deposits
Supporting Information:
Supporting Information may be found in the online version of this article.
Correspondence to:
J. M. T. Lewis, [email protected]
Citation:
Lewis, J. M. T., Eigenbrode, J. L., Wong, G. M., McAdam, A. C., Archer, P. D., Sutter, B., et al. (2021). Pyrolysis of oxalate, acetate, and perchlorate mixtures and the implications for organic salts on Mars. Journal of Geophysical Research: Planets, 126, e2020JE006803. https://doi. org/10.1029/2020JE006803 Received 21 DEC 2020 Accepted 26 FEB 2021 Author Contributions: Conceptualization: J. M. T. Lewis, J. L. Eigenbrode, G. M. Wong
Data curation: J. M. T. Lewis, P. D.
Archer, M. Millan
Formal analysis: J. M. T. Lewis, G. M.
Wong, S. Andrejkovičová
Funding acquisition: J. L. Eigenbrode,
1. Introduction
Organic matter preserved in the Martian rock record represents an invaluable resource for exploring the planet's carbon cycle, habitability, and potential biology through time. However, near-surface Martian organic matter is susceptible to transformation by ionizing radiation and oxidation (Benner et al., 2000; Biemann & Lavoie, 1979; Chun et al., 1978; Dartnell et al., 2012; Hassler et al., 2014; Lasne et al., 2016; Oró & Holzer, 1979; A. A. Pavlov et al., 2012; A. K. Pavlov et al., 2002; Poch et al., 2014). Flight instruments seek-ing to detect and characterize this near-surface organic record have utilized thermal extraction (pyrolysis) in combination with mass spectrometry (Biemann et al., 1976; Hoffman et al., 2008; Mahaffy et al., 2012). The Sample Analysis at Mars (SAM) instrument suite on board the Curiosity rover of the Mars Science Laboratory (MSL) mission at Gale crater has detected chlorinated hydrocarbons (Freissinet et al., 2015; Sz-opa et al., 2020) and other chemically diverse molecular components in the pyrolysis products of multiple samples, including products released at high temperatures (>500 °C) indicative of geologically refractory organic matter (Eigenbrode et al., 2018). Although the sources of these organic pyrolysis products have yet to be determined, these observations suggest preservation of organic matter over billions of years in Martian sediments (Eigenbrode et al., 2018).
Laboratory and field studies on Earth show that many organic compounds will decompose into metastable organic salts, such as oxalates and acetates, when exposed to radiation, oxidants, or volcanism (Applin et al., 2015; Benner et al., 2000; Echigo & Kimata, 2010; A. C. Fox et al., 2019; Hofmann & Bernasconi, 1998). Given that these processes may have significantly influenced the Martian organic record over billions of years, and that organic salts are known to persist in many terrestrial environments, it is of great impor-tance that we better understand how organic salts behave under the analytical conditions of our flight experiments (Applin et al., 2015; Cheng et al., 2016; Dartnell, 2011; Dartnell et al., 2007, 2012; Hartmann et al., 1999; Hassler et al., 2014; Johnston & Vestal, 1993; Mahaffy et al., 2012; A. A. Pavlov et al., 2012; A. K. Pavlov et al., 2002). Analyses of Martian meteorites have revealed a suite of organic compounds with Martian D/H isotopic values in the shergottites NWA 1950 and Tissint, as well as the 1.3 Ga Nakhla mete-orites, that include carbonyl and carboxyl group functionality and the Ca oxalate mineral whewellite was discovered in the Murchison meteorite (Fuchs et al., 1973; Steele et al., 2018). If organic salts are confirmed to be widespread on the Martian surface, their composition and distribution may offer insight into the less altered organic record at depth, as well as informing about near-surface carbon cycling and habitability. In this work, we examine how oxalates and acetates, existing as salts with Fe, Ca, and Mg cations, decompose during SAM-like pyrolysis, in order to assess if they are plausible phases in Gale crater sediments.
Investigating organic salts via thermal extraction is challenging as they produce simple pyrolysis products that can also be contributed by many other sources, such as the thermal decomposition of carbonates, the oxidation of more complex organic matter, or instrument backgrounds and contamination (Bamford & Tip-per, 1980; Eigenbrode et al., 2018; Galwey & Brown, 1999; Sutter et al., 2017). Furthermore, additional CO2, CO, O2, H2O, and catalysts in a pyrolysis oven can influence organic salt decomposition and many of the pyrolysis products can undergo side reactions (Bamford & Tipper, 1980; Bell et al., 1994; Judd et al., 1974; McAdie & Jervis, 1970).
Pyrolysis of metal oxalates is initiated by rupture of the C-C bond and typically results in formation of either the metal carbonate and CO (Reaction 1), the metal oxide, CO and CO2 (Reaction 2), or the metal and CO2 (Reaction 3) (Bamford & Tipper, 1980).
2 4 3 MC O s MCO s CO g (R1)
2 4 2 MC O s MO s CO g CO g (R2)
2 4 2 MC O s M s 2CO g (R3) An exception is Fe(III) oxalate, which according to Hermankova et al. (2010) yields a certain amount of Fe(II) oxalate during heating due to electron transfer to the Fe3+ cations (Reaction 4).
2 2 4 3 2 4 2 Fe C O s 2FeC O s 2CO g (R4) Investigation: J. M. T. Lewis, G. M. Wong, A. C. McAdam, P. D. Archer, B. Sutter, M. Millan, R. H. Williams, M. Guzman, A. Das, E. B. Rampe, C. N. Achilles, H. B. Franz, S. Andrejkovičová, C. A. KnudsonMethodology: J. M. T. Lewis, G. M.
Wong, A. C. McAdam, H. B. Franz, S. Andrejkovičová Project Administration: J. L. Eigenbrode Resources: J. L. Eigenbrode Software: G. M. Wong Supervision: J. L. Eigenbrode, A. C. McAdam Validation: G. M. Wong Writing – original draft: J. M. T.
Lewis, G. M. Wong, P. D. Archer, M. Millan, E. B. Rampe, C. N. Achilles
Writing – review & editing: J. M. T.
Lewis, J. L. Eigenbrode, G. M. Wong, A. C. McAdam, P. D. Archer, B. Sutter, M. Millan, E. B. Rampe, C. N. Achilles, C. A. Knudson
Any remaining Fe(III) oxalate decomposes to Fe, Fe oxides, CO, and CO2 between 220 °C and 320 °C. Be-tween 300 °C and 390 °C Fe(II) oxalate decomposes to give Fe oxides, CO, and CO2. Broadbent et al. (1967) performed X-ray analysis of the solid residue of Fe(III) oxalate decomposition after heating to 900 °C and found Fe, Fe3O4, and a trace of FeO. Hermankova et al. (2010) reported that Fe(III) oxalate decomposition does not take place in separate distinguishable steps under O2, instead the formation of the Fe(II) oxalate intermediate and its decomposition to hematite occur almost simultaneously. They concluded that Fe3+ to Fe2+ reduction in Fe(III) oxalate decomposition is a general phenomenon caused by electron transfer that is atmosphere independent and that the amount of Fe(II) oxalate observed is instead dependent on its subse-quent decomposition to hematite, which is controlled by the access of O2 to the sample volume.
Kinetic studies of Mg oxalate decomposition indicate several overlapping reactions in the temperature range 420 °C–620 °C, which are the decomposition of the oxalate to MgCO3 and CO, decomposition of MgCO3 to MgO and CO2, and oxidation of the CO to CO2 if O2 is present (Gadalla, 1984). In comparison, the decomposition of Ca oxalate to CaCO3 and the dissociation of CaCO3 to CaO are well separated steps (Bam-ford & Tipper, 1980; Gadalla, 1984; Lawson-Wood & Robertson, 2016). Some CO2 may be observed during the decomposition of Ca oxalate to CaCO3 due to the disproportionation of CO to CO2 and C (Reaction 5).
2
2CO g CO g C s
(R5) Dollimore and Griffiths (1970) studied the decomposition of a range of oxalates under N2 and then flowed O2 over the pyrolysis products. A reaction between O2 and CO was catalyzed at the solid product surfaces and for those oxalates whose solid pyrolysis products were capable of undergoing further oxidation, oxida-tion of the metal or lower oxide residues occurred (e.g., Fe oxalate residues consisted of Fe2O3 rather than Fe3O4). They established two groups of oxalates; those that underwent oxidation of their solid pyrolysis products upon the addition of O2 (e.g., Fe(III), Fe(II) oxalates) and those that did not undergo oxidation of their solid pyrolysis products (e.g., Ca, Mg oxalates).
Metal acetates typically decompose to yield the metal carbonate and acetone (Reaction 6), the metal oxide, acetone, and CO2 (Reaction 7), or the metal, C, acetic acid, CO2, and H (Reaction 8) (Afzal et al., 1991; Bam-ford & Tipper, 1980; Galwey & Brown, 1999). The acetate ion can also undergo hydrolysis to form acetic acid (Reaction 9) (Wanjun & Donghua, 2007). In contrast to oxalates, major CO evolutions are not reported in acetate pyrolysis studies (Bamford & Tipper, 1980; Galwey & Brown, 1999).
3
2 3
3
2
M CH COO s MCO s CH CO g (R6)
3
2
3
2
2
M CH COO s MO s CH CO g CO g (R7)
3
3
2
2
2M CH COO s 2M s C s CH COOH g CO g H g (R8)
3 2 3 CH COO s‐ H O g CH COOH g OH g‐ (R9) Fe(II) acetate decomposes to an Fe oxide between 260 °C and 328 °C (de Souza et al., 2017). Benner et al. (2000) reported the generation of CO2, acetone, acetic acid, and acetic anhydride from Fe(II) acetate decomposition. Ca acetate decomposes to a carbonate at ∼440 °C, which is accompanied by the evolution of acetone and CO2 (Galwey & Brown, 1999). Mg acetate decomposes between 275 °C and 340 °C to form acetone, CO2, and MgO (Afzal et al., 1991; McAdie & Jervis, 1970). In the presence of O2, the decomposi-tion of acetates usually involves fewer intermediate stages and occurs at slightly different temperatures, for example, Mg acetate experiences highly exothermic decomposition between 335 °C and 351 °C under O2 (McAdie & Jervis, 1970).If organic salts were present in a Martian target sampled by thermal extraction, oxalates would be expected to contribute CO2 and CO, while acetates would likely evolve a mixture of CO2, acetone, and acetic acid. In the case of the CO2 detections by the twin Viking Landers, a lack of indigenous acetone and acetic acid in Viking pyrolysis data was used by Benner et al. (2000) to rule out the presence of acetates in the regolith of the Viking landing sites, but CO2 evolutions from oxalates could not be discounted. Biemann et al. (1977)
attributed the Viking CO2 detections to desorption from mineral surfaces and carbonate decomposition. The CO2 peaks in pyrolysis data from the 2008 Phoenix Lander were also described as consistent with the decomposition of carbonates, with supporting evidence from the lander's Microscopy, Electrochemical, and Conductivity Analyzer (MECA) instrument (Boynton et al., 2009; Sutter et al., 2012). CO2 releases detected during SAM evolved gas analysis (EGA) experiments were attributed to background and Martian sources (Sutter et al., 2017). Potential Martian sources include atmospherically adsorbed CO2, the decomposition of carbonates, oxidation of organic matter, decarboxylation, decarbonylation, magmatic carbon, and releas-es from organic matter trapped within minerals (Archer et al., 2014; Eigenbrode et al., 2014, 2018; Franz et al., 2020; Leshin et al., 2013; McAdam, Sutter, Archer, Franz, Wong, et al., 2020; Ming et al., 2014; Steele et al., 2012, 2016, 2018; Stern et al., 2018; Sutter et al., 2017). Background sources were predominantly at-tributed to oxidation of derivatization reagents leaked from a cup dedicated to a SAM wet chemistry exper-iments (Glavin et al., 2013; Leshin et al., 2013). Quantitative data analysis indicated Martian sources were responsible for a large portion of the detected CO2 in samples (Eigenbrode et al., 2018; Franz et al., 2020; Freissinet et al., 2015, 2020; Leshin et al., 2013; Sutter et al., 2017). SAM CO was mostly coincident with at least one of the SAM CO2 peaks and was always less than the associated CO2 (Sutter et al., 2017). SAM CO peaks have been described as consistent with incomplete combustion of organics, the decarbonylation or decomposition of oxygen-bearing organics, and contributions from the SAM background (Eigenbrode et al., 2014; Ming et al., 2014; Sutter et al., 2017). SAM O2 and chloromethane releases were suggestive of the presence of oxychlorine phases, such as perchlorates and chlorates, but SAM O2 peak temperatures were below the laboratory decomposition temperatures of expected phases such as Ca and Mg perchlo-rates (Glavin et al., 2013; Sutter et al., 2017). Here we assess organic salts as possible sources for CO2 and CO peaks observed in SAM EGA data. We have pyrolyzed a range of oxalate and acetate standards as pure phases, as trace phases in a silica matrix, and in mixtures with Ca and Mg perchlorate salts. Our data and conclusions inform our understanding of an important aspect of the nature of Mars' near-surface organic record and have implications for past, present, and future flight experiments.
2. Materials and Methods
2.1. Laboratory Materials
The organic salts and perchlorates used in this work were sourced commercially. Fe(III) oxalate hexahy-drate, Fe(II) oxalate dihyhexahy-drate, anhydrous Ca oxalate, Mg acetate tetrahyhexahy-drate, Ca acetate hyhexahy-drate, anhy-drous Fe(II) acetate, Ca perchlorate tetrahydrate, and Mg perchlorate hexahydrate were Sigma Aldrich rea-gents. Mg oxalate dihydrate was sourced from MP Biomedicals, LLC.
The pyrolysis system described in Section 2.2 includes a pyrolysis oven with a quartz liner that can be etched by chlorine. To protect the liner, the organic-salt-perchlorate mixtures were dispersed in an inert matrix prior to EGA. This dispersal enabled many different mixtures to be investigated, but somewhat increased the standard error when quantifying CO2 production from the silica-hosted samples. The inert matrix se-lected was the amorphous FS-120 porous ceramic silica manufactured by H.P. Technical Ceramics. FS-120 was chosen due to its high purity and porosity, which are well characterized due to FS-120's use in the MSL organic check material (Conrad et al., 2012). The FS-120 was cleaned by baking in a 550 °C oven overnight and subsamples were pyrolyzed to characterize any residual carbon contamination. The organic salt stand-ards were dispersed in FS-120 at a 100:1 mixing ratio via grinding in a solvent-cleaned agate pestle and mortar for 3 min. In order to quantify the uncertainty introduced by this mixing, each silica mixture was analyzed in triplicate by EGA. The fused silica mixtures are likely more relevant to Martian interpretations compared to the pure organic standards, as Martian organic salts, if present, would likely occur as trace components in matrices with significant concentrations of amorphous phases (Rampe et al., 2020). The Ca and Mg perchlorate standards were added to vials of known mass that were dried down in a 60 °C oven prior to weighing. The standards were then dissolved in deionized water to form 0.04 M stock solutions.
In preparation for EGA, the samples were weighed out in Frontier Lab stainless steel Eco-Cups that had been cleaned by baking in a 550 °C oven for three hours. To examine the decomposition of the pure organic salts, 1 mg of each crystalline standard was prepared. To explore the impact of the silica on the thermal decomposition of the organic salts, 3 × 7 mg aliquots of each fused-silica-organic-salt (FSO) mixture were weighed out. To characterize the thermal decomposition of the perchlorates, the perchlorate stock solutions
were added to Eco-Cups containing fused silica at a 100:1 silica-perchlorate mixing ratio. In addition, the Ca perchlorate stock solution was added directly to an Eco-Cup so that the influence of the fused silica on perchlorate decomposition could be deconvolved. The Ca-perchlorate stock solution was added to the FSO mixtures at two different mixing ratios, 100:1 FSO-perchlorate and 1000:1 FSO-perchlorate. While the 100:1 FSO-perchlorate mixtures used 7 mg FSO aliquots, the 1000:1 mixtures used 20 mg. Mg perchlorate was added at a 100:1 FSO-perchlorate ratio only. Immediately after addition of the perchlorate stock solutions the samples were dried down in a 60 °C oven.
2.2. Laboratory Procedures
SAM-like EGA experiments were conducted on an Agilent 5975T LTM GC/MSD (low thermal mass gas chromatograph/mass spectrometer detector) system coupled to a Frontier Laboratories 3030D multi-shot pyrolyzer fitted with an Auto-Shot Sampler AS-1020E. The gas chromatograph was bypassed, and the inlet was directly connected to the MSD via an uncoated EGA column (Frontier Laboratories deactivated Ultra Alloy UADTM-2.5N column, 0.15 mm id, 2.5 m length) in the isothermal oven. In order to match the SAM flight model EGA parameters used on Mars, the inlet, column, and MSD transfer line were maintained at 135 °C and the pyrolysis oven, inlet, and column were He purged at 30 mbar. The split flow ratio to the MSD was 100:1. The pyrolysis oven was held at 50 °C when not running an experiment.
In a standard EGA run, the Auto-Shot Sampler dropped the stainless-steel cup containing the sample into the pyrolysis oven, which heated to 75 °C in 43 s and sat isothermally for 30.7 min in order to release ad-sorbed volatiles. This desorption temperature was slightly elevated relative to SAM initial temperatures (Glavin et al., 2013), due to the greater concentrations of water in Earth's atmosphere. The sample was then heated to 850 °C at a ramp rate of 35 °C/min and held for 6 min. Two blank runs were carried out between each analytical run to monitor the instrument background. The major differences between the SAM-like EGA experiments conducted on our commercial instrument and those carried out by the SAM flight mod-el include the He pressure (30 mbar vs. 25 mbar), flow rate (50 sccm vs. 0.8 sccm), split flow (100:1 vs. ∼800:1), and sample cup material (stainless steel vs. quartz) (Glavin et al., 2013; Mahaffy et al., 2012). As a result of these differences, variations in the relative abundances of some pyrolysis products, particularly those formed by side reactions, between our instrument and the SAM flight model are possible (Glavin et al., 2013). In addition, our commercial mass spectrometer received a greater quantity of the analyte com-pared to SAM due to the different split flows (Glavin et al., 2013).
SAM-like gas chromatography mass spectrometry (GC-MS) experiments were conducted on a trace 1310 GC coupled to an ISQ quadrupole mass spectrometer, both from the ThermoFisher company, in order to de-convolve some of the acetate EGA results. The GC was equipped with a Rt-Q-Bond column in fused silica (30 m long × 0.25 mm ID bonded with a 8 µm thick stationary phase) or with a metal MXT-5 column (30 m long × 0.25 mm ID bonded with a 0.25 µm thick stationary phase), both from the Restek company, for the analysis of pure Mg acetate and a fused-silica-Mg-acetate-Ca-perchlorate mixture respectively (Figure S1). Samples were analyzed using a Frontier Laboratories 3030D multi-shot pyrolyzer (Quantum Analytics) at a SAM-like pyrolysis ramp rate of 35 °C/min. Mg acetate was analyzed at two temperature ranges: 40 °C– 300 °C and 300 °C–500 °C. The fused-silica-Mg-acetate-Ca-perchlorate mixture was analyzed at three tem-peratures ranges: 40 °C–300 °C, 300 °C–450 °C, and 450 °C–850 °C. The interface temperature between the pyrolyzer and the chromatograph varied from 140 °C to 300 °C depending on the pyrolysis temperature. During each pyrolysis step, the gaseous molecules released by the samples were trapped at the column inlet using a liquid nitrogen cold trap. Upon completion of a pyrolysis step, the cold trap was stopped, and the chromatographic analysis was started. The temperature programs used for the Rt-Q Bond column were a 35 °C hold for 5 min followed by a 10 °C/min ramp up to a final temperature of 250 °C (held for 1 min) for the temperature range 40 °C–300 °C and 270 °C (held for 1 min) for the temperature range 300 °C–500 °C. The temperature program used for the MXT-5 column was a 35 °C hold for 5 min and then a ramp up to 300 °C at a 10 °C/min rate and a hold for 1 min to bake out the column. Helium was used as the carrier gas and set at 1.2 mL/min flow rate with a split flow of 10 mL/min. The ion source and transfer line of the MS were both set at 300 °C and ions produced by electron impacts of 70 eV were scanned between mass-to-charge ratios (m/z) of 5 and 535 using a scan time of 0.2 s.
2.3. Laboratory Data Analysis
Each EGA plot was deadtime and background corrected. Deadtime correction accounts for lost counts dur-ing high count rates (Franz et al., 2014). The instrument background was calculated from the m/z values detected while the oven and sample sat isothermally at 75 °C. The plots were smoothed using Igor Pro's box smoothing function with an 11-point moving average. After this processing, negative values were set to zero. The mass fragments generated by mass spectrometry of CO2 include m/z 28 (CO). Therefore, when ana-lyzing EGA data from samples that evolve both CO2 and CO, the CO signal must be corrected for the CO fragment from CO2. The peak area of the CO fragment was subtracted from the uncorrected m/z 28 peak area (m/z 28uc) using Equation 1 (Sutter et al., 2017), with the correction calculated from laboratory EGA of a calcite standard where no CO producers were present.
m z/ 28c m/z28uc(m/z44(m/z28/m/z44)calcite)
(E1) The species reported during SAM-like pyrolysis-GC-MS of the Mg acetate standard included CO2, methane, ethane, ethene, propane, propene, acetaldehyde, methyl-propane, methyl-propene, acetone, acetic acid, bu-tanone, butenone, and pentanone (Table S1). These species were inferred to be predominantly acetate pyrol-ysis products rather than impurities as the Mg acetate standard had >99% purity and side reactions during acetate pyrolysis are reported in the literature (McAdie & Jervis, 1970). Benner et al. (2000) reported the detection of acetic anhydride during pyrolysis of Fe(II) acetate in addition to acetone and acetic acid. Many of the species listed in Table S1 produce m/z 44 fragments (e.g., CO2, C2H4O, C3H8) and m/z 28 fragments (e.g., CO, C2H4) during mass spectrometry, which has significant implications for interpretations about CO2 and CO in our acetate EGA data. CO2 was assumed to be the only contributor to m/z 22 (as CO22+), so the
m/z 22 profile was used to assess what proportion of the m/z 44 profile was sourced from CO2 (Equation 2).
m z/ 44 m z/ 22 (( /m z44/ /m z m z/ 22) )
2
CO sample calcite
(E2) Acetate m/z 28 peaks were corrected for the CO fragment from CO2 but not for contributions from the organic products of acetate pyrolysis. The EGA profiles of acetone and acetic acid were used to infer how significant the contribution of organic fragments to m/z 28c were.
Areas under the curve were calculated for m/z 44 in Igor Pro and converted to masses using a CO2 calibra-tion curve constructed using the CO2 evolucalibra-tions from known masses of calcite. The m/z 18 (H2O) peaks produced by the pure organic salts during EGA were used to determine if the hydration state of the salts dif-fered from the description on the sample bottle. The mass of the water of hydration was subtracted from the weighed masses in order to determine the CO2 release from the anhydrous salts. Each organic-salt-fused-sil-ica mixture was run in triplorganic-salt-fused-sil-icate to quantify the standard error introduced by sample mixing. This error was combined with the standard error of the calibration curve and the mass balance error. The total peak area for the corrected m/z 28 peaks detected during EGA of each oxalate sample were measured and ratioed to the total peak area for m/z 44 peaks in order to examine how CO/CO2 ratios changed upon mixing oxalates in fused silica and mixing the silica-oxalate mixtures with perchlorates. This was not calculated for acetates due to the large number of acetate pyrolysis products that can contribute to m/z 28.
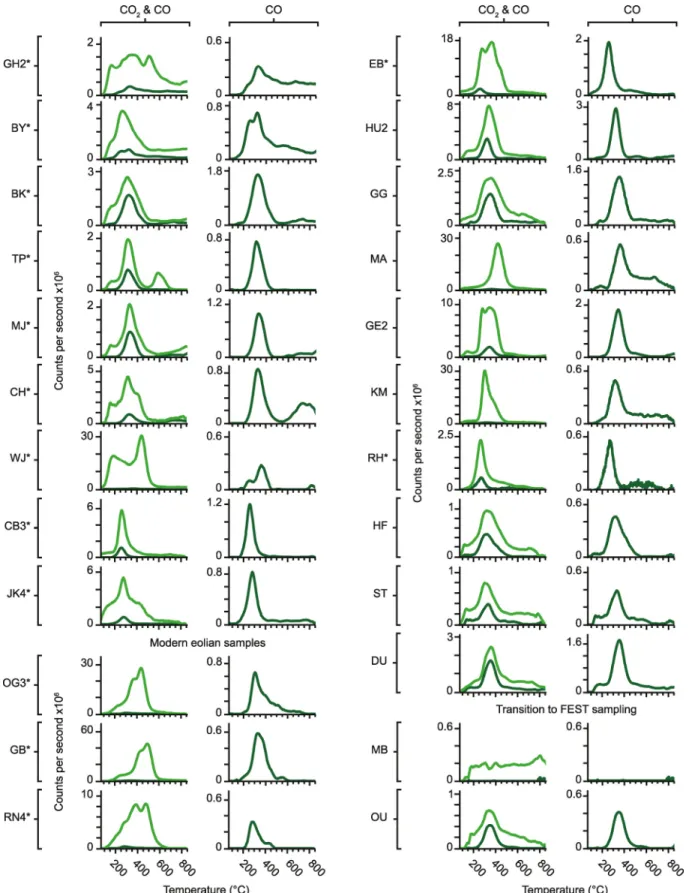
2.4. Geologic Context of SAM Samples
The Martian materials examined by SAM include modern eolian deposits sampled at three separate locali-ties (Leshin et al., 2013; Stern et al., 2018; Sutter et al., 2017). Rocknest (RN) was acquired from an inactive sand shadow composed of unconsolidated sand and dust that represented a mixture of local, regional, and global sources (Blake et al., 2013; Minitti et al., 2013; Stern et al., 2018; Sutter et al., 2017). Gobabeb (GB) and Ogunquit Beach (OG) were obtained from an active eolian dune field on the flanks of Aeolian Mons (informally known as Mount Sharp) that lacked silt and dust-sized grains and likely represented a regional source (Stern et al., 2018).
The first drilled samples analyzed by SAM were from the Sheepbed mudstone within the Yellowknife Bay formation (Figure S2; Table S2), which represented an ancient circumneutral lake environment ideal for the preservation of organic matter (Eigenbrode et al., 2018; Grotzinger et al., 2014; Sutter et al., 2017).
The John Klein (JK) drill hole was intersected by light-toned millimeter-sized veins that likely indicated post-depositional diagenesis by groundwater, while Cumberland (CB) exhibited far fewer veins (Eigenbrode et al., 2018; Sutter et al., 2017; Vaniman et al., 2014). MSL's next drill target was Windjana (WJ), a cross-strat-ified eolian sandstone from the Kimberley formation that consisted of reworked fluvial grains from multiple parent rock sources (Sutter et al., 2017; Treiman et al., 2016).
The Confidence Hills (CH), Mojave (MJ), and Telegraph Peak (TP) targets were the first located within the Murray formation (the basal layer of the Mount Sharp Group) and were found to be complex mix-tures where phases stable under acidic, alkaline, oxidizing, and reducing conditions were present (Rampe et al., 2017; Sutter et al., 2017). Diagenetic features were observed close to the CH and MJ drill sites and the TP target had elevated Si (Nachon et al., 2017; Sutter et al., 2017). Buckskin (BK) was drilled from a finely laminated mudstone 6 m stratigraphically above TP and was also found to have high Si (Morris et al., 2016; Sutter et al., 2017).
Big Sky (BY) and Greenhorn (GH) were drilled from the Stimson formation, a cross-bedded eolian sand-stone that uncomformably overlies the Murray (Fraeman et al., 2016; Sutter et al., 2017). BY was sampled from parent rock, while GH was from an alteration halo that appeared to have been leached by fluids (Ram-pe et al., 2020; Sutter et al., 2017; Yen et al., 2017). Upon returning to the Murray, MSL drilled Oudam (OU) from a cross-stratified eolian and fluvial siltstone in the Hartmann's Valley member, and Marimba (MB) from a finely laminated lacustrine mudstone in the Karasburg member (Bristow et al., 2018).
After recovering from a drill fault, MSL examined Vera Rubin Ridge (VRR), an erosion-resistant feature with widespread evidence for diagenesis (Fraeman et al., 2013, 2020; McAdam, Sutter, Archer, Franz, Wong, et al., 2020). The VRR was divided into the Pettegrove Point member, which was composed of finely lami-nated mudstones, and the Jura member, which consisted of finely lamilami-nated mudstones to fine sandstones, with red and gray color variations (Fraeman et al., 2020; McAdam, Sutter, Archer, Franz, Wong, et al., 2020). Duluth (DU) was drilled directly beneath the VRR, Stoer (ST) from the Pettegrove Point member, Highfield (HF) from the gray Jura, and Rock Hall (RH) from the red Jura (McAdam, Sutter, Archer, Franz, Wong, et al., 2020).
In 2019, MSL began exploring the Glen Torridon (GT) region, which featured strata strongly associated with smectite clay mineral spectra that were subdivided into smooth, fractured, and fractured intermediate clay-bearing units (V. K. Fox et al., 2020; Grotzinger et al., 2012; Thorpe et al., 2020). Kilmarie (KM) was drilled from the smooth clay-bearing unit in the Jura and Glen Etive (GE) from the fractured clay-bearing unit in the Knockfarril Hill member, a cross-laminated sandstone (Sutter, McAdam, Achilles, et al., 2020; Thorpe et al., 2020). Hutton (HU) was sampled close to an unconformity between the fractured intermediate unit and the overlying Greenheugh Pediment (Bryk et al., 2020; McAdam, Sutter, Archer, Franz, Eigenbro-de, et al., 2020). MSL climbed the pediment and acquired the Edinburgh (EB) sample from the cross-bedded sandstone capping unit, which was interpreted to be part of the Stimson formation (Bryk et al., 2020; Sutter, McAdam, Archer, et al., 2020). MSL descended off the pediment and drilled Glasgow (GG) from the frac-tured intermediate unit and Mary Anning (MA) from the Knockfarril Hill member.
2.5. SAM Data Analysis
The quantities of CO2 evolved by organic salts in our experiments were compared to the abundances of CO2 evolved by SAM samples in order to set upper limits on organic salt concentrations within Gale crater. SAM CO2 and O2 abundances and uncertainties were calculated based on a SAM analysis of an equimolar mixture of gas containing O2, CO2, N2, and Ar and SAM EGA of known masses of calcite prior to launch (Archer et al., 2014). SAM CO2 was corrected for the maximum potential contribution from leaking SAM derivatization agents of 900 nmol C for each SAM-EGA experiment (Sutter et al., 2017).
The SAM detector is tuned to detect trace species, so abundant gases such as CO2 can saturate the detector (Archer et al., 2014). When plotting SAM CO2 data, missing portions of the m/z 44 peak were replaced with the corrected isotopologue m/z 45 (13CO2) (Sutter et al., 2017). The m/z 45 fragment was used to infer SAM CO2 rather than m/z 22 as the m/z 45 fragment from CO2 is more intense than the m/z 22 fragment in SAM mass spectrometry. SAM m/z 28 peaks were corrected for contributions from the CO fragment from CO2, ethane, and formaldehyde using Equation 3 (McAdam, Sutter, Archer, Franz, Wong, et al., 2020).
SAM CO m z/ 28 – / 45 3.20 – / 27 3 – / 29 0.24m z m z m z
(E3) SAM CO2 and CO were plotted against modeled sample temperature. SAM has two pyrolysis ovens, oven-1, which has an external temperature sensor, and oven-2, which has a secondary heater wire in place of a temperature sensor (Franz et al., 2020). As the mission has progressed the temperature model for samples analyzed in oven-2 has been refined and in this work the oven-2_model-2 estimation described in Franz et al. (2020) is used for oven-2 samples.
MSL's drill fault prior to exploration of the VRR required transitioning to a new drilling method known as feed-extended sample transfer (FEST) (Fraeman et al., 2020). FEST ensured that drilled samples could still be acquired but MSL's Collection and Handling for Interior Martian Rock Analysis (CHIMRA) system could no longer be used, which resulted in a larger uncertainty in delivered sample mass (McAdam, Sutter, Archer, Franz, Wong, et al., 2020).
3. Results
3.1. Pyrolysis of Fused Silica and Perchlorates
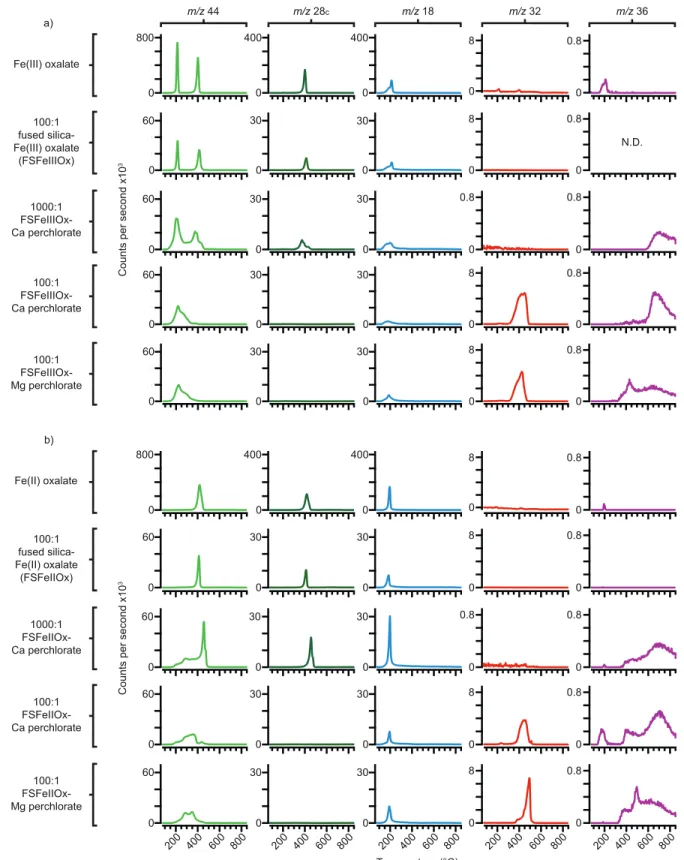
The FS-120 fused silica evolved a broad H2O peak at 205 °C and a very weak CO2 peak at 280 °C during SAM-like EGA, with H2O and CO2 remaining slightly elevated for the rest of the run (Figure 1). No O2 or HCl peaks were produced by the fused silica. Ca perchlorate evolved sharp O2, HCl, Cl2, and CO2 peaks at 520 °C as the Ca perchlorate decomposed to form CaCl2. The HCl and Cl2 releases were unexpected as per-chlorates that decompose into chlorides are reported in the literature as evolving O2 only (Marvin & Wool-aver, 1945). It is theorized that as the perchlorate began to decompose, some hydrolysis may have occurred or that the evolved O2 may have reacted with residual perchlorate to form CaO and perchloric acid, with residual H2O in the system acting as the source of hydrogen. The H2O profile featured peaks at 240 °C and 360 °C and a sharp drop at 520 °C as the perchlorate decomposed. A broad high-temperature HCl release Figure 1. Evolved m/z 44 (CO2), m/z 28c (corrected CO), m/z 18 (H2O), m/z 32 (O2), and m/z 36 (HCl) versus temperature as detected by SAM-like EGA of the FS-120 fused silica, Ca perchlorate, a 100:1 fused-silica-Ca-perchlorate mixture, and a 100:1 fused-silica-Mg-perchlorate mixture. EGA, evolved gas analysis; SAM, Sample Analysis at Mars.
(starting at ∼600 °C) occurred due to the CaCl2 residue melting and reacting with H2O (Clark et al., 2020; Sutter et al., 2017). An additional small CO2 peak was detected at ∼420 °C. The CO2 peaks shown in Figure 1
likely originated from carbon contamination in the fused silica and the perchlorate standards. The amounts of CO2 produced by the silica and perchlorates were significantly less than those detected during pyrolysis of the organic salts (Table S3).
The 100:1 fused-silica-Ca-perchlorate mixture evolved broad O2 and HCl peaks at 505 °C. The H2O profile below 500 °C was similar to that of the fused-silica experiment and somewhat similar to the Ca-perchlorate run. The elevated H2O seen at high temperatures in the fused-silica run was absent in this experiment. A broad CO2 peak was observed at 370 °C and a small sharp CO2 peak was detected at 505 °C. The 100:1 fused-silica-Mg-perchlorate mixture also evolved O2 and HCl peaks at 505 °C, but HCl began to evolve at significantly lower temperatures (starting at ∼265 °C) and the 505 °C HCl and O2 peaks were weaker. Mg perchlorate predominantly decomposes to form an oxide residue and Cl2 gas (Marvin & Woolaver, 1945; Sutter et al., 2017). However, Cl2 was not detected during either silica-perchlorate run, indicating it was fully converted to HCl as the Cl2 diffused out of the fused silica matrix, with hydrogen supplied by hydroxyl groups adsorbed to the silica and residual H2O. The high-temperature HCl seen in the Mg perchlorate exper-iment suggested that some MgCl2 formed as Mg perchlorate decomposed, which has been observed in the literature by Steininger et al. (2012). Mg perchlorate evolved a sharp H2O peak at 200 °C. Small CO2 peaks were detected at 350 °C and 505 °C.
3.2. Pyrolysis of Oxalates and Oxalate-Perchlorate Mixtures
The oxalate standards evolved CO2 over a wide temperature range during SAM-like EGA. The lowest tem-perature release was from Fe(III) oxalate, which began to produce CO2 from 160 °C. The highest temper-ature release was from Ca oxalate, which evolved CO2 as two discrete peaks, with decomposition of the CaCO3 intermediate continuing up to 770 °C. The majority of CO2 peaks produced by oxalate pyrolysis were accompanied by strong releases of CO, as expected for decomposition reactions involving the formation of carbonates or oxides, as shown in Reactions 1 and 2 in Section 1. Fe oxalate CO2 and CO evolutions were sig-nificantly affected by the presence of perchlorates, while Ca and Mg oxalates were resistant to peak shifting.
3.2.1. Pyrolysis of Fe(III) Oxalate
Pure Fe(III) oxalate evolved CO2 peaks at 210 °C and 400 °C during SAM-like EGA (Figure 2), which was consistent with the formation and decomposition of an Fe(II) oxalate intermediate, as shown in Reactions 2 and 4 in Section 1. The 400 °C CO2 peak was accompanied by a sharp CO release while the 210 °C peak had no associated CO, indicating that the transformation of Fe(III) oxalate to Fe(II) oxalate was highly efficient. The EGA profile of the 100:1 fused-silica-Fe(III)-oxalate mixture (FSFeIIIOx) was largely unchanged from that of the pure oxalate. The 1000:1 FSFeIIIOx-Ca-perchlorate mixture exhibited broadening of its low-tem-perature CO2 peak. In addition, the second CO2 release weakened and shifted to 375 °C and was part of a large shoulder that extended up to 450 °C, with both the 375 °C peak and the shoulder tracked by CO. The 100:1 FSFeIIIOx-perchlorate mixtures produced broad CO2 peaks at ∼220 °C, which exhibited shoulders that extended up to ∼370 °C. No 400 °C CO2 peaks were produced by the 100:1 FSFeIIIOx-perchlorate runs, and no CO peaks were detected. The CO was likely completely oxidized to CO2.
H2O peaks were detected between ∼150 °C and 200 °C in each experiment as the silica, Fe(III) oxalate, and perchlorate salts dehydrated. No O2 was detected in the 1000:1 FSFeIIIOx-Ca-perchlorate run, which suggests the O2 was completely consumed by oxidation reactions. O2 was detected in the 100:1 FSFeIII-Ox-perchlorate runs but only as weak releases peaking between 420 °C and 450 °C. The onset of the major O2 evolution from Ca perchlorate began at a slightly lower temperature than in the Ca-perchlorate-only experiment (Figure 1).
The HCl peak produced by the fused-silica-Ca-perchlorate run at 505 °C was not detected in the presence of Fe(III) oxalate. Because Fe(III) oxalate consumes O2 as it decomposes, the non-detection of mid-temper-ature HCl supports the hypothesis that O2 played a role in in the formation of the 505 °C HCl peak in the fused-silica-Ca-perchlorate run. Each perchlorate mixture produced a high temperature HCl peak as the melting chloride residues reacted with H2O (Clark et al., 2020; Sutter et al., 2017). A small HCl peak was
Figure 2. Evolved m/z 44 (CO2), m/z 28c (corrected CO), m/z 18 (H2O), m/z 32 (O2), and m/z 36 (HCl) versus temperature as detected by SAM-like EGA of (a) Fe(III) oxalate and (b) Fe(II) oxalate as pure phases, as FSFeOx, as 1000:1 FSFeOx and Ca perchlorate mixtures, as 100:1 FSFeOx and Ca perchlorate mixtures, and as 100:1 FSFeOx and Mg perchlorate mixtures. N.D. stands for no detection, which indicates that no signal was detected for m/z 36 during EGA of the FSFeIIIOx mixture. It should be noted that 1 mg aliquots were used for the pure oxalate experiments, 7 mg aliquots for the 100:1 silica and silica-perchlorate mixtures, and 20 mg aliquots for the 1000:1 mixtures. EGA, evolved gas analysis; FSFeOx, 100:1 mixtures of fused silica and Fe oxalate.
detected at 200 °C in the pure Fe(III) oxalate run, which likely originated from H2O reacting with minor amounts of Cl contamination present in the quartz liner of the pyrolysis oven. This background Cl is usually removed by the blank runs, but it can persist for longer if particularly Cl-rich samples have been run or if the liner is nearing the end of its lifetime. The pure organic salt samples were the last set of samples analyz-ed in this project, so the chance of background Cl was somewhat greater.
3.2.2. Pyrolysis of Fe(II) Oxalate
Pure Fe(II) oxalate evolved CO2 and CO peaks at 418 °C during SAM-like EGA (Figure 2). These peaks be-came sharper in the 100:1 fused-silica-Fe(II)-oxalate (FSFeIIOx) run. The CO2 profile of the 1000:1 FSFeII-Ox-Ca-perchlorate sample featured a prominent low-temperature shoulder that evolved from 175 °C. CO was detected, but only with a sharp CO2 peak at 455 °C, which was indicative of standard Fe(II) oxalate de-composition via Reaction 2 in Section 1, while the low-temperature CO2 shoulder indicated that some of the Fe(II) oxalate decomposed via a different reaction, which likely involved O2 sourced from Ca perchlorate. It was unexpected for Fe(II) oxalate and Ca perchlorate to begin decomposing at such low temperatures. The oxidative decomposition of Fe(II) oxalate is known to be accompanied by a local sample temperature increase related to intense oxidation as the oxidation state of Fe increases (Hermankova et al., 2010). If the presence of Fe(II) oxalate lowered the decomposition temperature of Ca perchlorate, the earlier onset of O2 evolution and the resulting local temperature increase may have enhanced decomposition of both the oxalate and the perchlorate.
The 100:1 FSFeIIOx-perchlorate runs produced broad CO2 peaks between 200 °C and 400 °C, with the most prominent evolutions occurring at 280 °C and 350 °C. The 350 °C peak coincided with the onset of the ma-jor O2 and HCl releases. Between 400 °C and 450 °C a minor CO2 peak was detected in the Ca-perchlorate mixture and a minor CO2 shoulder was evolved by the Mg-perchlorate mixture. These features occurred at similar temperatures to the sharp 455 °C CO2 peak evolved by the 1000:1 mixture, which suggests that at greater perchlorate concentrations, only broad low-temperature CO2 peaks would be evolved.
As with the Fe(III) oxalate experiments, sharp H2O peaks occurred between ∼150 °C and 200 °C as the mixtures dehydrated. Similarly, the O2 from Ca perchlorate was entirely consumed by oxidation reactions in the 1000:1 FSFeIIOx-Ca-perchlorate experiment. The 100:1 FSFeIIOx-Ca-perchlorate run evolved a minor O2 peak at ∼450 °C, while the Mg perchlorate mixture produced a weak O2 peak at ∼500 °C, which was consistent with the peak temperature of the Mg-perchlorate-only run. The perchlorate-bearing samples pro-duced mid-temperature HCl evolutions that were more prominent than those evolved by the Fe(III) oxalate mixtures. Low-temperature HCl peaks were evolved by the pure Fe(II) oxalate standard and the perchlorate mixtures. The HCl peak in the pure oxalate run was likely due to Cl in the oven liner reacting with H2O. It is possible that this Cl source also contributed in the perchlorate runs, but the FSFeIIOx-perchlorate mixtures were the only perchlorate mixtures that demonstrated this behavior. It is also possible that the abundant O2 and Fe2+ in these runs led to highly exothermic conditions that enabled some hydrolysis of the perchlorate to occur.
3.2.3. Pyrolysis of Ca Oxalate
Pure Ca oxalate evolved CO and CO2 peaks at 535 °C (with CO producing the more prominent peak) as the oxalate decomposed to form CaCO3 (Figure 3). The co-evolution of CO and CO2 suggests that some disproportionation of the CO occurred to form CO2 and C (Reaction 5 in Section 1). It is also possible that some of the CO was oxidized by background O2 in the instrument. The CaCO3 residue began to evolve CO2 from 590 °C and formed a peak at 730 °C. The 100:1 fused-silica-Ca-oxalate mixture (FSCaOx), produced a slightly weaker CO release and the CO2 peak evolved by decomposition of the CaCO3 intermediate weak-ened and shifted ∼80 °C lower.
The CO2 and CO peaks evolved by Ca oxalate decomposition did not shift significantly when minor concen-trations of Ca perchlorate were added to the silica mixture (1000:1 FSCaOx-Ca-perchlorate). However, the 535 °C CO2 peak did strengthen in comparison to the CaCO3 CO2 peak, which shifted to 690 °C. In the pres-ence of elevated perchlorate concentrations (100:1 FSCaOx-perchlorate), the CO2 release from Ca oxalate decomposition strengthened and the CO release weakened, but there was still no significant peak shifting. The CO2 release from the CaCO3 intermediate weakened and shifted 30 °C–70 °C lower. The CaCO3 likely reacted with HCl and began to decompose at lower temperatures (Cannon et al., 2012).
Figure 3. Evolved m/z 44 (CO2), m/z 28c (corrected CO), m/z 18 (H2O), m/z 32 (O2), and m/z 36 (HCl) versus temperature as detected by SAM-like EGA of (a) Ca oxalate and (b) Mg oxalate as pure phases, as FSOx, as 1000:1 FSOx and Ca perchlorate mixtures, as 100:1 FSOx and Ca perchlorate mixtures, and as 100:1 FSOx and Mg perchlorate mixtures. It should be noted that 1 mg aliquots were used for the pure oxalate experiments, 7 mg aliquots for the 100:1 silica and silica-perchlorate mixtures, and 20 mg aliquots for the 1000:1 mixtures. EGA, evolved gas analysis; FSOx, 100:1 mixtures of fused silica and oxalate; SAM, Sample Analysis at Mars.
Ca oxalate was purchased as the anhydrous form but several of the runs evolved low-temperature H2O peaks between 100 °C and 200 °C. The peaks seen in the pure Ca oxalate run and the 1000:1 FSCaOx-Ca perchlorate run suggest that the Ca oxalate was hydrated. This hydration would be unlikely to significantly impact the decomposition of the oxalate, as dehydration and decomposition are well-separated steps. The O2 release temperatures from Ca and Mg perchlorate were largely unaffected by the presence of Ca oxalate. Unlike Fe oxalates, Ca oxalate does not undergo oxidation of its solid pyrolysis products (Dollimore & Griffiths, 1970). However, the weaker O2 peaks produced by the FSCaOx-perchlorate mixtures relative to the perchlorate-only runs suggest that some O2 was consumed by oxidation reactions with CO. The weak O2 peak from the 1000:1 FSCaOx-Ca-perchlorate run also showed no peak shifting. Prominent high-tempera-ture HCl evolutions were produced by the 100:1 FSCaOx-perchlorate mixhigh-tempera-tures and Ca perchlorate contin-ued to evolve a significant 505 °C HCl peak in the presence of Ca oxalate. No HCl peaks were observed in the 1000:1 FSCaOx-Ca-perchlorate experiment, it was likely consumed by the abundant CaCO3.
3.2.4. Pyrolysis of Mg Oxalate
Pure Mg Oxalate evolved CO2 and CO peaks at 518 °C during SAM-like EGA (Figure 3). No secondary CO2 peak was observed, consistent with the decomposition of a MgCO3 intermediate, as described by Gadal-la (1984). The 518 °C CO2 peak sharpened but did not shift in the 100:1 fused-silica-Mg-oxalate mixture (FSMgOx) and the perchlorate mixtures but the 100:1 FSMgOx-Ca-perchlorate mixture developed two CO2 shoulders at lower temperatures, which occurred with the onset of O2 evolution from Ca perchlorate. The Mg oxalate CO peak weakened with increasing perchlorate concentrations.
Prominent H2O releases were detected in each run at ∼200 °C. As with the Ca oxalate experiments, the perchlorate O2 peaks weakened in the presence of Mg oxalate but did not shift. A low-temperature HCl peak was detected in the pure Mg oxalate run, which was similar to those seen in the Fe oxalate experiments and inferred to be instrumental. A small HCl peak was detected at high temperatures in the 1000:1 FSMgOx-Ca perchlorate run and prominent mid- and high-temperature HCl peaks were observed in the 100:1 FSM-gOx-perchlorate experiments.
3.2.5. Quantification of Oxalate CO2 Production During Pyrolysis
In order to accurately calculate the CO2 production from each oxalate, the different hydration states of the standards had to be accounted for. The H2O peaks observed in Figures 2 and 3 were consistent with Fe(III) oxalate hexahydrate, Fe(II) oxalate dihydrate, and Mg oxalate dihydrate. Ca oxalate was inferred to have been in the monohydrate form rather than the anhydrous form. The mass of the water of hydration was subtracted from each standard in order to calculate the CO2 production per mg of each anhydrous oxalate. Pure Fe(III) oxalate produced more CO2 during EGA compared to the other oxalates studied (Table 1; Ta-ble S4). Unlike Fe(II), Ca, and Mg oxalates, Fe(III) oxalate transforms into Fe(II) oxalate during pyrolysis, which involves a prominent release of CO2 (Reaction 4 in Section 1). Pure Ca, Mg, and Fe(II) oxalates produced similar CO/CO2 peak area ratios, while for Fe(III) oxalate the ratio was markedly lower. When dispersed in fused silica, Fe(III) oxalate evolved slightly less CO2 and there was an increase in the CO/CO2 peak area ratio, which suggests that the silica matrix inhibited oxidation of CO by background O2. Fe(II) ox-alate and Mg oxox-alate also showed moderate increases in their CO/CO2 ratios. In contrast, Ca oxox-alate evolved significantly more CO2 in fused silica and the CO/CO2 ratio decreased. It is possible that in a matrix the standard decomposition of Ca oxalate to a carbonate (Reaction 1 in Section 1) was inhibited and Ca oxalate decomposition to the oxide or metal may have occurred (Reactions 2 and 3 in Section 1). This hypothesis would explain why the CO2 peak from CaCO3 decomposition was observed to weaken and shift to lower temperatures and why less CO was detected. SAM-like EGA of other carbonate-generating oxalates, such as K oxalate, exhibited similar behavior. K2CO3 is stable in the SAM temperature range, yet when dispersed in fused silica the amounts of CO2 detected as K oxalate decomposed increased significantly and there was a dramatic reduction in the CO/CO2 ratio (Table S5). This effect was likely less apparent in the Mg oxalate experiment due to the instantaneous decomposition of the MgCO3 intermediate.
The CO/CO2 peak area ratio decreased for each oxalate when minor concentrations of Ca perchlorate were added to the fused-silica-oxalate mixtures. Fe oxalate and Mg oxalate showed only minor changes in the quantities of CO2 evolved that were within error of the fused-silica-oxalate mixtures, while the quantity
of CO2 produced by Ca oxalate was more in line with the pure oxalate. Each fused-silica-oxalate mixture evolved greater amounts of CO2 at elevated perchlorate concentrations. While CO was scrubbed in the Fe oxalate mixtures, CO peaks were still observed in the Mg and Ca oxalate runs. The somewhat greater CO2 production from Ca and Mg oxalates relative to Fe oxalates at elevated perchlorate concentrations was therefore not solely due to CO oxidation. Prominent HCl peaks were detected in each perchlorate run, which would have reacted with the carbonates to form CO2 and chloride residues. Variations in perchlorate type did not have a substantial impact on the amounts of CO2 generated by oxalates, which suggests that oxalate decomposition is not particularly sensitive to minor changes in O2 concentrations during pyrolysis.
3.3. Pyrolysis of Acetates and Acetate-Perchlorate Mixtures
The majority of the acetate CO2 releases observed during SAM-like EGA were accompanied by peaks for ac-etone (m/z 58), acetic acid (m/z 60), and minor m/z 28c evolutions that were a mixture of CO and fragments from organic pyrolysis products (Table S1). The acetate m/z 44 profiles were compared to our calculated m/z 44CO2 traces, which indicated that the m/z 44 contributions from organic acetate pyrolysis products were minor (Figure S3). Fe(II) acetate produced the lowest-temperature CO2 release, with the onset beginning at 190 °C. Ca acetate formed CaCO3 during pyrolysis, which evolved CO2 up to 770 °C. In contrast to the oxalates, the m/z 28c evolutions for pure acetates were extremely weak relative to CO2.
Pure Fe(II) acetate produced similar sized peaks for acetone and acetic acid during EGA, while for Ca and Mg acetate, acetone was dominant. These observations suggest that Ca and Mg acetate produced a metal
Sample Cation anhydrous oxalate salt)CO2 (µmol CO2/mg peak area ratioTotal CO/CO2 mg anhydrous oxalate salt) 1σAverage CO2 (µmol CO2/
Pure oxalates Fe(III) 15.24 ± 0.16 0.16 10.72 ± 0.15 3.05
Fe(II) 8.65 ± 0.15 0.30 Ca 9.10 ± 0.12 0.37 Mg 9.90 ± 0.18 0.38 FSOx Fe(III) 12.40 ± 2.08 0.22 11.28 ± 2.27 2.43 Fe(II) 7.92 ± 2.02 0.32 Ca 13.54 ± 1.97 0.28 Mg 11.27 ± 3.00 0.39
1000:1 FSOx-Ca perchlorate Fe(III) 13.42 ± 0.75 0.07 10.88 ± 0.81 1.70
Fe(II) 10.10 ± 0.73 0.15
Ca 9.98 ± 0.70 0.18
Mg 10.02 ± 1.06 0.26
100:1 FSOx-Ca perchlorate Fe(III) 16.48 ± 2.06 – 16.28 ± 2.23 2.36
Fe(II) 13.13 ± 2.00 –
Ca 16.71 ± 1.96 0.17
Mg 18.83 ± 2.91 0.07
100:1 FSOx-Mg perchlorate Fe(III) 16.21 ± 2.07 – 16.38 ± 2.30 2.07
Fe(II) 13.67 ± 2.08
-Ca 16.98 ± 2.01 0.14
Mg 18.65 ± 3.03 0.05
Average oxalate CO2 production at low perchlorate concentrations 11.08 ± 1.54 1.95
Average oxalate CO2 production at high perchlorate concentrations 16.33 ± 2.26 2.06
Abbreviations: EGA, evolved gas analysis; FSOx, 100:1 fused-silica-oxalate mixtures.
Table 1
The Quantities of CO2 and CO/CO2 Ratios Produced by Oxalates, Oxalate Mixtures, and Fused-Silica-Oxalate-Perchlorate Mixtures During EGA
carbonate or oxide during pyrolysis (Reactions 6 and 7 in Section 1), with minor amounts of the free metal (Reaction 8), and Fe(II) acetate produced similar proportions of the free metal and the oxide (Bamford & Tipper, 1980). Though acetone and acetic acid were the most abundant organic products, a multitude of additional minor masses were detected during EGA that were indicative of other organic species (Table S1). Methane (m/z 16) was not plotted on Figures 4–6 as several of the species listed in Table S1 produce a m/z 16 fragment during mass spectrometry, which made the risk of misidentifying methane extremely high. Pure acetates evolved two m/z 18 peaks during EGA; the first peak between 100 °C and 250 °C was related to dehydration and the second consisted of H2O and a m/z 18 fragment from acetic acid. Dispersing the acetates in fused silica altered the relative abundances of their organic pyrolysis products and caused many peaks to shift.
Perchlorates strengthened the CO2, m/z 28c, and H2O evolutions from acetates and weakened or scrubbed their acetone and acetic acid releases. While the m/z 36 fragment from acetone was significant in the pure acetate data, in the perchlorate mixtures HCl was the dominant source of m/z 36. Chloromethane (m/z 50) was evolved by the majority of the acetate-perchlorate mixtures and hints of chloroacetone were observed when acetates were abundant relative to perchlorates. Chloromethane was distinguished from methyl-pro-pene by examining how m/z 52 tracked with m/z 50. If m/z 50 and m/z 52 tracked each other at a ratio consistent with the ratio of CH335Cl to CH337Cl, they were assigned to chloromethane (Figure S4).
3.3.1. Pyrolysis of Fe(II) Acetate
Pure Fe(II) acetate evolved an acetic acid peak at 290 °C and CO2 and acetone peaks at 310 °C (Figure 4). The peaks were tracked by m/z 18, 28c, 36, and 50, which were likely sourced predominantly from the organic products of acetate pyrolysis rather than H2O, CO, HCl, and chloromethanes, as this was a pure Figure 4. Evolved m/z 44 (CO2, organic fragments), m/z 28c (corrected CO, organic fragments), m/z 18 (H2O, organic fragments), m/z 32 (O2), m/z 36 (HCl, organic fragments), m/z 58 (acetone), m/z 60 (acetic acid), and m/z 50 (chloromethane, organic fragments) versus temperature as detected by SAM-like EGA of pure Fe(II) acetate, FSFeIIAce, a 1000:1 FSFeIIAce and Ca perchlorate mixture, a 100:1 FSFeIIAce and Ca perchlorate mixture, and a 100:1 FSFeIIAce and Mg perchlorate mixture. N.D. stands for no detection, which indicates that no signals were detected for m/z 58 and m/z 60 during EGA of the 100:1 perchlorate mixtures. It should be noted that a 1 mg aliquot was used for the pure acetate experiment, 7 mg aliquots for the 100:1 silica and silica-perchlorate mixtures, and a 20 mg aliquot for the 1000:1 mixture. EGA, evolved gas analysis; FSFeIIAce, a 100:1 mixture of fused silica and Fe(II) acetate; SAM, Sample Analysis at Mars.
acetate run with no perchlorates present. A small 150 °C H2O peak was observed as the acetate dehydrated. A high-temperature m/z 28c peak was detected that was interpreted as instrumental in origin, as sporadic CO releases from the mass spectrometer filament are occasionally observed toward the end of lengthy EGA sequences.
When dispersed in fused silica at a 100:1 mixing ratio (FSFeIIAce), Fe(II) acetate produced broad CO2, m/z 28c, acetone, and acetic acid peaks at 330 °C. The 1000:1 FSFeIIAce-Ca-perchlorate mixture evolved two CO2 peaks during EGA. The first peak at 300 °C occurred with a weak m/z 28c release and a broad H2O shoulder. The second peak at 365 °C was associated with a weak release of acetone. O2 was not detected and no major HCl peak was observed.
When the 100:1 FSFeIIAce-perchlorate mixtures were pyrolyzed, the Fe(II) acetate CO2 and m/z 28c peaks shifted to 250-275 °C and acetone and acetic acid were no longer detected. Chloromethane was observed in the Mg-perchlorate mixture but not the Ca-perchlorate mixture, which was likely related to the earlier onset of Cl2/HCl from Mg perchlorate relative to Ca perchlorate. Unlike the Fe oxalate experiments, where CO was completely scrubbed, weak CO peaks were detected. Fe(II) acetate is soluble in water but no evidence for cation exchange between the acetate and the perchlorate solutions was observed in the EGA data. Each Fe(II)-acetate-perchlorate mixture produced a broad low-temperature H2O release with shoulders that partly overlapped with CO2, indicating oxidation, while the lower-temperature peaks were related Figure 5. Evolved m/z 44 (CO2, organic fragments), m/z 28c (corrected CO, organic fragments), m/z 18 (H2O, organic fragments), m/z 32 (O2), m/z 36 (HCl, organic fragments), m/z 58 (acetone), m/z 60 (acetic acid), and m/z 50 (chloromethane, organic fragments) versus temperature as detected by SAM-like EGA of pure Ca acetate, FSCaAce, a 1000:1 FSCaAce and Ca perchlorate mixture, a 100:1 FSCaAce and Ca perchlorate mixture, and a 100:1 FSCaAce and Mg perchlorate mixture. It should be noted that a 1 mg aliquot was used for the pure acetate experiment, 7 mg aliquots for the 100:1 silica and silica-perchlorate mixtures, and a 20 mg aliquot for the 1000:1 mixture. EGA, evolved gas analysis; FSCaAce, a 100:1 mixture of fused silica and Ca acetate; SAM, Sample Analysis at Mars.
to dehydration of the silica, Fe(II) acetate, and perchlorates. The O2 peaks from Ca and Mg perchlorate shifted to lower temperatures in the presence of Fe(II) acetate and chloromethane began to evolve from ∼200 °C in both mixtures, indicating that chlorination reactions began at temperatures below the onset of HCl evolution in the perchlorate-only runs. The 100:1 FSFeIIAce-Ca-perchlorate mixture produced a strong high-temperature HCl peak and a weak HCl release coincident with the O2 peak. The 100:1 FSFeI-IAce-Mg-perchlorate mixture evolved a sharp HCl peak at low temperatures and a small peak at high tem-peratures, indicating that some MgCl2 formed during the decomposition of Mg perchlorate.
3.3.2. Pyrolysis of Ca Acetate
Pure Ca acetate produced a very strong acetone peak, a m/z 44 peak, and an acetic acid peak at 445 °C dur-ing EGA, followed by smaller peaks for each species at 490 °C (Figure 5). Peaks for m/z 18, 28c, 36, and 50 were also detected at 445 °C and 490 °C and the CaCO3 formed by the thermal decomposition of Ca acetate evolved a major CO2 peak at 735 °C. As with the Fe(II) acetate experiment, the Ca acetate run exhibited a high-temperature CO peak related to instrument background. When Ca acetate was dispersed in fused silica at a 100:1 ratio (FSCaAce), the CO2 peak evolved by the CaCO3 intermediate shifted 100 °C lower and weakened significantly but the 445 °C and 490 °C m/z 44 and acetone peaks were largely unaffected. This was similar to the behavior seen for the CaCO3 intermediate formed by Ca oxalate when it was dispersed in silica. The acetic acid peak developed a broad low-temperature shoulder which began to evolve from 220 °C, suggesting hydrolysis related to the fused silica (Reaction 9 in Section 1).
Ca acetate continued to evolve prominent peaks for CO2, acetone, and m/z 36 between 380 °C and 520 °C and a strong high-temperature CO2 release from CaCO3 in the 1000:1 FSCaAce-Ca-perchlorate mixture. Figure 6. Evolved m/z 44 (CO2, organic fragments), m/z 28c (corrected CO, organic fragments), m/z 18 (H2O, organic fragments), m/z 32 (O2), m/z 36 (HCl, organic fragments), m/z 58 (acetone), m/z 60 (acetic acid), and m/z 50 (chloromethane, organic fragments) versus temperature as detected by SAM-like EGA of pure Mg acetate, FSMgAce, a 1000:1 FSMgAce and Ca perchlorate mixture, a 100:1 FSMgAce and Ca perchlorate mixture, and a 100:1 FSMgAce and Mg perchlorate mixture. It should be noted that a 1 mg aliquot was used for the pure acetate experiment, 7 mg aliquots for the 100:1 silica and silica-perchlorate mixtures, and a 20 mg aliquot for the 1000:1 mixture. EGA, evolved gas analysis; FSMgAce, a 100:1 mixture of fused silica and Mg acetate; SAM, Sample Analysis at Mars.
Peaks for m/z 18, 28c, 50, and acetic acid were also detected, with the acetic acid release occurring between 180 °C and 550 °C, showing further evidence for acetate hydrolysis. A sharp H2O release was detected at 200 °C. For the 100:1 FSCaAce-perchlorate mixtures, the initial CO2 release from Ca acetate at ∼445 °C strengthened but did not shift, while the high-temperature CO2 peak from decomposition of the CaCO3 intermediate was no longer detected. A minor CO2 shoulder was observed, suggesting the carbonate rapidly decomposed in the presence of HCl. The low-temperature H2O peaks sharpened and the higher-tempera-ture H2O releases due to oxidation strengthened significantly. The O2 peaks from Ca and Mg perchlorate weakened but did not shift to lower temperatures in the presence of Ca acetate. Each Ca-acetate-perchlorate mixture evolved broad high-temperature HCl peaks above 600 °C and Mg perchlorate produced a strong mid-temperature HCl peak. The acetone releases from the 100:1 FSCaAce-perchlorate mixtures were sig-nificantly weakened, but in contrast to the Fe(II) acetate experiments they were not scrubbed. The acetic acid peaks strengthened slightly, and chloromethane releases were detected with the onset of the O2 peaks.
3.3.3. Pyrolysis of Mg Acetate
Pure Mg acetate evolved H2O and acetic acid peaks at 160 °C, acetone, acetic acid, m/z 18, 28c, 36, 44, and
m/z 50 peaks at 340 °C, and a strong CO2 peak with minor acetic acid and m/z 18 at 400 °C (Figure 6). When Mg acetate was dispersed in fused silica at a 100:1 mixing ratio (FSMgAce), the 340 °C m/z 44 peak became more prominent and the 400 °C CO2 peak broadened and extended to ∼700 °C. The 400 °C CO2 peak was likely related to the decomposition of a MgCO3 intermediate as the peak began to evolve from 350 °C and had little associated m/z 28c. The acetic acid peak observed at 160 °C for pure Mg acetate was no longer detected in silica, but a significant shoulder was observed prior to the major acetic acid peak at 340 °C. The acetone peak shape was relatively unchanged, but acetone and acetic acid were comparable in peak height, in contrast to the pure acetate where acetone was dominant.
EGA of the 1000:1 FSMgAce-Ca-perchlorate mixture produced CO2 peaks at 340 °C and 380 °C and a sig-nificant high-temperature CO2 shoulder. The CO2 peaks were associated with releases of acetone, m/z 36, and acetic acid. The CO2 shoulder was most prominent up to 430 °C but continued to 600 °C. A weak m/z 28c release tracked CO2. A broad H2O peak occurred at 180 °C as the mixture dehydrated and a prominent H2O release accompanied the CO2 peaks.
The 100:1 FSMgAce-perchlorate mixtures produced CO2 peaks between 400 °C and 450 °C, with each CO2 profile featuring a minor shoulder that initiated at ∼300 °C. The CO2 releases were tracked by m/z 28c. The Ca and Mg perchlorate O2 peaks weakened but did not shift significantly in the presence of Mg acetate. Each Mg-acetate-perchlorate mixture evolved broad high-temperature HCl releases from ∼600 °C and sharp HCl and chloromethane peaks were detected as O2 began to evolve. Both the acetone and acetic acid releases from Mg acetate weakened substantially in the Ca- and Mg-perchlorate mixtures.
When FSCaAce and FSMgAce were mixed with Ca and Mg perchlorate, minor peaks such as m/z 92 (35 Cl-CH2COCH3) and m/z 94 (37ClCH2COCH3) were observed that were suggestive of chloroacetone (Table S1; Figure S5). SAM-like pyrolysis-GC-MS of a 1000:1 FSMgAce-Ca-perchlorate mixture confirmed that chlo-roacetone was being produced. Chlochlo-roacetone was not identified in previous pyrolysis-GC-MS studies of a 100:1 FSMgAce-Ca-perchlorate mixture (M. Millan, personal communication, March 5, 2019), suggesting that elevated acetate concentrations relative to perchlorates would be required in a sample for chloroace-tone to be observable by SAM.
3.3.4. Quantification of Acetate CO2 Production During Pyrolysis
The H2O profiles observed in Figures 4–6 were consistent with anhydrous Fe(II) oxalate, Ca acetate mono-hydrate, and Mg acetate tetrahydrate. The different acetate standards evolved highly variable amounts of CO2 during EGA (Table 2; Table S6). It should be noted that the CO2 production from pure acetates was quantified using the m/z 44CO2 traces. For the fused silica mixtures, m/z 44 and m/z 44CO2 matched well for major peaks but m/z 22 was too weak to assess minor m/z 44 evolutions so m/z 44 was used for quantifica-tion. Pure Fe(II), Ca, and Mg acetates evolved greater amounts of CO2 than pure Fe(II), Ca, and Mg oxalates but after dispersal within FS-120 the oxalates produced stronger releases. The addition of minor Ca perchlo-rate to the acetate-fused-silica mixtures caused a modeperchlo-rate increase in the quantities of CO2 evolved (that was within error of the perchlorate-free fused-silica mixtures). However, Fe(II) acetate appeared to evolve slightly less CO2 (also within error). Higher concentrations of Ca perchlorate caused an increase in the CO2