HAL Id: hal-01524143
https://hal.archives-ouvertes.fr/hal-01524143
Submitted on 17 May 2017HAL is a multi-disciplinary open access archive for the deposit and dissemination of sci-entific research documents, whether they are pub-lished or not. The documents may come from teaching and research institutions in France or abroad, or from public or private research centers.
L’archive ouverte pluridisciplinaire HAL, est destinée au dépôt et à la diffusion de documents scientifiques de niveau recherche, publiés ou non, émanant des établissements d’enseignement et de recherche français ou étrangers, des laboratoires publics ou privés.
A Simple Method to Determine Electrospray Response
Factors of Noncovalent Complexes
Valerie Gabelica, Frederic Rosu, Edwin de Pauw
To cite this version:
Valerie Gabelica, Frederic Rosu, Edwin de Pauw. A Simple Method to Determine Electrospray Re-sponse Factors of Noncovalent Complexes. Analytical Chemistry, American Chemical Society, 2009, 81 (16), pp.6708-6715. �10.1021/ac900785m�. �hal-01524143�
This document is the unedited Author’s version of a Submitted Work that was subsequently accepted for publication in Analytical Chemistry, 16(81), p. 6708-6715, copyright © American Chemical Society after peer review. To access the final edited and published work see http://dx.doi.org/10.1021/ac900785m.
A Simple Method to Determine Electrospray Response
Factors of Noncovalent Complexes
Valérie Gabelica1,2, Frédéric Rosu1,2, Edwin De Pauw1,2
1 Physical Chemistry and Mass Spectrometry Laboratory, Department of Chemistry, Building B6c,
University of Liège, B-4000 Liège, Belgium
2 GIGA-Systems Biology and Chemical Biology, GIGA-R, Building B35, University of Liège, B-4000
Liège, Belgium AUTHOR EMAIL ADDRESS: [email protected]
RECEIVED DATE (to be automatically inserted after your manuscript is accepted if required according to the journal that you are submitting your paper to)
ABSTRACT. The quantitative study of noncovalent complexes by electrospray mass spectrometry requires the determination of the relative response of each species. The method proposed here to determine the electrospray response factors is based on the use of (1) an internal standard and (2) the mass balance equation applied to one binding partner M, for which different complexes MxLy are
detected in the electrospray mass spectra. A set of experiments providing various ratios between the complexes (e.g. different ligand concentrations in a titration experiment or different time points in a kinetics experiment) is used to generate a set of independent linear equations that can be solved using simple matrix algebra to find the response factors of each MxLy complex relative to that of the internal
standard. The response factors can then be used to determine equilibrium dissociation constants or for the quantitative monitoring of reaction kinetics. The first is illustrated with a study of DNA-ligand
2 complexes, where we show that neither minor groove binding nor intercalation dramatically affects the DNA response factor. The second is illustrated with a study of the association kinetics of the telomeric G-quadruplex dGGG(TTAGGG)3 with its complementary strand, where the response factors allow
correcting for the relative response of the quadruplex and the long duplex and obtaining reproducible association rate constants independently of the source tuning potentials.
INTRODUCTION
Electrospray mass spectrometry (ESI-MS) has become a widely used method for the study of noncovalent complexes.1-15 Among its major advantages are the low sample consumption, the easy
assignment of complex stoichiometries, and the capacity to analyze complex mixtures. On the qualitative point of view, it is now widely accepted that proper use of the ESI mass spectrometer allows determining reliably the stoichiometries of the complexes formed in solution. On the quantitative point of view, however, the biggest challenge is to find the relationship between the intensity in the mass spectra and the concentration in the injected solution, because in the case of noncovalent complexes the concentrations are unknown if the equilibrium dissociation constants are unknown.
The factor relating the ion signal and the analyte concentration is called the electrospray response factor R, as defined in Equation (1) for compound M:
M RIM M (1)
Enke16 developed a predictive model for the response of compound M in the presence of an electrolyte
E. This model is based on the fact that the analyte must have taken some of the excess charges of the droplet in order to go from the solution to the gas phase as an ion. Because the excess charges are located at the surface of the droplet, an important factor is the partitioning of the analyte between the droplet interior and the droplet surface. The ion signal is therefore proportional to the concentration of analyte at the surface of the droplet, the efficacy of transferring ions from the surface of the droplet to
3 the gas phase, and the efficiency of ion transmission in the mass spectrometer. If other analytes or electrolytes are also present in the solution, a competition arises for accessing the excess charges at the droplet surface, and the response of M depends on the equilibrium partitioning constant of ion M between the surface and the center of the droplet. The equilibrium partitioning constants are mainly affected by the solvophobicity of the analyte (solvophobic analytes preferentially sit on the droplet surface).
This equilibrium partitioning model was tested experimentally and validated,17-22 including in the case
of noncovalent complexes of known equilibrium dissociation constants.23;24 According to this model, it
can be anticipated that biomolecule noncovalent complexes with small ligands that do not induce conformational changes would have the same response factor as the free biomolecule. However, complexes with small ligands inducing conformational changes in the biomolecule, or complexes with large ligands that are partly exposed to the solvent in the complex, will most likely have a different electrospray response factor compared to the free biomolecule.
To determine the equilibrium dissociation constant (Eq. 2) of a noncovalent complex in the simple case of a receptor M binding to ligand L and forming a 1:1 complex only, the typical experiment consists in mixing M and L at known total concentrations [M]tot and [L]tot, and measuring the
electrospray signal of free M and of ML. The equilibrium dissociation constant is defined as:
ML L M Kd (2)One therefore needs to determine the concentration ratio [M]/[ML] and use the mass balance equations to find Kd. Taking into account the response factors, the concentration ratio is therefore equal
to:
MLM ((MLM)) I((MLM)) I R I I R R ML M (3)Several approaches for the determination of Kd have been used, and some of them have already been
4 complexes. The advantage of these methods is to avoid the need for maintaining intact complexes upon ionization. However, they do not use the unique capability of electrospray mass spectrometry to detect and quantify all stoichiometries simultaneously.
Here we will focus on the methods based on the measurement of the electrospray signal of the complexes. These methods therefore require knowledge of the ratio between response factors. The simplest approach is to assume that RML/RM = 1, i.e. that the response factors of the free receptor and the
complex are equal. This approach is simple, can be applied to multiple complex stoichiometries (ML, ML2, ML3,…), but its applicability is always questionable.
Other approaches, either avoiding any assumption on R, or including the determination of R, have therefore been developed. For example, complete displacement of the complexation equilibrium towards the complex, and comparison with the receptor alone, allows determining the ratio between two response factors.27;28 This approach is applicable when the equilibrium can be displaced without
changing solvent or electrolyte (otherwise the response factors could change), and this is feasible only for two-state systems (not in the case of multiple stoichiometries).
Several fitting methods for titration experiments have also been devised to determine Kd and R in a
single fit. We previously used a method involving equimolar mixtures of M and L, varying the total concentrations,29 but the method assumes that R is constant over a large analyte concentration range,
and is not applicable when other complexes than ML are formed. A rigorous equation allowing the fitting of titration experiments (fixed [M]tot, increasing [L]tot, and fitting of I(ML)/I(M) as a function of
[L]tot), with Kd and R as adjustable parameters, can be derived for the formation of 1:1 complexes.30;31
This equation is second degree in [L]tot. Variants of this approach has also been proposed for
competition experiments.30;32
Another approach is to derive equations relating the concentration of one free partner to the concentration of added ligand.33-35 These approaches do not require knowledge of R because the
intensity of the complex is not monitored. The concentration of the free partner is determined during a titration experiment and the method needs a prior calibration. Wortmann et al. used an internal reference
5 for the calibration.34 This approach is attractive and works well for 1:1 stoichiometries. However, in the
case of multiple stoichiometries, the equations would become much too complex and the method does not take advantage of the detection and separate quantification of each stoichiometry.
The most advanced methods using rigorous equations were developed by Gross and co-workers,36;37
who derived the expressions of the relative intensities of the free receptor and each complex stoichiometry, as a function of the free ligand concentration, of the equilibrium constants and of the response factors. The free ligand concentration is then related to the total ligand concentration. The equations were derived for oligomerization,36 and for multiple ligand binding to a receptor.37
Determination of Kd’s and R’s requires solving a complex system of differential equations via numerical
integration. This procedure has been applied successfully to the dimerization of gramicidin36 and to
metal binding to the thrombin binding aptamer, forming a 1:1 complex.37
In summary, in all methods described to date, determining all relative response factors becomes increasingly difficult as the number of different complexes detected increases, because of the complexity of the equations and because of the number of adjustable parameters. Here we propose a solution to this problem. By using an internal standard throughout the experiment, all response factors can be determined with a simple set of linear equations. This will be illustrated in the case of ligand binding to duplex DNA. Furthermore, we will also show that the same method can be used to follow non-covalent assembly kinetics, and this will be illustrated in the study of hybridization kinetics of the telomeric DNA with its complementary strand.
EXPERIMENTAL SECTION
Materials. DNA strands were purchased from Eurogentec (Seraing, Belgium) and dissolved in bi-distilled water to make 200 µM stock solutions that were stored at -20 °C. The duplex (dCGCGAATTCGCG)2, G-quadruplex (dGGG(TTAGGG)3), and C-strand (dCCC(AATCCC)3) were
6 at 85 °C and allowing to cool slowly to room temperature. The final ammonium acetate concentration was 100 mM for the duplex, 150 mM for the G-quadruplex and the C-strand. The single strand dT6
served as internal standard. The minor groove binding ligand Hoechst 33258 (CAS: 23491-45-4, MW = 424.504 Da) and the intercalating ligand ethidium (CAS: 1239-45-8; MW = 314.409 Da) were obtained from Sigma-Aldrich (Bornem, Belgium). All concentrations were determined by spectrophotometry (for Hoechst 33258: 348 = 42000 M-1cm-1; for ethidum: 480 = 5850 M-1cm-1, for the duplex
(dCGCGAATTCGCG)2: 260 = 195000 M-1cm-1; for the G-strand in quadruplex form: 260 = 215000 M -1cm-1; for the C-strand: 260 = 185000 M-1cm-1, for dT6 internal standard: 260 = 49200 M-1cm-1).
Electrospray mass spectrometry. All experiments were performed using a Q-TOF Ultima Global electrospray mass spectrometer (Waters, Manchester, UK), using MassLynx 4.0 software. The electrospray source was operated in the negative ion mode: capillary voltage = -2.2 kV, cone voltage = 100 V, source pressure = 3.5 mbar, source temperature = 40 °C, desolvation temperature = 60 °C, collision energy = 10 V. A syringe pump was used for sample introduction at 4 µL/min. The source declustering was modulated by changing the RF Lens 1 voltage, from 100 V to 140 V for the duplex+ligand binding studies, and from 150 V to 200 V for the G+C kinetics studies. The instrument was externally calibrated with sodium iodide, and each spectrum was further internally calibrated using the internal standard as a lock mass (moniosotopic peak of dT62- at m/z = 880.1530).
For the binding studies, separate ESI-MS spectra were recorded at fixed total DNA and internal reference concentrations, and increasing ligand concentrations. Each ESI-MS spectrum consisting of a sum of at least 150 scans was smoothed (mean function, 215 channels) and the background was subtracted (polynomial order 10, 1% below curve, tolerance 0.01). The peak areas are calculated with the centroid function (Top, 30 channels). Using these parameters, the individual isotopic peaks of the internal standard are distinguished (and summed to obtain the peak area of the internal standard), and the isotopic peaks of the larger DNA species are smoothed (and therefore all integrated upon centroiding). However, the ammonium adduct peaks (+17 Da) are distinguished and integrated separately.
7 For the kinetics studies, the acquisition of the ESI-MS spectrum (3 seconds per scan) is started simultaneously with the addition of the C-strand to the pre-mixed G-strand and internal standard. The mixture is agitated for 3 s, loaded in the syringe, and injected as fast as possible in the mass spectrometer. A stable spray is obtained in usually less than one minute. For each species, an extracted ion current (intensity vs. time) was reconstructed for each species to be quantified. An extracted ion current of their respective background (same m/z span and close to the m/z of the ion of interest) was subtracted for each species. Because the width of the m/z window used to generate the extracted ion currents could vary from species to species, proper background subtraction was found to be critical for obtaining reproducible results.
RESULTS AND DISCUSSION
Determination of response factors
Let us consider the general situation where the receptor M can bind several ligands L and can also oligomerize, forming MxLy complexes, with x ≥ 1 and y ≥ 0. The goal is to find all concentrations
[MxLy]. The mass balance equation for M is given by:
max ymax 0 y x y x 1 x tot x M L M (4) For each MxLy complex in the mixture, the concentration ratio relative to the internal standard (noted“Std”) is related to the intensity ratio by the response factors as follows:
(( )) xy (M(StdL)) Std L M L M Std y x I I R I I R R Std L M x y x y y x (5)Two assumptions are implied in this equation: (1) the complexes MxLy detected are neither formed nor
disrupted in the electrospray mass spectrometer, and (2) the ratio between the response factor of each MxLy form and the response factor of the internal standard remains constant. However the absolute
8 response factors of the internal standard and of the ions of interest can change during the experiment. Substituting each [MxLy] in Equation (4) by its expression from Equation (5) gives:
max max ) ( ) ( y 0 y Std L M xy x 1 x tot I I R x Std M x y (6)A necessary condition is that [Std] remains constant throughout the experiment, i.e. that the internal standard does not bind to M or L. If the total receptor concentration is kept constant, then the concentration ratio is defined as C (Equation 7).
Std C M tot
(7)
C is known provided that all complexes MxLy actually formed in solution provide a detectable signal (in
other words, [M]tot in Equation (4) must be the analytical concentration of M). If n is the number of
unknown response factors Rxy, one must have a number m of independent equations like Equation (6)
equal to or greater than the number of unknown Rxy’s.
These equations are provided by doing a titration experiment with fixed [M]tot and varying [L]tot. At
each ligand concentration added, the intensity ratios are measured and an equation like (6) can be written. In a kinetics experiment (fixed [M]tot, and the proportions of each MxLy complex vary with
time), each time point at which the intensity ratios are measured also provide an equation like (6). A titration experiment or a kinetics experiment therefore provide a set of linear equations, which can be written in a matrix form,
C C C R R R I I x I I x I I x I I x I I x I I x I I x I I x n 2 1 m std nm n m std m 1 1 j std ij i 2 std 22 2 2 std 12 1 1 std 1 n n 1 std 21 2 1 std 11 1 ... ... ... ... ... ... ... ... ... ... , , , , , , , , (8a) C R I (8b)
9 where n is the number of different forms of M and hence the number of different response factors to determine, m is the number of independent data sets (number of ligand concentrations tested in a titration experiment, or number of time points in a kinetics experiment), Iij is the intensity of the ith form
of M (1 ≤ i ≤ n) in the jth experiment (1 ≤ j ≤ m), Istd,j is the intensity of the internal standard in the jth
experiment, and xi is the number of monomer in the ith form of M, MxLy. If m ≥ n, the resolution of this
system of linear equations is done by calculating I+, the inverse matrix of I, and then calculating:
C I
R (9)
The Moore-Penrose pseudoinverse mathematical function is a generalization of the inverse matrix, and provides a least squares solution to an overdetermined system of linear equations (m ≥ n). The Moore-Penrose pseudoinverse is implemented in several mathematics softwares like MathCAD (geninv function) or MathLAB (pinv function). MathCAD 14 was used in the present work.
Once the response factors relative to the internal standard are obtained, the concentration of each MxLy is recalculated at each ligand concentration using Equation (5). The determination of the relative
response factors is therefore independent of the determination of the equilibrium binding constants, and is performed as a first step. This contrasts with the other methods which involve fitting titration data with equations to extract both Kd and R. As the response factors are the best fit to all mass balance
equations, each mass balance Equation (6) is not perfectly correct when using these average response factors. As [M]tot is known at each titration point, the concentrations can be further corrected so as to
satisfy the mass balance equation at each titration point. Equation (10) is therefore used to recalculate the concentration of each MxLy complex.
max y x max y x y 0 y (Std) ) L M ( xy x 1 x ) Std ( ) L M ( tot xy corr y x I I R x I I M R L M (10)10
max max y 1 y x y x 1 x tot free L y M L L (11) BindingThe first system investigated is the binding of ligand Hoechst 33258 to the duplex DNA (dCGCGAATTCGCG)2. Hoechst 33258 binds to the minor groove of the duplex in the central AATT
region, and the binding mode does not induce major distortion of the DNA structure. The ratio between the response factor of the complex [duplex+Hoechst33258]5- and that of the [duplex]5- had been
evaluated previously at 0.5 ± 0.2, using a method involving stepwise dilution of an equimolar mixture (concentration range tested: 2 to 14 µM; mass spectrometer: Finnigan LCQ classic).29 Here we applied
the new method using the mass balance equation for the total DNA concentration to determine the responses of duplex and 1:1 complex relative to that of the internal standard dT62-. The mass balance
equation for the ligand cannot be used because the free ligand is not detected in our experimental conditions. The relative response factors were evaluated at 500 nM and 5 µM total duplex concentration, by performing titration experiments. Checking if the total concentration has an influence on the relative response is interesting to determine if there is an influence of competition for the droplet surface at the concentrations investigated.
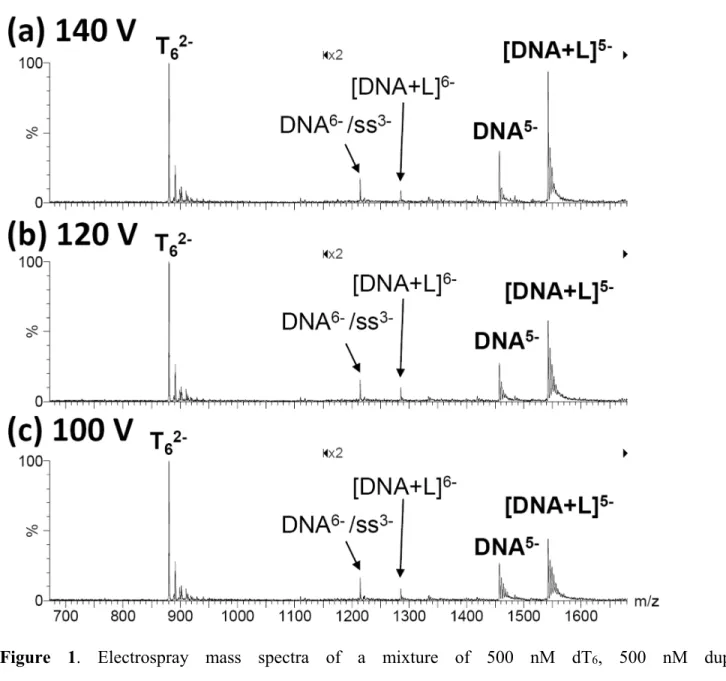
The source declustering potentials must be low enough so as to keep the duplex and the complexes intact, but high enough so as to desolvate the ions properly. The ESI-MS spectra were recorded at three different source RF Lens 1 voltages, and typical spectra are shown in Figure 1. The relative peak intensities clearly change with the voltage. Furthermore, the ammonium adduct peaks on the right hand side of the main peak are more numerous as the voltage decreases, indicating that removal of the adducts is not complete and therefore that the declustering conditions are relatively soft. We therefore also tested whether considering only the fully desolvated ion, or the fully desolvated ion plus the two first ammonium adducts had an influence on the relative response. This allows checking for the influence of the declustering/desolvation step on the electrospray response factors. The complete
11 calculation procedure is illustrated in detail in supporting information for one series (RF Lens 1 = 120 V, only fully desolvated ion peaks considered). All response factors are summarized in Table 1.
The relative response factors are informative in several respects. Firstly, the total DNA concentration has an influence on the relative response of the duplex and complex relative to the internal standard dT6:
RT/RDNA increases as the concentrations increase), indicating that as both concentrations increase, dT6
better competes for the droplet surface compared to the duplex and the complex. However, the total concentration has no significant influence on the relative response of duplex and the complex. Secondly, the relative response of the duplex and complex relative to dT6 increase as the source voltage increases.
Given the distribution of weakly bound ammonium ions on the duplex and complexes, declustering certainly contribute to this effect, but voltage-dependent transmission effects can also play a role. Thirdly, considering or not the two first adducts has of course an influence on the relative response calculated versus the internal standard, but has no significant influence on the ratio between the responses of the duplex and of the complex. This leads us to the conclusion that the systematically lower response of the complex compared to the duplex is due rather to the ion partition in the electrospray droplets than to ion declustering in the source. It is also worth pointing out that the present results agree with a previous estimation of the response factors (
DNA L DNA R R = 0.5).29
Once the response factors relative to the internal standard are obtained, concentrations of free DNA and of complex are recalculated at each ligand concentration using Equation (10), the free ligand concentration is calculated uing Equation (11), and the equilibrium dissociation constant the is calculated for each titration point using Eq. (12) (see supporting information for more details).
corr corr free d DNA L DNA L K (12) The average dissociation constant estimated using the correction for the response factors is 10-7.17±0.09 M(versus 10-6.88±0.05 M if response factors were supposed to be equal).
For minor groove binders, relatively similar response factors were expected for the duplex and the complex, because the minor groove binding mode does not induce major distorsions in the DNA.29;38 It
12 is also a simple case because there is only one possible stoichiometry (1:1 complex). However our method should be as easily applicable to systems with multiple complexes. We therefore investigated the complexes formed between the same duplex and the intercalator ethidium. Ethidium can intercalate at several sites so that multiple stoichiometries are observed, and intercalation results in a stretching of the DNA so as the number of ligands bound increases, the response of the complex might therefore deviate significantly from that of the duplex.
The duplex (dCGCGAATTCGCG)2 (5 µM) was titrated by ethidium bromide in the presence of dT6
(5 µM) as internal standard, and the ESI-MS spectra were recorded for each ethidium concentration at three different source RF Lens 1 voltages (100 V, 120 V, 140 V). The relative intensities of the free duplex and all the complexes [DNA+n] (n = number of ligands bound per duplex) are shown in Figure 2. The challenge here is that as the ligand concentration is increased, higher stoichiometries keep appearing in the spectra, increasing the number of response factors to be determined. However, as the number of unknown response factors increases, the number of independent equations must increase accordingly. For example, if the response of the complex [DNA+5] is to be determined, the range of ethidium concentrations to be tested must ensure that the relative intensity of the [DNA+5] varies significantly, but when the ethidium concentration is increased the complex [DNA+6] appears, etc… However the intensities of the complexes [DNA+5] and [DNA+6] are too low to give independent equations. Indeed, when all data from Figure 2 are included in a matrix of eight equations to find seven unknown response factors, negative values are found for some of the response factors, which is an indication that the set of equations is not sufficient to determine all response factors.
To simplify the problem, the number of unknowns has therefore been reduced by grouping the complexes and calculating their average response factors. Two ways of grouping the data were tested:
(T ) ) 6 DNA ( ) 5 DNA ( ) 4 DNA ( 456 ) T ( ) 3 DNA ( ) 2 DNA ( 23 ) T ( ) 1 DNA ( 1 ) T ( ) DNA ( 0 tot 6 tot 6 6 6 6 I I I I R I I I R I I R I I R T DNA (13)
(T ) ) 6 DNA ( ) 5 DNA ( 56 ) T ( ) 4 DNA ( ) 3 DNA ( 34 ) T ( ) 2 DNA ( ) 1 DNA ( 12 ) T ( ) DNA ( 0 tot 6 tot 6 6 6 6 I I I R I I I R I I I R I I R T DNA (14)13 Both grouping methods give positive values for all response factors. R0 values determined by the two
grouping methods differ by less than 2%. Moreover, from the two kinds of grouping, the individual response factors can be approximated using:
2 R R
Rij i j (15)
Only R5 and R6 cannot be distinguished. The response factors obtained for the free DNA duplex and
the ethidium complexes are given in Table 2. The concentration of each DNA form [DNA+n] (n = 0-6) was recalculated using Equation (10) and the ligand free concentration using Equation (11). The resulting binding constants (Eq. 16) are given in Table 3.
corr corr free n d L DNADNA n n 1 K ( ) , (16)The results obtained with the ethidium complexes demonstrate that the present method can be easily transposed to complexes of multiple stoichiometries. Moreover, the response factors listed in Table 2 show that the response of the complexes with 1 to 3 ligands does not change dramatically compared to the response of the free DNA. This validates also for intercalators the assumption of equal response factors were for free DNA and DNA-ligand complexes.39 Only complexes with 4 ligands or more have a
significantly lower response than the free DNA.
Kinetics
The method for the determination of response factors can also be used to study reaction kinetics involving noncovalent complexes. This will be illustrated by the study of kinetics of formation of a duplex DNA (noted GC) obtained by mixing the DNA G-quadruplex dGGG(TTAGGG)3 (G) and its
complementary sequence dCCC(AATCCC)3 (C). Because duplex formation requires first the unfolding
of the intramolecular G-quadruplex, the formation of the duplex is much slower than a standard 21-mer duplex formation and can be followed by manual mixing and injection. The study of this assembly reaction by ESI-MS has been reported previously,40 but because the response factors were not
14 single strand dT6 was added to the G-quadruplex sample as an internal standard, the reaction kinetics
was initiated by adding the C-rich complementary strand, and the ESI-MS spectra are recorded as a function of time (3 seconds per scan).
The experiment was repeated at three different source voltages (RF Lens 1 = 150 V, 175 V and 200 V). The average ESI-MS spectra obtained by summing all scans from 2.6 to 15.6 minutes are shown in Figure 3. For strand G, the most intense charge state is 5-, and it can be seen from Figure 3 that the response of G5- relative to that of T62- does not change much. The complementary strand C was
observed as a monomer 5- and 4-, but also as a dimer 7- 6-. A dimer C28- most probably superimposes
with the monomer C4-. Finally, the duplex GC can be observed at charge states 8-, 7- and 6-. The
number of nonspecific ammonium adducts depends greatly on the source voltage used.
The objective of using an internal standard is to obtain user-independent kinetics data, and to obtain concentrations as a function of time. The extracted ion currents of each species: G5-, G4-, GC9-, GC8-,
GC7-, GC6-, and the internal standard dT62- were reconstructed and imported in a algebra sheet (each line
being a time point). Extracted ion currents of the background corresponding to each species must also be reconstructed, and subtracted from the signal extracted ion currents. The background of each peak is measured at the left of the peak, with the same m/z range as the peak’s extracted ion current. For example, for GC7- at 175 V, the signal extracted ion current is reconstructed from the mass range
[1834.0-1843.8] (this includes the fully desolvated GC7- plus the three first ammonium adducts), and the
background extracted ion current is reconstructed from the mass range [1824.8-1834.0]. The number of ammonium adducts taken into account for each charge state depended on the source voltage. As an example, for GC7-, 9 adducts were taken into account at 150 V, 3 adducts at 175 V, and 2 adducts at 200
V.
In terms of quantitation, if relative intensities between G-quadruplex and GC duplex were used to monitor the appearance of the GC duplex, the result greatly significantly on the voltage chosen, the charge state(s) chosen, and the number of ammonium adducts considered. This is illustrated in Figure 4(a), where the relative intensity of GC, calculated using Equation (17), is plotted as a function of time.
15 %GC Intensity = % ) ( ) ( ) ( 100 I I I G GC GC (17)
Figure 4(a) shows that the voltage or the charge states chosen do influence the result. However, as will be shown below, the response factors do correct for user-dependent choices such as the voltage or the peaks taken into consideration. For each voltage, two ways of generating the matrix I were tested: (1) taking into account the whole charge state distribution for each species G and GC, and (2) taking the most intense charge state of each species, i.e. G5- and GC7-. The values of R obtained by solving
Equation (8) are given in Table 4. The actual concentrations of each component at each time point are then recalculated from the relative intensities using Equation (10), giving [G]corr and [GC]corr
The graphs of the corrected duplex concentration [GC]corr as a function of reaction time are shown in
Figure 4(b) for the three experiments with the two different data treatments. All reconstructed kinetics graphs now superimpose whatever the instrumental settings or charge state chosen for data processing. The graphs of Figure 4(b) were fitted with the pseudo-first order formation Equation (18) to find the kinetic constant k.
GC ab(1ekt) (18)The fitting results are given in Table 4. The rate constants are similar for all six datasets, demonstrating the power of the new method described here. The results therefore show that the present determination of relative response factors is able to correct for some user-dependent variations (voltage used, peaks chosen for quantitation).
CONCLUSION
A novel method to determine electrospray response factors of noncovalent complexes has been presented. The simplicity of the method comes from the use of an internal standard and the use of the mass balance equation applied to one of the binding partners. The system of equations to be solved is a
16 set of linear equations which can be solved by simple matrix algebra, whatever the number of different complexes taken into account. The necessary conditions for the method to be successful are as follows: 1) The internal standard’s concentration must remain known throughout the experiment, and the ratio
between the response of the internal standard and the response of each species of interest must be constant throughout the experiment. The ideal internal standard is therefore a compound of similar nature as the complex of interest, but which does not form any noncovalent complex in the experimental conditions. The second condition is more likely to be fulfilled when the standard is of similar chemical nature as the compounds of interest, and when the internal standard and the analytes are not in strong competition for the droplet’s surface, i.e. at low analyte concentrations, low flow rate, and high supporting electrolyte concentration.
2) In order for the mass balance equation to be correct, each complex formed in solution must be detected in the ESI-MS spectrum. A majority of study cases comply with this condition. However, a case where the method is not applicable is when aggregation or precipitation upon complexation causes a loss of electrospray signal.
3) The charge state or the number of solvation adducts taken into account for each species has no particular importance for the determination of equilibrium or kinetics constants, because the response factors will provide the necessary correction to recalculate the actual concentrations. Similarly, the experimental settings (source voltages,…) must only ensure that all species are detected intact. This ability to correct for these user-dependent parameters is a major advantage of the method.
4) To successfully obtain response factors, it is crucial that the set of linear equations generated from the experiment contains enough independent equations relative to the number of unknowns. In other words, the experimental conditions (e.g. ligand concentrations) must be varied in a range allowing for significant changes of the relative proportions of all the complexes for which the response factors must be calculated. Continuous variation of ligand concentration in a flow system41;42 is also compatible with our method.
17 Finally, in our method the determination of the relative electrospray response factors is done independently from the determination of the equilibrium binding constants or the reaction rate constant. It can therefore be used to study electrospray response factors per se, and will allow further studies on the influence of experimental parameters (compound’s hydrophobicity,43 presence of additives, solvent
composition, declustering voltages,44 analyte conformation,44;45…) on the electrospray response, and
extending the theoretical framework provided by the equilibrium partitioning model.
Acknowledgements. This work was supported by the FRS-FNRS (CC 1.5.286.09 to VG) and the University of Liège (Starting grant D-08/10 to VG). VG is a FNRS research associate and FR is a FNRS postdoctoral fellow. The authors would like to thank Prof. Françoise Bastin for useful discussions regarding the Moore-Penrose pseudo-inverse.
Supporting Information Available. Detailed procedure for the calculation of electrospray response factors and equilibrium dissociation constant for Hoechst 33258 binding to the duplex DNA. This material is available on the World Wide Web at http://pubs.acs.org.
REFERENCES
1. Smith, D. L.; Zhang, Z. Mass Spectrom.Rev. 1994, 13, 411-29.
2. Smith, R. D.; Bruce, J. E.; Wu, Q.; Lei, Q. P. Chem.Soc.Rev. 1997, 26, 191-202. 3. Loo, J. A. Mass Spectrom.Rev. 1997, 16, 1-23.
4. Veenstra, T. D. Biophys.Chem. 1999, 79, 63-79.
5. Loo, J. A.; Dejohn, D. E.; Du, P.; Stevenson, T. L.; Ogorzalek Loo, R. R. Med.Res.Rev 1999, 19, 307-19.
18 6. Daniel, J. M.; Friess, S. D.; Rajagopalan, S.; Wendt, S.; Zenobi, R. Int.J.Mass Spectrom. 2002, 216, 1-27.
7. Breuker, K. Angew.Chem.Int.Ed. 2004, 43, 22-25.
8. Heck, A. J. R.; Van Den Heuvel, R. H. H. Mass Spectrom.Rev. 2004, 23, 368-89. 9. Breuker, K. Int.J.Mass Spectrom. 2004, 239, 33-41.
10. Hofstadler, S. A.; Sannes-Lowery, K. A. Nature Rev.Drug Discov. 2006, 5, 585-95. 11. Zehender, H.; Mayr, L. M. Curr.Opin.Chem.Biol. 2007, 11, 511-17.
12. Annis, D. A.; Nickbarg, E.; Yang, X.; Ziebell, M. R.; Whitehurst, C. E. Curr.Opin.Chem.Biol. 2007, 11, 518-26.
13. Benesch, J. L.; Ruotolo, B. T.; Simmons, D. A.; Robinson, C. V. Chem.Rev. 2007, 107, 3544-67.
14. Wyttenbach, T.; Bowers, M. T. Annu.Rev.Phys.Chem. 2007, 58, 511-33.
15. Schermann, S. M.; Simmons, D. A.; Konermann, L. Expert Rev.Proteomics 2005, 2, 475-85.
16. Enke, C. G. Anal.Chem. 1997, 69, 4885-93.
17. Cech, N. B.; Enke, C. G. Anal.Chem. 2001, 73, 4632-39.
18. Cech, N. B.; Enke, C. G. Mass Spectrom.Rev. 2001, 20, 362-87.
19. Constantopoulos, T. L.; Jackson, G. S.; Enke, C. G. Anal.Chim.Acta 2000, 406, 37-52. 20. Cech, N. B.; Enke, C. G. Anal.Chem. 2000, 72, 2717-23.
21. Sjöberg, P. J. R.; Bökman, C. F.; Bylund, D.; Markides, K. E. Anal.Chem. 2001, 73, 23-28.
19 22. Sjoberg, P. J. R.; Bokman, C. F.; Bylund, D.; Markides, K. E. J.Am.Soc.Mass Spectrom. 2001, 12, 1002-10.
23. Sherman, C. L.; Brodbelt, J. S. Anal.Chem. 2003, 75, 1828-36. 24. Sherman, C. L.; Brodbelt, J. S. Anal.Chem. 2005, 77, 2512-23.
25. Zhu, M. M.; Chitta, R.; Gross, M. L. Int.J.Mass Spectrom. 2005, 240, 213-20. 26. Xiao, H.; Kaltashov, I. A.; Eyles, S. J. J.Am.Soc.Mass Spectrom. 2003, 14, 506-15. 27. Young, D.-S.; Hung, H.-Y.; Liu, L. K. J.Mass Spectrom. 1997, 32, 432-37.
28. Ayed, A.; Krutchinsky, A. N.; Ens, W.; Standing, K. G.; Duckworth, D. C. Rapid Commun.Mass Spectrom. 1998, 12, 339-44.
29. Gabelica, V.; Galic, N.; Rosu, F.; Houssier, C.; De Pauw, E. J.Mass Spectrom. 2003, 38, 491-501.
30. Tjernberg, A.; Carno, S.; Oliv, F.; Benkestock, K.; Edlund, P. O.; Griffiths, W. J.; Hallen, D. Anal.Chem. 2004, 76, 4325-31.
31. Mathur, S.; Badertscher, M.; Scott, M.; Zenobi, R. Phys.Chem.Chem.Phys. 2007, 9, 6187-98.
32. Jecklin, M. C.; Touboul, D.; Jain, R.; Toole, E. N.; Tallarico, J.; Drueckes, P.; Ramage, P.; Zenobi, R. Anal.Chem. 2009, 81, 408-19.
33. Kempen, E. C.; Brodbelt, J. S. Anal.Chem. 2000, 72, 5411-16.
34. Wortmann, A.; Rossi, F.; Lelais, G.; Zenobi, R. J.Mass Spectrom. 2005, 40, 777-84. 35. Wortmann, A.; Jecklin, M. C.; Touboul, D.; Badertscher, M.; Zenobi, R. J.Mass Spectrom. 2008, 43, 600-08.
20 36. Chitta, R. K.; Rempel, D. L.; Gross, M. L. J.Am.Soc.Mass Spectrom. 2005, 16, 1031-38. 37. Wilcox, J. M.; Rempel, D. L.; Gross, M. L. Anal.Chem. 2008, 80, 2365-71.
38. Gabelica, V.; De Pauw, E.; Rosu, F. J.Mass Spectrom. 1999, 34, 1328-37. 39. Rosu, F.; De Pauw, E.; Gabelica, V. Biochimie 2008, 90, 1074-87.
40. Rosu, F.; Gabelica, V.; Shin-ya, K.; De Pauw, E. Chem.Commun. 2003, 2702-03. 41. Frycak, P.; Schug, K. A. Anal.Chem. 2007, 79, 5407-13.
42. Frycak, P.; Schug, K. A. Anal.Chem. 2008, 80, 1385-93.
43. Kuprowski, M. C.; Konermann, L. Anal.Chem. 2007, 79, 2499-506.
44. Kuprowski, M. C.; Boys, B. L.; Konermann, L. J.Am.Soc.Mass Spectrom. 2007, 18, 1279-85.
21 TABLES
Table 1. Relative response factors of the internal standard dT62- (noted “T”), the duplex
[(dCGCGAATTCGCG)2]5- (noted “DNA”) and its complex [(dCGCGAATTCGCG)2+Hoechst33258]
5-(noted “DNA+L”). [DNA]tot (=
[dT6]tot)
RF Lens 1 (V) Peaks considered
DNA T R R L DNA T R R DNA L DNA R R
0.5 µM 100 V Only desolvated ion peak 3.12 3.72 0.84
desolvated ion peak + 2 adducts 1.14 1.39 0.82
120 V Only desolvated ion peak 2.26 3.35 0.67
desolvated ion peak + 2 adducts 0.91 1.37 0.66
140 V Only desolvated ion peak 1.42 2.36 0.60
desolvated ion peak + 2 adducts 0.75 1.11 0.68
5 µM 100 V Only desolvated ion peak 5.25 5.88 0.89
desolvated ion peak + 2 adducts 1.73 1.94 0.89
120 V Only desolvated ion peak 3.80 4.61 0.82
desolvated ion peak + 2 adducts 1.42 1.61 0.88
140 V Only desolvated ion peak 2.40 2.88 0.83
22 Table 2. Relative response factors found for the free duplex and the complexes with n ligands (Rn =
R(T62-)/R([DNA+n]5-), at three different source RF Lens 1 voltages. The ratio between the response of
the complex and the response of the free DNA is given in parentheses.
100 V 120 V 140 V R0a 1.67 1.35 0.84 R1 (R1/R0) 1.44 (0.86) 1.46 (1.08) 1.06 (1.26) R2 (R2/R0) 1.30 (0.78) 1.04 (0.77) 0.88 (1.05) R3 (R3/R0) 1.82 (1.09) 0.83 (0.61) 0.83 (0.99) R4 (R4/R0) 3.17 (1.90) 2.08 (1.54) 1.89 (2.25) R56b (R56/R0) 4.02 (2.41) 4.25 (3.14) 2.05 (2.44) a mean of the two R0 values found from the mass balance equations (13) and (14). b R5 and R6 cannot be calculated separately.
23 Table 3. Sequential equilibrium dissociation constants calculated for the complexes DNA+n (n = 1 to 6 ethidium ligands), taking into account the response factors from Table 2, at three different source RF Lens 1 voltages. 100 V 120 V 140 V Average -log Kd1 5.67 5.79 5.95 5.80 ± 0.08 -log Kd2 5.36 5.28 5.40 5.35 ± 0.04 -log Kd3 5.38 5.12 5.22 5.24 ± 0.08 -log Kd4 5.29 5.41 5.36 5.35 ± 0.04 -log Kd5 4.91 5.14 4.83 4.96 ± 0.09 -log Kd6 4.64 4.82 4.66 4.71 ± 0.06
24 Table 4. Summary of the kinetics experiments: relative response factors, and results of the fitting of the kinetics data using Equation (18), with standard error.
RFLens Charge states
G T R R GC T R R a (µM) b (µM) k (min-1) r² 150 V G5-/4- - GC8-6- 1.001 1.204 -0.76 ± 0.06 5.80 ± 0.06 0.322 ± 0.004 0.9884 150 V G5- - GC7- 1.434 1.406 -0.72 ± 0.06 5.73 ± 0.05 0.339 ± 0.004 0.9909 175 V G5-/4- - GC8-6- 0.716 1.328 -0.38 ± 0.09 5.37 ± 0.08 0.335 ± 0.005 0.9880 175 V G5- - GC7- 1.147 1.863 -0.16 ± 0.08 5.13 ± 0.07 0.335 ± 0.005 0.9886 200 V G5-/4- - GC8-6- 0.693 1.044 -0.67 ± 0.05 5.64 ± 0.05 0.315 ± 0.003 0.9941 200 V G5- - GC7- 1.180 1.537 0.21 ± 0.05 4.74 ± 0.04 0.311 ± 0.004 0.9928
25 FIGURES
Figure 1. Electrospray mass spectra of a mixture of 500 nM dT6, 500 nM duplex
(dCGCGAATTCGCG)2, and 600 nM ligand Hoechst 33258, recorded at difference source RF Lens 1
voltages: (a) 140 V, (b) 120 V, (c) 100 V. Peak annotation: DNA = double-stranded DNA (synonym of duplex); ss = single strand dCGCGAATTCGCG; DNA+L = double strand DNA + one ligand Hoechst 33258. Note the two-fold magnification in the m/z range [1150-1800].
26 Figure 2. Intensity of DNA+n (double stranded DNA complexes with n ethidium ligands, n = 0-6, charge state 5-, fully desolvated ion peak) divided by the intensity of the internal standard (dT62-), as a
27 Figure 3. Formation of duplex GC between 11.9 µM strand C (dCCC(AATCCC)3) and 5 µM strand G
(dGGG(TTAGGG)3), in the presence of 2.7 µM strand dT6: sum of spectra acquired between 2.6 min
and 15.6 min at three different RF Lens 1 voltages (a) 200 V, (b) 175 V, (c) 150 V. Note the two-fold magnification in the m/z range [1000-2300].
28 Figure 4. Kinetics of duplex formation. (a) Without internal standard: percentage of duplex intensity versus total (duplex + G-quadruplex) intensity, in experiments conducted at different voltages and using two different data processing (using all detected charge states or using the major charge states G5- and