HAL Id: hal-00301388
https://hal.archives-ouvertes.fr/hal-00301388
Submitted on 20 Aug 2004HAL is a multi-disciplinary open access
archive for the deposit and dissemination of sci-entific research documents, whether they are pub-lished or not. The documents may come from teaching and research institutions in France or abroad, or from public or private research centers.
L’archive ouverte pluridisciplinaire HAL, est destinée au dépôt et à la diffusion de documents scientifiques de niveau recherche, publiés ou non, émanant des établissements d’enseignement et de recherche français ou étrangers, des laboratoires publics ou privés.
Influence of mountain waves and NAT nucleation
mechanisms on Polar Stratospheric Cloud formation at
local and synoptic scales during the 1999?2000 Arctic
winter
S. H. Svendsen, N. Larsen, B. Knudsen, S. D. Eckermann, E. V. Browell
To cite this version:
S. H. Svendsen, N. Larsen, B. Knudsen, S. D. Eckermann, E. V. Browell. Influence of mountain waves and NAT nucleation mechanisms on Polar Stratospheric Cloud formation at local and synoptic scales during the 1999?2000 Arctic winter. Atmospheric Chemistry and Physics Discussions, European Geosciences Union, 2004, 4 (4), pp.4581-4609. �hal-00301388�
ACPD
4, 4581–4609, 2004
Influence of mountain waves and
NAT nucleation on PSC formation S. H. Svendsen et al. Title Page Abstract Introduction Conclusions References Tables Figures J I J I Back Close
Full Screen / Esc
Print Version Interactive Discussion
© EGU 2004 Atmos. Chem. Phys. Discuss., 4, 4581–4609, 2004
www.atmos-chem-phys.org/acpd/4/4581/ SRef-ID: 1680-7375/acpd/2004-4-4581 © European Geosciences Union 2004
Atmospheric Chemistry and Physics Discussions
Influence of mountain waves and NAT
nucleation mechanisms on Polar
Stratospheric Cloud formation at local
and synoptic scales during the 1999–2000
Arctic winter
S. H. Svendsen1, N. Larsen1, B. Knudsen1, S. D. Eckermann2, and E. V. Browell3
1
Danish Meteorological Institute, Copenhagen, Denmark 2
Naval Research Laboratory, Washington DC, USA 3
NASA Langley Research Center, Hampton, Virginia, USA
Received: 30 June 2004 – Accepted: 8 July 2004 – Published: 20 August 2004 Correspondence to: S. H. Svendsen ([email protected])
ACPD
4, 4581–4609, 2004
Influence of mountain waves and
NAT nucleation on PSC formation S. H. Svendsen et al. Title Page Abstract Introduction Conclusions References Tables Figures J I J I Back Close
Full Screen / Esc
Print Version Interactive Discussion
© EGU 2004
Abstract
A scheme for introducing mountain wave-induced temperature pertubations in a mi-crophysical PSC model has been developed. A data set of temperature fluctuations attributable to mountain waves as computed by the Mountain Wave Forecast Model (MWFM-2) has been used for the study. The PSC model has variable microphysics,
5
enabling different nucleation mechanisms for nitric acid trihydrate, NAT, to be employed. In particular, the difference between the formation of NAT and ice particles in a sce-nario where NAT formation is not dependent on preexisting ice particles, allowing NAT to form at temperatures above the ice frost point, Ti ce, and a scenario, where NAT nu-cleation is dependent on preexisting ice particles, is examined. The performance of
10
the microphysical model in the different microphysical scenarios and a number of tem-perature scenarios with and without the influence of mountain waves is tested through comparisons with lidar measurements of PSCs made from the NASA DC-8 on 23 and 25 January during the SOLVE/THESEO 2000 campaign in the 1999–2000 winter and the effect of mountain waves on local PSC production is evaluated in the different
mi-15
crophysical scenarios. Mountain wave-induced temperature fluctuations are introduced in vortex-covering model runs, extending the full 1999–2000 winter season, and the ef-fect of mountain waves on large-scale PSC production is estimated in the different microphysical scenarios.
1. Introduction
20
Polar stratospheric clouds (PSCs) are known to be of vital importance to ozone-depleting processes in the polar regions (Tolbert and Toon, 2001). In particular, the formation of solid PSC particles (ice and nitric acid trihydrate (NAT) particles) is im-portant since these particles may grow large enough for gravitational sedimentation to have an impact, thereby depleting the stratosphere of water and nitrogen compounds.
25
ACPD
4, 4581–4609, 2004
Influence of mountain waves and
NAT nucleation on PSC formation S. H. Svendsen et al. Title Page Abstract Introduction Conclusions References Tables Figures J I J I Back Close
Full Screen / Esc
Print Version Interactive Discussion
© EGU 2004 (WMO,1999).
In the northern polar stratosphere synoptic temperatures usually hover around the existence temperature for NAT (WMO, 1999). Consequently, the additional cooling caused by mountain waves may be of importance to the production of solid PSC types in the northern polar vortex. Mountain waves are known to cause the formation of solid
5
PSC types (Carslaw et al., 1998a,b) and the locally produced solid PSCs may exist at vast distances downstream (Carslaw et al., 1999). In order to be able to produce reasonable estimates of the load of solid type PSCs in the Arctic, it is therefore impor-tant to be able to evaluate the amount of PSCs produced in mountain waves compared to the amount of synoptically produced PSCs. In the present study, a method for
in-10
corporating mountain wave effects in microphysical PSC simulations on local as well as synoptic scales has been developed, thereby allowing for an estimate of the impor-tance of mountain wave effects on the PSC load. In Sect.2the microphysical model used for this study is presented and the method for including mountain wave effects in the simulations is introduced in Sect.2.1. Next, comparisons between lidar
mea-15
surements of PSCs and model runs with and without mountain waves are presented in Sect.3. Finally, in Sect. 4the influence of mountain waves on the production of solid PSCs inside the vortex is evaluated for the winter 1999–2000.
2. The Microphysical model
Simulations of the PSC production have been made using the Danish Meteorological
20
Institute microphysical PSC model (Larsen,1991,2000). The core of the PSC model is a box model which for a given time step calculates the changes in size distributions, chemical composition, and physical phase of an ensemble of particle types. The in-put to the box model at each time step is the temperature, pressure, partial pressures of H2O and HNO3, the current number densities, and the amount of bound acid and
25
water in each size bin of the different aerosol types, and the box model returns new values of these parameters in each size bin. Mixtures of four different particle types
ACPD
4, 4581–4609, 2004
Influence of mountain waves and
NAT nucleation on PSC formation S. H. Svendsen et al. Title Page Abstract Introduction Conclusions References Tables Figures J I J I Back Close
Full Screen / Esc
Print Version Interactive Discussion
© EGU 2004 are recognised by the model: 1) Liquid particles assumed to be sulphate aerosols
turning into supercooled ternary H2O-H2SO4-HNO3 solutions (STS) at low tempera-tures through uptake of HNO3 and H2O. 2) Frozen sulphate aerosols assumed to be sulphuric acid tetrahydrate, SAT. 3) NAT particles with inclusions of SAT and 4) ice particles with inclusions of NAT and SAT. Each of the four different particle types has
5
its own size distribution. The size distributions are discretized into N size bins on a geometric volume scale. Within a given size distribution particles are shifted to higher or lower radius bins through vapour deposition and evaporation. When phase transi-tions occur (e.g. all NAT evaporating to form a SAT particle) particles are transferred from one size distribution to another. During this transfer the particles are assumed
10
to have an unaltered radius. When calculating the evaporation and condensational growth of liquid, NAT, and ice particles, vapour pressures over STS are taken fromLuo et al. (1995), vapour pressures over NAT are taken from Hanson and Mauersberger (1988), and vapour pressures over ice are taken fromMarti and Mauersberger(1993). Ice particles form by homogeneous nucleation out of STS solutions at temperatures
15
3–4 K below the ice frost point, Ti ce, and a homogeneous nucleation rate, derived from experimental data, is used in the simulations (Koop et al.,2000).
Recently, studies have been published indicating the need for a freezing process ac-tive above Ti ce in order to explain observations of solid PSC particles (Drdla et al., 2002; Pagan et al., 2004). As an example of a NAT nucleation mechanism capable
20
of generating NAT at temperatures above the ice frost point, NAT nucleation in the present study is described by the nucleation rate of nitric acid dihydrate, NAD, found inTabazadeh et al.(2002) (assuming an instantaneous conversion of NAD particles to NAT), although corrected by a factor of 0.1 in order to comply with restrictions posed by observations of particle size distributions and gas phase mixing ratios of HNO3
accord-25
ing to the findings inLarsen et al.(2004). Whether this particular nucleation mechanism alone is responsible for any NAT formation at temperatures above Ti ceor whether other nucleation mechanisms, e.g. heterogeneous nucleation (Drdla et al.,2002), are active cannot be concluded from the present study, which only addresses the effect of a
sin-ACPD
4, 4581–4609, 2004
Influence of mountain waves and
NAT nucleation on PSC formation S. H. Svendsen et al. Title Page Abstract Introduction Conclusions References Tables Figures J I J I Back Close
Full Screen / Esc
Print Version Interactive Discussion
© EGU 2004 gle proposed nucleation mechanism for NAT which is active above Ti ceas compared to
a scenario where NAT formation requires the presence of ice particles. Note that the choice of nucleation mechanism for NAT will affect the formation of ice particles. If NAT can form at temperatures above the ice frost point, ice may nucleate heterogeneously on preexisting NAT particles as soon as temperatures drop slightly below Ti ce instead
5
of only forming by homogeneous nucleation at temperatures 3–4 K below Ti ce.
The model calculates the backscatter ratio and depolarisation at 603 nm based on a T-matrix calculation code byMishchenko and Travis(1998). A number of assumptions about the shape of the particles and their refractive indices are made and the calculated backscatter ratio and depolarisation are rather sensitive to the choice of these
param-10
eters. Hence, the calculated optical variables are only suited for general qualitative comparisons with the measured data and not for detailed, quantitative comparisons. In the simulations, refractive indices are set to 1.55 for STS (Adriani et al.,2004), 1.51 for NAT (Deshler et al.,2000), and 1.31 (Chemical Rubber Company,1970) for ice. The particles are assumed to be spheroids with aspect ratios of 1.0 for STS and 1.05 for
15
the solid particle types (Carslaw et al.,1998a).
The model is initialised by profiles of HNO3and H2O and a background population of sulphuric aerosols. The size distribution of the sulphuric aerosols is based on a SAGE I and SAGE II (Stratospheric Aerosol and Gas Experiment) surface area climatology (Hitchman et al.,1994). The HNO3 content is initialised by a LIMS profile (Gille and
20
Russell,1984) and the H2O content is described as a function of the potential temper-ature,Θ, based on a series of frost point hygrometer measurements in the northern polar vortex (Ovarlez et al.,2004).
The input to the model is provided by temperature trajectories based on ECMWF analyses. The calculation of the trajectories uses 6 hourly ECMWF analyses on a
25
1.5◦×1.5◦ longitude-latitude grid. The trajectories themselves are calculated on an equal-area grid with a grid distance of 139 km and start inside or at the edge of the polar vortex at 9 standard isentropic levels (360 K, 380 K, 400 K, 435 K, 475 K, 515 K, 550 K, 600 K, and 650 K) in the case of the hemispheric simulations and on 11 levels
ACPD
4, 4581–4609, 2004
Influence of mountain waves and
NAT nucleation on PSC formation S. H. Svendsen et al. Title Page Abstract Introduction Conclusions References Tables Figures J I J I Back Close
Full Screen / Esc
Print Version Interactive Discussion
© EGU 2004 (400 K, 425 K, 450 K, 475 K, 500 K, 530 K, 560 K, 590 K, 600 K, 625 K, and 700 K) in
the case of the small-scale simulations. Diabatic cooling is taken into account in the calculations (Morcrette, 1991; Knudsen and Grooss, 2000; Larsen et al., 2002). At each point of a trajectory the temperature, pressure, potential temperature, potential vorticity, latitude, and longitude are given. Depending on the number of trajectories
5
and their duration, microphysical simulations on a variety of scales may be performed; from very detailed model runs closely matching the time and location of different sets of measurements to vortex-covering simulations extending over entire winter seasons. 2.1. Including mountain wave effects in the simulations
Temperature fluctuations due to mountain waves may influence the formation of solid
10
type PSCs (Carslaw et al., 1998a). Climatological studies of the stratosphere over Scandinavia have shown that practically all ice particle events in this area are at-tributable to the presence of mountain waves (D ¨ornbrack and Leutbecher,2001). In order to obtain reliable estimates of the PSC load, the inclusion of mountain wave effects in the modelling of PSCs is crucial. ECMWF reanalyses lack sufficient
res-15
olution to resolve the full spectrum of mesoscale mountain waves that occur in the stratosphere. To provide estimates of mountain wave influences on the PSC load, mesoscale temperature variances from hindcast runs using Version 2 of the Naval Re-search Laboratory Mountain Wave Forecast Model (MWFM-2) through global analysis fields issued by NASA’s Global Modeling and Analysis Office (GMAO) during the
Arc-20
tic winter of 1999–2000 are used to supplement the ECMWF temperature trajectories. Details of the MWFM-2 algorithms are given byEckermann and Preusse(1999), Hert-zog et al. (2002) andJiang et al.(2004). These fields are issued as averaged gridded wave-induced temperature variance fields on pressure surfaces, derived from the raw mountain wave ray data generated by the hindcasts, to make them more amenable
25
for use in offline transport simulations. The formation and use of this 1999–2000 grid-ded product is described in detail byPierce et al.(2003) and Pagan et al.(2004). An important point to note is that the procedure of avaraging into a gridded variance
prod-ACPD
4, 4581–4609, 2004
Influence of mountain waves and
NAT nucleation on PSC formation S. H. Svendsen et al. Title Page Abstract Introduction Conclusions References Tables Figures J I J I Back Close
Full Screen / Esc
Print Version Interactive Discussion
© EGU 2004 uct tends to significantly suppress typical intra-gridbox variability found within
unaver-aged mountain wave fields (Hertzog et al.,2002;Brogniez et al., 2003) and thus the data product used in this study should be viewed as a working lower bound on likely mesoscale temperature variability due to mountain waves. Thus, any microphysical changes caused by insertion of these mountain wave fields are likely significant.
5
In this study, the MWFM-2 fields are used to introduce mountain wave-induced tem-perature fluctuations into the simulations. The MWFM-2 hindcasts and averaging pro-duces daily fields of mountain wave-induced temperature fluctuations on a 1◦×1◦grid, specifying the amplitude of the temperature fluctuation and the standard deviation of the temperature amplitude at seven standard pressure levels (10, 20, 30, 40, 50, 70,
10
and 100 hPa). Through interpolations in pressure and time the value of the tempera-ture amplitude and the standard deviation of the temperatempera-ture amplitude are found at the nearest grid point of each trajectory position, thereby producing a data base of mountain wave-induced temperature fluctuations at the times and locations of the tra-jectories. When running the microphysical simulations, different temperature scenarios
15
with and without the inclusion of mountain wave effects can be examined: Case 1:
T=T0, Case 2: T=T0−TA, Case 3: T=T0−TA−Tcorr, where T is the temperature used as input in the microphysical simulations, T0is the trajectory temperature according to the ECMWF reanalysis, TAis the mountain wave-induced temperature amplitude, and Tcorr is an additional temperature correction, based on temperature restrictions posed by the
20
presence of ice particles in observations. This additional correction will be described in further detail below. Subtraction of the amplitude of the mountain wave perturbation in cases 2 and 3 corresponds to the maximal lowering of the temperatures and one should therefore interpret these results as lower limits of the temperature.
3. Comparing model runs and lidar measurements
25
Given the high altitude and time resolution of lidar measurements, very detailed infor-mation about the observed aerosols can be provided by such measurements. In order
ACPD
4, 4581–4609, 2004
Influence of mountain waves and
NAT nucleation on PSC formation S. H. Svendsen et al. Title Page Abstract Introduction Conclusions References Tables Figures J I J I Back Close
Full Screen / Esc
Print Version Interactive Discussion
© EGU 2004 to make comparisons between observations and model results, it is important to
en-sure that the model results closely match the time and location of the meaen-surements. In the present study, lidar data from the NASA DC-8 flights of 23 and 25 January 2000, during the SOLVE/THESEO 2000 campaign have been considered. A summary of the campaign can be found in Newman et al. (2002). A description of the lidar system
5
used for the measurements can be found inBrowell(1989) andBrowell et al.(1990). Sets of back trajectories have been initiated along the flight tracks. Running these tra-jectories produces information about the aerosol at the position and time of the lidar measurements according to the microphysical model.
The presence of ice particles in the observations poses restrictions on the
temper-10
atures. In areas where ice is observed, the temperature must necessarily be equal to or colder than the ice frost point, Ti ce. Aerosol backscatter ratios at 603 nm greater than 5.0 with enhanced depolarisation (>2.5%) are considered to be ice particles in the DC-8 data. By keeping track of the times and altitudes where ice particles are observed, one may compare the model temperatures in these areas to Ti ce. The ice
15
correction Tcorris determined as the average difference between the trajectory temper-ature and Ti cein those areas where ice particles are observed. It is assumed that the additional temperature correction is associated with an under-estimation of the moun-tain wave-induced temperature fluctuations and Tcorris only introduced if the mountain wave-induced temperature amplitude TA exceeds a value of 0.5 K. The value of Tcorr
20
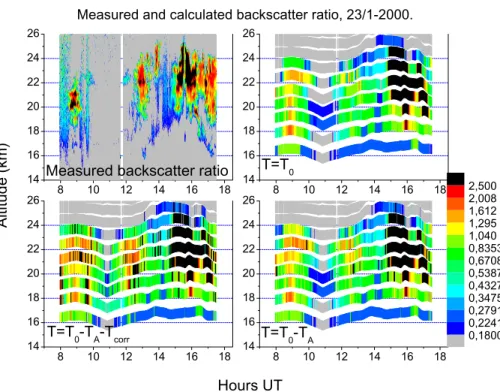
is found to be 1.16 K for 23 January 2000, and 3.70 K for 25 January 2000. Compar-isons of the measured and calculated backscatter ratio and depolaristion at 603 nm for the three different temperature scenarios are shown in Figs. 1 and 2 for 23 January 2000, whereas Figs.3and4show the measured and calculated backscatter ratio and depolarisation at 603 nm for 25 January 2000. NAT nucleation above Ti ce has been
25
included in the simulations. In the figures, the upper left panel shows the measure-ment data. The upper right panel shows model results from the T=T0 scenario, the lower right panel shows the results from the T=T0−TAscenario and the results from the
con-ACPD
4, 4581–4609, 2004
Influence of mountain waves and
NAT nucleation on PSC formation S. H. Svendsen et al. Title Page Abstract Introduction Conclusions References Tables Figures J I J I Back Close
Full Screen / Esc
Print Version Interactive Discussion
© EGU 2004 sidered here, changes can be seen in the calculated backscatter ratio as well as the
depolarisation when the effect of mountain waves is taken into consideration. Consid-ering the backscatter ratios one can see that the model reproduces the various fields of aerosols seen in the observations. Including the effect of mountain waves increases the peak values as well as the spatial spread of the backscatter ratio, indicating larger
5
aerosol formation in these cases. In particular, the changes in the depolarisation are of interest since such changes can be directly linked to changes in the amount of solid particles present in the model. When considering the backscatter ratio and de-polarisation the inclusion of the effect of mountain waves apparently produces a better correspondence between the observed and the calculated quantities.
10
It is possible to make a quantitative comparison of the amount of solid particles produced by the model and the amount of solid particles found in the observations. In the case of the observations, type distinction is made by considering the backscatter ratio and the depolarisation. Such a type distinction is only possible when both the backscatter ratio and the depolarisation are available and, hence, the type of statistics
15
presented here only represents the areas where both types of data are present. Points where the backscatter ratio B lies in the interval 0.18≤B≤5.0 and the depolarisation D is larger than 2.5% are classified as type 1a PSCs whereas points where 5.0<B and 2.5%<D are classified as type 2 PSCs and points where the depolarisation is smaller than 2.5% and the backscatter ratio is higher than 0.18 (0.18<B and D<2.5%) are
20
considered to be type 1b PSCs. A data point is classified as containing NAT or ice as soon as the lidar data indicates the mere presence of type 1a or 2 PSCs and does not take into account whether or not the solid particles actually dominate the probed air mass. Liquid particles may thus be present as well in points classified as either NAT or ice. The percentages of data points containing solid particles according to this
25
classification scheme should therefore be considered an upper limit of the solid particle presence in the probed air mass.
In order to be able to compare model data and observations, it is necessary to isolate the areas in the model data which correspond to the sections of the observations where
ACPD
4, 4581–4609, 2004
Influence of mountain waves and
NAT nucleation on PSC formation S. H. Svendsen et al. Title Page Abstract Introduction Conclusions References Tables Figures J I J I Back Close
Full Screen / Esc
Print Version Interactive Discussion
© EGU 2004 both backscatter ratios and depolarisations are available. For these sections of the
model data it is investigated whether or not any solid PSC particles are present and the percentage of model points containing either NAT or ice particles can be determined. A model data point is said to contain ice or NAT if the volume density of the given particle type is larger than zero. Again, this classification scheme does not address
5
the question of which particle type (liquid or solid) actually dominates the profile, it merely provides an upper limit to the amount of NAT and ice particles produced in the simulation, in agreement with the classification scheme used for the observational data. The percentage of ice and NAT in the observational data (red columns) and in the simulations is shown in Figs.5and6for 23 January 2000, and in Figs.7and8for
10
25 January 2000. In the figures, the percentages of NAT and ice particles in the model data are determined for two sets of model data: one where NAT nucleation above
Ti ce is allowed as described earlier in this paper (blue columns), and one where NAT nucleation above Ti ceis not allowed (green columns). In the latter case, NAT forms on preexisting ice particles.
15
For both 23 and 25 January 2000, the percentage of NAT particles in the model data shows the best correspondence with the measurements when NAT nucleation above Ti ceis included (see Figs.5 and7) than when this is not the case. When NAT nucleation above Ti ce is included in the microphysics the percentage of NAT in the model data is comparable to the percentage of NAT in the observations whereas the
20
percentage of NAT in the case where NAT nucleation above Ti ce is not included is much smaller than the observed values. In the case of the NAT particles, the influence of mountain waves does not seem to be very large in the case where NAT nucleation above Ti ceis included; only small changes are seen in the NAT percentage when going from one temperature scenario to another. For both the days considered here, the
25
synoptic temperatures alone were sufficient to generate the majority of the observed NAT particles and in such cold cases where the synoptic temperatures already are below TNAT any additional mountain wave cooling will not cause any large changes. In other cases, where the synoptic temperatures are warmer, mountain wave cooling may
ACPD
4, 4581–4609, 2004
Influence of mountain waves and
NAT nucleation on PSC formation S. H. Svendsen et al. Title Page Abstract Introduction Conclusions References Tables Figures J I J I Back Close
Full Screen / Esc
Print Version Interactive Discussion
© EGU 2004 have a larger influence on the amount of NAT particles.
In a recent study it was established that NAT observations from the early part of the winter 1999–2000 could not be explained by the presence of mountain waves and that some NAT nucleation mechanism active above the ice frost point was necessary in order to explain the observations (Pagan et al.,2004). The present work supports
5
this conclusion since, even in the presence of mountain waves, the amount of NAT particles produced when there is no NAT nucleation above Ti cedoes not correspond to the amount of NAT particles seen in observations. When NAT nucleation above Ti ceis active a better correspondence between observational data and model data is seen.
In the case of the ice particles, the influence of mountain waves is much larger,
10
see Figs. 6 and 8. In this case, practically no ice particles are seen in the model data when the synoptic temperatures alone are taken into consideration, regardless of the choice of microphysics. This is in agreement with the findings of D ¨ornbrack and Leutbecher (2001), where a climatological study indicated an almost complete dependence on mountain waves for the ice particle production over Scandinavia. When
15
mountain wave effects are included ice particles are seen in the model data, although the percentage of ice in the intermediate mountain wave scenario is very small in the case where NAT nucleation above Ti ceis included and no ice particles are seen at all in the case where NAT nucleation above Ti ceis not included. In the strongest mountain wave scenario (T=T0−TA−Tcorr) there is a significant increase in the percentage of ice
20
particles in the case where NAT nucleation above Ti ce is included. In the case of 23 January 2000, the percentage of ice particles in this scenario is comparable to the observed percentage of ice particles, whereas for 25 January 2000, the percentage of ice particles in the model data is too high. When NAT nucleation above Ti ceis not included only very little ice is seen in the case of 23 January 2000, and in the case of 25
25
January 2000, the percentage of ice particles is larger than the observed percentage. The fact that the model overestimates the percentage of ice particles on 25 January 2000, regardless of the choice of microphysics, may be an indication that the value of
ACPD
4, 4581–4609, 2004
Influence of mountain waves and
NAT nucleation on PSC formation S. H. Svendsen et al. Title Page Abstract Introduction Conclusions References Tables Figures J I J I Back Close
Full Screen / Esc
Print Version Interactive Discussion
© EGU 2004 on the percentage of ice particles is not surprising; when NAT particles are present, ice
may nucleate heterogeneously as soon as small supersaturations with respect to ice occur, whereas much larger supersaturations are needed in order for homogeneous nucleation of ice particles to take place. Overall, the correspondence between the percentage of ice particles in the model data and in the observations seems to be best
5
when NAT nucleation above Ti ce is taken into consideration, as was the case for the NAT particles. However, in the case of the ice particles, the impact of mountain waves is much larger compared to the NAT particles. Ice particles seem to form exclusively as a consequence of mountain wave effects, regardless of the choice of microphysics.
4. The influence of mountain waves on large-scale PSC production
10
In Sect. 3it was shown that mountain waves may have a significant influence on the amount of ice particles and that the inclusion of mountain wave effects was necessary in order to be able to produce amounts of ice PSC events comparable to those seen in lidar observations. In addition, it was seen that including a NAT nucleation mechanism which is active above Ti ce in the simulations resulted in a better correspondence
be-15
tween the amount of NAT and ice particles in the observations and the model output. The apparent importance of mountain waves on ice PSC production and of the choice of NAT nucleation mechanism on production of NAT and ice on local scales naturally leads to the question of the influence of mountain waves and NAT nucleation above Ti ce on large-scale PSC production. In order to address this issue vortex-covering model
20
runs extending from 15 November 1999 to 15 March 2000, have been made. A set of 19 140 trajectories, distributed over 9 isentropic levels, is initiated on 11 January 2000, and calculated backwards and forwards in time, thereby covering the entire winter sea-son. The model is run for three different temperature scenarios, one unperturbed by mountain waves and two with increasingly stronger mountain wave corrections as
de-25
scribed in Sect.2.1. In the case of the hemispheric simulation, a direct estimate of Tcorr is not possible and instead, an average of the two values found for 23 and 25 January
ACPD
4, 4581–4609, 2004
Influence of mountain waves and
NAT nucleation on PSC formation S. H. Svendsen et al. Title Page Abstract Introduction Conclusions References Tables Figures J I J I Back Close
Full Screen / Esc
Print Version Interactive Discussion
© EGU 2004 2000, is used (Tcorr=2.4 in the hemispheric runs). Two microphysical scenarios are
tested as well, one where NAT nucleation above Ti ceis included and one where this is not the case.
Initially, the influence of mountain waves on the temperatures is examined by analysing the trajectory data and determining the percentage of the trajectories where
5
the temperature drops below either TNAT or Ti ce as a function of day number. This provides an estimate of the amount of trajectories where NAT or ice particles can pos-sibly exist. In Fig. 9 these percentages are shown for three different model layers. An ample amount of trajectories is seen to have temperatures below TNAT even with-out the presence of mountain waves. However, the percentage of trajectories where
10
T <TNAT increases as mountain wave effects are taken into consideration, with the high-est trajectory frequencies adhering to the stronghigh-est possible temperature perturbation (T=T0−TA−Tcorr). In the case of trajectories where T <Ti ce only a small amount of trajectories fulfills this criterion when mountain wave effects are not taken into consid-eration. In this case, temperatures below Ti ceare only observed briefly just before day
15
0 and just before day 30 and 40. When mountain wave-induced temperature fluctua-tions are included the number of trajectories where T <Ti ceincreases and temperatures below Ti ceare seen over extended periods of time during the winter season, although the numbers typically are small (<0.5%), with the highest values reaching around 4%. Again, the highest trajectory frequencies are observed in the case where the strongest
20
possible temperature perturbation is employed. As mentioned earlier, these results can only provide an estimate of the possible existence of NAT and ice particles. In order to evaluate the actual load of NAT and ice particles one must examine the outcome of the full microphysical simulation.
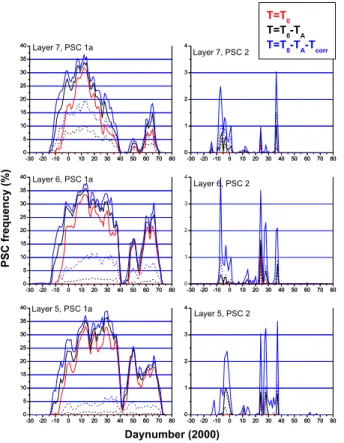
The percentage of trajectories containing NAT or ice particles within the polar
vor-25
tex as a function of day number according to the microphysical simulation is shown in Fig. 10. Results are shown for three different temperature scenarios and for two dif-ferent choices of microphysics. In the present analysis, a trajectory is said to contain ice or NAT if the volume density of these particle types exceeds zero. This is a very
ACPD
4, 4581–4609, 2004
Influence of mountain waves and
NAT nucleation on PSC formation S. H. Svendsen et al. Title Page Abstract Introduction Conclusions References Tables Figures J I J I Back Close
Full Screen / Esc
Print Version Interactive Discussion
© EGU 2004 liberal definition of the presence of ice or NAT. However, it is consistent with the criteria
chosen for the particle type specification used in the comparison of the DC-8 measure-ments and the local-scale model runs. In the case of NAT, it is seen that NAT forms readily as a consequence of the synoptic conditions alone when NAT nucleation above
Ti ce is allowed (solid curves). When this is not the case no NAT particles are seen
5
(dotted curves). When mountain wave effects are included the period during which NAT particles are seen starts earlier in the winter compared to the case where moun-tain wave effects were not included. In the cases where mountain wave effects are taken into account NAT is readily seen throughout the winter, regardless of the choice of microphysics, although the percentage of trajectories containing NAT is consistently
10
higher in the case where NAT nucleation above Ti ceis included.
The importance of mountain wave effects for NAT formation seems much larger in the hemispheric simulations than in the local ones. This could be because the synoptic temperatures alone are generally well below TNAT in the local scale simulations. If the additional cooling caused by mountain waves is not sufficient to lower the temperatures
15
below Ti ce, the addition of mountain wave effects will not cause many changes. Doing local scale model runs in relatively warmer periods (e.g. the early part of the winter) may reveal a greater impact of mountain waves on NAT formation on local scales as well.
Considering the ice particles it is evident that, regardless of the choice of
micro-20
physics, practically no ice particles form as a consequence of the synoptic conditions alone, as was the case in the local-scale model runs as well. When mountain wave effects are included the percentage of trajectories containing ice particles increases noticeably, and trajectories containing ice particles are observed throughout the winter season. When NAT nucleation above Ti ceis included (solid curves) the percentage is
25
higher than in the case where NAT nucleation above Ti ceis not allowed (dotted curves). These results are in agreement with the findings ofD ¨ornbrack and Leutbecher(2001) who found that practically all ice particle formation over Scandinavia was a conse-quence of mountain wave activity.
ACPD
4, 4581–4609, 2004
Influence of mountain waves and
NAT nucleation on PSC formation S. H. Svendsen et al. Title Page Abstract Introduction Conclusions References Tables Figures J I J I Back Close
Full Screen / Esc
Print Version Interactive Discussion
© EGU 2004 As seen above the effect of localised mountain wave effects may extend beyond their
local scale. In hemispheric model runs where mountain wave effects have been in-cluded NAT particle production is seen to increase and practically all the ice particles produced in the simulations can be directly attributed to the effect of mountain waves.
5. Conclusions
5
Detailed model runs matching lidar measurements from two specific flight days (23 and 25 January 2000) of the NASA DC-8 during SOLVE/THESEO 2000 have been anal-ysed and the correspondence between model data and observational data has been examined. Considering a quantitative analysis of the percentage of data points con-taining ice or NAT particles the correspondence is better when NAT nucleation above
10
Ti ce is allowed than when this is not the case. In the case of the local scale model runs the amount of NAT particles is only slightly affected by the inclusion of mountain wave effects in the simulations, whereas mountain waves have a noticeable impact on the amount of ice particles. In the latter case, the correspondence between measure-ments and model data increases greatly when mountain waves are added. The limited
15
effect of mountain waves on NAT formation in the two sets of examined DC-8 data may be due to the fact that the synoptic temperatures alone are rather low; substantial amounts of NAT are seen as a consequence of the synoptic conditions alone. Any additional cooling is not likely to result in significant changes unless the cooling results in temperatures below Ti ce.
20
In the case of large-scale model runs the effect of mountain waves on the solid particle production within the entire northern polar vortex over the course of the win-ter season 1999–2000 was shown to be quite significant. Practically no ice particles were seen as a consequence of the synoptic conditions alone whereas ice was ob-served in a substantial amount of the trajectories for extended periods over the course
25
of the winter when mountain wave effects were taken into consideration, regardless of the choice of microphysics. However, the case where NAT nucleation above Ti ce
ACPD
4, 4581–4609, 2004
Influence of mountain waves and
NAT nucleation on PSC formation S. H. Svendsen et al. Title Page Abstract Introduction Conclusions References Tables Figures J I J I Back Close
Full Screen / Esc
Print Version Interactive Discussion
© EGU 2004 was included consistently showed a higher percentage of trajectories containing ice
particles. NAT particles were seen to form readily as a consequence of the synoptic conditions alone, however, with the inclusion of mountain wave effects the time period during which NAT particles were present became longer. As was the case with the ice particles, the percentage of trajectories containing NAT particles is greater when
5
NAT nucleation above Ti cewas included than when this was not the case. Considering the hemispheric simulations mountain wave effects seem to have a quite significant influence on the NAT formation, contrary to what was seen in the two local-scale simu-lations matching DC-8 flights examined here. A possible explanation could be that the synoptic temperatures alone were low enough to allow for NAT formation during these
10
two flights. Additional local-scale model runs from relatively warmer flight dates (e.g. early in the winter) could help shed some more light on this.
Given the large effect mountain waves apparently had on ice and NAT formation on hemispheric scales during the winter 1999–2000, the inclusion of mountain waves in models seems important in order to be able to provide accurate estimates of the
15
PSC load within the vortex. It would be most interesting to determine whether or not the impact of mountain waves is as pronounced in other winters as well and such an examination is planned for a future study.
Acknowledgements. Part of this work was carried out as part of the EU-funded research project
MAPSCORE (EVK2-CT-2000-00077). The Danish Research Council (SNF) is gratefully
ac-20
knowledged for financial support. Support of the DC-8 lidar measurements was provided by the NASA Upper Atmospheric Research Program. MWFM-2 runs were partially supported by NASA’s Atmospheric Chemistry and Analysis Program and by the Office of Naval Research.
References
Adriani, A., Cairo, F., Cardillo, F., Viterbini, M., and Di Donfrancesco, G.: Refractive Indices of
25
PSCs, In: Comprehensive Investigations of Polar Stratospheric Aerosols, CIPA Final Report, DMI Scientific Report 04-01, Danish Meteorological Institute, 2004. 4585
ACPD
4, 4581–4609, 2004
Influence of mountain waves and
NAT nucleation on PSC formation S. H. Svendsen et al. Title Page Abstract Introduction Conclusions References Tables Figures J I J I Back Close
Full Screen / Esc
Print Version Interactive Discussion
© EGU 2004 Brogniez, C., Huret, N., Eckermann, S., Rivi `ere, E., Pirre, M., Heman, M., Balois, J.-Y.,
Ver-waerde, C., Larsen, N., and Knudsen, B.: Polar stratospheric cloud microphysical properties measured by the microRADIBAL instrument on 25 January 2000 above Esrange and mod-eling interpretation, J. Geophys. Res., 108, 8332, doi:10.1029/2001JD001017, 2003. 4587
Browell, E.: Differential absorption lidar sensing of ozone, Proceedings of the IEEE, 77, 419–
5
432, 1989. 4588
Browell, E., Butler, C., Ismail, S., Robinette, P., Carter, A., Higdon, N., Toone, O., Schoeberl, M., and Tuck, A.: Airborne Lidar Observations in the Wintertime Arctic stratosphere: Polar Stratospheric Clouds, Geophys. Res. Lett., 17, 385–388, 1990. 4588
Carslaw, K. S., Wirth, M., Tsias, A., Luo, B., D ¨ornbrack, A., Leutbecher, M., Volkert, H., Renger,
10
W., Bacmeister, J., and Peter, T.: Particle microphysics and chemistry in remotely observed mountain polar stratospheric clouds, J. Geophys. Res., 103, 5785–5796, 1998a. 4583,
4585,4586
Carslaw, K. S., Wirth, M., Tsias, A., Luo, B., D ¨ornbrack, A., Leutbecher, M., Volkert, H., Renger, W., Bacmeister, J., Reimer, E., and Peter, T.: Increased stratospheric ozone depletion due to
15
mountain-induced atmospheric waves, Nature, 391, 675–678, 1998b. 4583
Carslaw, K. S., Peter, T., Bacmeister, J., and Eckermann, S.: Widespread solid particle forma-tion by mountain waves in the Arctic stratosphere, J. Geophys. Res., 104, 1827–1836, 1999.
4583
Chemical Rubber Company: Handbook of Chemistry and Physics, 51st Edition, Chemical
Rub-20
ber Company, 1970. 4585
Deshler, T., Nardi, B., Adriani, A., Cairo, F., Hansen, G., Fierli, F., Hauchecorne, A., and Pul-virenti, L.: Determining the index of refraction of polar stratospheric clouds above Andoya (69◦N) by combining size-resolved concentration and optical scattering measurements, J. Geophys. Res., 105, 3943–3954, doi:10.1029/1999JD900469, 2000. 4585
25
D ¨ornbrack, A. and Leutbecher, M.: Relevance of mountain waves for the formation of polar stratospheric clouds over Scandinavia: A 20 year climatology, J. Geophys. Res., 106, 1583– 1593, 2001. 4586,4591,4594
Drdla, K., Schoeberl, M., and Browell, E.: Microphysical modelling of the 1999–2000 Arctic winter: 1. Polar stratospheric clouds, denitrification, and dehydration, J. Geophys. Res., 107,
30
8312, doi:10.1029/2001JD000782, printed 108(D5), 2003, 2002. 4584
Eckermann, S. D. and Preusse, P.: Global Measurements of Stratospheric Mountain Waves from Space, Science, 286, 1534–1537, 1999. 4586
ACPD
4, 4581–4609, 2004
Influence of mountain waves and
NAT nucleation on PSC formation S. H. Svendsen et al. Title Page Abstract Introduction Conclusions References Tables Figures J I J I Back Close
Full Screen / Esc
Print Version Interactive Discussion
© EGU 2004 Gille, J. C. and Russell, J. M.: The Limb Infrared Monitor of the Stratosphere: Experiment
Description, Performance, and Results, J. Geophys. Res., 89, 5125–5140, 1984. 4585
Hanson, D. and Mauersberger, K.: Laboratory studies of the nitric acid tryhydrate: Implications for the south polar stratosphere, Geophys. Res. Lett., 15, 855–858, 1988. 4584
Hertzog, A., Vial, F., D ¨ornbrack, A., Eckermann, S., Knudsen, B., and Pommereau, J.-P.:
5
In situ observations of gravity waves and comparisons with numerical simulations during the SOLVE/THESEO 2000 campaign, J. Geophys. Res., 107, doi:10.1029/2001JD001025, 2002. 4586,4587
Hitchman, M., McKay, M., and Trepte, C.: A climatology of stratospheric aerosol, J. Geophys. Res., 99, 20 689–20 700, doi:10.1029/94JD01525, 1994. 4585
10
Jiang, J., Eckermann, S., Wu, L., and Ma, J.: A search for mountain waves in MLS strato-spheric limb radiance from the Northern Hemisphere: data analysis and global mountain wave modeling, J. Geophys. Res., 109, doi:10.1029/2003JD003974, 2004. 4586
Knudsen, B. and Grooss, J.-U.: Northern mid-latitude stratospheric ozone dilution in spring modeled with simulated mixing, J. Geophys. Res., 105, 6885–6890,
15
doi:10.1029/1999JD901076, 2000. 4586
Koop, T., Luo, B., Tsias, A., and Peter, T.: Water activity as the determinant for homogeneous ice nucleation in aqueous solutions, Nature, 406, 611–614, 2000. 4584
Larsen, N.: Polar Stratospheric Clouds: A Microphysical Simulation Model, Scientific Report 91-2, Danish Meteorological Institute, 1991. 4583
20
Larsen, N.: Polar Stratospheric Clouds, Microphysical and Optical Models, Scientific report 00-06, Danish Meteorological Institute, 2000. 4583
Larsen, N., Knudsen, B., Gauss, M., and Pitari, G.: Aircraft induced effects on Arctic polar stratospheric cloud formation, Meteorologische Zeitschrift, 11, 207–214, 2002. 4586
Larsen, N., Knudsen, B., Svendsen, S., Deshler, T., Rosen, J., Kivi, R., Weisser, C., Schreiner,
25
J., Mauersberger, K., Cairo, F., Ovarlez, J., Oelhaf, H., and Spang, R.: Formation of solid par-ticles in synoptic-scale Arctic PSCs in early winter 2002/2003, Atmos. Chem. Phys. Discuss., 4, 2485–2512, 2004. 4584
Luo, B., Carslaw, K., Peter, T., and Clegg, S.: Vapour pressures of H2SO4/HNO3/HCl/HBr/H2O solutions to low stratospheric temperatures, Geophys. Res. Lett., 22, 247–250, 1995. 4584
30
Marti, J. and Mauersberger, K.: A survey and new measurements of ice vapor pressure at temperatures between 170 and 250 K, Geophys. Res. Lett., 20, 363–366, 1993. 4584
implementa-ACPD
4, 4581–4609, 2004
Influence of mountain waves and
NAT nucleation on PSC formation S. H. Svendsen et al. Title Page Abstract Introduction Conclusions References Tables Figures J I J I Back Close
Full Screen / Esc
Print Version Interactive Discussion
© EGU 2004 tion of the T-matrix method for randomly oriented, rotationally symmetric scatterers, Journal
of Quantum Spectroscopy and Radiative Transfer, 60, 309–324, 1998. 4585
Morcrette, J.-J.: Radiation and cloud radiative properties in the ECMWF operational weather forecast model, J. Geophys. Res., 96, 9121–9132, 1991. 4586
Newman, P. A., Harris, N., Adriani, A., Amanatidis, G., Anderson, J., Braathen, G., Brune, W.,
5
Carslaw, K., Craig, M., DeCola, P., Guirlet, M., Hipskind, S., Kurylo, M., K ¨ullmann, H., Larsen, N., M ´egie, G., Pommereau, J.-P., Poole, L., Schoeberl, M., Stroh, F., Toon, O., Trepte, C., and Van Roozendael, M.: An overview of the SOLVE/THESEO 2000 campaign, J. Geophys. Res., 107, 8259, doi:10.1029/2001JD001303, 2002. 4588
Ovarlez, J., Ovarlez, H., Crespin, J., and Gaubicher, B.: Water vapour measurements in the
10
northern polar vortex, In: Comprehensive Investigations of Polar Stratospheric Aerosols, CIPA Final Report, DMI Scientific Report 04-01, Danish Meteorological Institute, 2004. 4585
Pagan, K., Tabazadeh, A., Drdla, K., Hervig, M., Eckermann, S., Browell, E., Legg, M., and Fos-chi, P.: Observational evidence against mountain-wave generation of ice nuclei as a prereq-uisite for the formation of three solid nitric acid polar stratospheric clouds observed in the
Arc-15
tic in early December 1999, J. Geophys. Res., 109, D04 312, doi:10.1029/2003JD003846, 2004. 4584,4586,4591
Pierce, R., Al-Saadi, J., Fairlie, T., Natarajan, M., Harvey, V., Grose, W., Russel, J., Bevilac-qua, R., Eckermann, S., Fahey, D., Popp, P., Richard, E., Stimpfle, R., Toon, G., Web-ster, C., and Elkins, J.: Large-Scale Chemical Evolution of the Arctic Vortex During the
20
1999–2000 Winter: HALOE/POAM3 Lagrangian Photochemical Modeling for the SAGE III Ozone Loss and Validation Experiment (SOLVE) Campaign, J. Geophys. Res., 108, 8317, doi:10.1029/2001JD001063, 2003. 4586
Tabazadeh, A., Djikaev, Y., Hamill, P., and Reiss, H.: Laboratory Evidence for Surface Nucle-ation of Solid Polar Stratospheric Cloud Particles, J. Phys. Chem. A, 106, 10 238–10 246,
25
2002. 4584
Tolbert, M. A. and Toon, O. B.: Solving the PSC mystery, Science, 292, 61–63, 2001. 4582
WMO: Scientific Assessment of Ozone Depletion: 1998, Global Ozone Research and Monitor-ing Project – Report No. 44, World Metorological Organization, 1999. 4583
ACPD
4, 4581–4609, 2004
Influence of mountain waves and
NAT nucleation on PSC formation S. H. Svendsen et al. Title Page Abstract Introduction Conclusions References Tables Figures J I J I Back Close
Full Screen / Esc
Print Version Interactive Discussion © EGU 2004 8 10 12 14 16 18 14 16 18 20 22 24 26 8 10 12 14 16 18 14 16 18 20 22 24 26 8 10 12 14 16 18 14 16 18 20 22 24 26 8 10 12 14 16 18 14 16 18 20 22 24 26 Altitude (km)
Measured backscatter ratio
Measured and calculated backscatter ratio, 23/1-2000.
T=T0 0,1800 0,2241 0,2791 0,3475 0,4327 0,5387 0,6708 0,8353 1,040 1,295 1,612 2,008 2,500 Hours UT T=T0-TA T=T0-TA-Tcorr
Fig. 1. Measured and calculated backscatter ratio at 603 nm for 23 January 2000. Grey areas in the plots of measured data represent valid data with values less than the minimum threshold value for particle presence whereas white areas indicate lack of valid data. Each panel is labelled as either measurements or model results from one of the three different temperature scenarios.
ACPD
4, 4581–4609, 2004
Influence of mountain waves and
NAT nucleation on PSC formation S. H. Svendsen et al. Title Page Abstract Introduction Conclusions References Tables Figures J I J I Back Close
Full Screen / Esc
Print Version Interactive Discussion © EGU 2004 8 10 12 14 16 18 14 16 18 20 22 24 26 8 10 12 14 16 18 14 16 18 20 22 24 26 8 10 12 14 16 18 14 16 18 20 22 24 26 8 10 12 14 16 18 14 16 18 20 22 24 26
Measured and calculated depolarisation, 23/1-2000.
Measured depolarisation T=T 0 2,500 3,209 4,119 5,287 6,786 8,710 11,18 14,35 18,42 23,64 30,35 38,95 50,00 T=T 0-TA Altitude (km) Hours UT T=T0-TA-Tcorr
Fig. 2. Measured and calculated depolarisation at 603 nm for 23 January 2000. Grey areas in the plots of measured data represent valid data with values less than the minimum threshold value for particle presence whereas white areas indicate lack of valid data. Each panel is labelled as either measurements or model results from one of the three different temperature scenarios.
ACPD
4, 4581–4609, 2004
Influence of mountain waves and
NAT nucleation on PSC formation S. H. Svendsen et al. Title Page Abstract Introduction Conclusions References Tables Figures J I J I Back Close
Full Screen / Esc
Print Version Interactive Discussion © EGU 2004 8 10 12 14 16 18 14 16 18 20 22 24 26 8 10 12 14 16 18 14 16 18 20 22 24 26 8 10 12 14 16 18 14 16 18 20 22 24 26 8 10 12 14 16 18 14 16 18 20 22 24 26 Altitude (km)
Measured backscatter ratio
Measured and calculated backscatter ratio, 25/1-2000.
T=T 0 0,1800 0,2241 0,2791 0,3475 0,4327 0,5387 0,6708 0,8353 1,040 1,295 1,612 2,008 2,500 Hours UT T=T 0-TA T=T0-TA-Tcorr
ACPD
4, 4581–4609, 2004
Influence of mountain waves and
NAT nucleation on PSC formation S. H. Svendsen et al. Title Page Abstract Introduction Conclusions References Tables Figures J I J I Back Close
Full Screen / Esc
Print Version Interactive Discussion © EGU 2004 8 10 12 14 16 18 14 16 18 20 22 24 26 8 10 12 14 16 18 14 16 18 20 22 24 26 8 10 12 14 16 18 14 16 18 20 22 24 26 8 10 12 14 16 18 14 16 18 20 22 24 26
Measured and calculated depolarisation, 25/1-2000.
Measured depolarisation T=T 0 2,500 3,209 4,119 5,287 6,786 8,710 11,18 14,35 18,42 23,64 30,35 38,95 50,00 T=T0-TA Altitude (km) Hours UT T=T 0-TA-Tcorr
ACPD
4, 4581–4609, 2004
Influence of mountain waves and
NAT nucleation on PSC formation S. H. Svendsen et al. Title Page Abstract Introduction Conclusions References Tables Figures J I J I Back Close
Full Screen / Esc
Print Version Interactive Discussion © EGU 2004 0 10 20 30 40 50 60 70 80 90 100 Percentage of PSC 1a particles, 23/1-2000 T=T0-TA-Tcorr T=T0-TA T=T0 % Observed PSC 1a
PSC 1a, NAT nucleation above Tice included
PSC 1a, NAT nucleation above Tice not included
Fig. 5. Percentage of PSC 1a particles in observational and model data for 23 January 2000, for three different temperature scenarios. Model results are shown for two different microphysical scenarios, one where NAT nucleation above Ti ceis allowed, and one where this is not the case.
ACPD
4, 4581–4609, 2004
Influence of mountain waves and
NAT nucleation on PSC formation S. H. Svendsen et al. Title Page Abstract Introduction Conclusions References Tables Figures J I J I Back Close
Full Screen / Esc
Print Version Interactive Discussion © EGU 2004 0 1 2 3 4 5 6 Percentage of PSC 2 particles, 23/1-2000 T=T0-TA-Tcorr T=T0-TA T=T0 % Observed PSC 2
PSC 2, NAT nucleation above Tice included
PSC 2, NAT nucleation above Tice not included
Fig. 6. Percentage of PSC 2 particles in observational and model data for 23 January 2000, for three different temperature scenarios. Model results are shown for two different microphysical scenarios, one where NAT nucleation above Ti ceis allowed, and one where this is not the case.
ACPD
4, 4581–4609, 2004
Influence of mountain waves and
NAT nucleation on PSC formation S. H. Svendsen et al. Title Page Abstract Introduction Conclusions References Tables Figures J I J I Back Close
Full Screen / Esc
Print Version Interactive Discussion © EGU 2004 0 10 20 30 40 50 60 70 Percentage of PSC 1a particles, 25/1-2000 T=T0-TA-Tcorr T=T0-TA T=T0 % Observed PSC 1a
PSC 1a, NAT nucleation above Tice included
PSC 1a, NAT nucleation above Tice not included
ACPD
4, 4581–4609, 2004
Influence of mountain waves and
NAT nucleation on PSC formation S. H. Svendsen et al. Title Page Abstract Introduction Conclusions References Tables Figures J I J I Back Close
Full Screen / Esc
Print Version Interactive Discussion © EGU 2004 0 2 4 6 8 10 12 14 16 18 20 Percentage of PSC 2 particles, 25/1-2000 T=T 0-TA-Tcorr T=T0-TA T=T0 % Observed PSC 2
PSC 2, NAT nucleation above T
ice included
PSC 2, NAT nucleation above Tice not included
ACPD
4, 4581–4609, 2004
Influence of mountain waves and
NAT nucleation on PSC formation S. H. Svendsen et al. Title Page Abstract Introduction Conclusions References Tables Figures J I J I Back Close
Full Screen / Esc
Print Version Interactive Discussion © EGU 2004 -60 -40 -20 0 20 40 60 80 0 5 10 15 20 25 30 35 -60 -40 -20 0 20 40 60 80 0,0 0,5 1,0 1,5 2,0 2,5 3,0 3,5 4,0 -60 -40 -20 0 20 40 60 80 0 5 10 15 20 25 30 35 -60 -40 -20 0 20 40 60 80 0,0 0,5 1,0 1,5 2,0 2,5 3,0 3,5 4,0 -60 -40 -20 0 20 40 60 80 0 5 10 15 20 25 30 35 -60 -40 -20 0 20 40 60 80 0,0 0,5 1,0 1,5 2,0 2,5 3,0 3,5 4,0 T<TNAT, layer 5 Daynumber (2000) Tr a je c tor y f re que nc y ( % ) T<Tice, layer 5 T<TNAT, layer 6 T<Tice, layer 6 T<TNAT, layer 7 T<Tice, layer 7 T=T0 T=T0-TA T=T0-TA-Tcorr
Fig. 9. Percentage of trajectories where the temperature is below either TNAT (top row) or Ti ce (bottom row) for three different model layers. Layer 5: 475 K, layer 6: 515 K, layer 7: 550 K. Results are shown for three different temperature scenarios according to the colour coding, one without mountain wave pertubations and two where increasingly stronger mountain wave pertubations are included.
ACPD
4, 4581–4609, 2004
Influence of mountain waves and
NAT nucleation on PSC formation S. H. Svendsen et al. Title Page Abstract Introduction Conclusions References Tables Figures J I J I Back Close
Full Screen / Esc
Print Version Interactive Discussion © EGU 2004 -30 -20 -10 0 10 20 30 40 50 60 70 80 0 5 10 15 20 25 30 35 40 -30 -20 -10 0 10 20 30 40 50 60 70 80 0 5 10 15 20 25 30 35 40 -30 -20 -10 0 10 20 30 40 50 60 70 80 0 1 2 3 4 -30 -20 -10 0 10 20 30 40 50 60 70 80 -30 -20 -10 0 10 20 30 40 50 60 70 80 0 1 2 3 4 -30 -20 -10 0 10 20 30 40 50 60 70 80 0 5 10 15 20 25 30 35 40 -30 -20 -10 0 10 20 30 40 50 60 70 80 0 1 2 3 4 -30 -20 -10 0 10 20 30 40 50 60 70 80 0 5 10 15 20 25 30 35 40 -30 -20 -10 0 10 20 30 40 50 60 70 80 0 1 2 3 4 -30 -20 -10 0 10 20 30 40 50 60 70 80 0 5 10 15 20 25 30 35 40 -30 -20 -10 0 10 20 30 40 50 60 70 80 0 1 2 3 4 -30 -20 -10 0 10 20 30 40 50 60 70 80 0 5 10 15 20 25 30 35 40 PSC frequency (%) Daynumber (2000) Layer 5, PSC 2 Layer 6, PSC 1a Layer 6, PSC 2 Layer 7, PSC 1a Layer 7, PSC 2 T=T 0 T=T0-TA T=T 0-TA-Tcorr Layer 5, PSC 1a
Fig. 10. Percentage of trajectories containing PSCs of type 1a (left column) and type 2 (right column) PSCs within the polar vortex as a function of daynumber for the winter 1999–2000. Results are shown for three different model layers. Layer 5: 475 K, layer 6: 515 K, layer 7: 550 K, and for three different temperature scenarios according to the colour coding, one without mountain wave pertubations and two where increasingly stronger mountain wave pertubations are included. The solid lines are from a series of simulations where NAT nucleation above Ti ce is allowed whereas the dotted lines are from a simulation sequence where this is not the case.