HAL Id: hal-00295268
https://hal.archives-ouvertes.fr/hal-00295268
Submitted on 5 Jun 2003
HAL is a multi-disciplinary open access
archive for the deposit and dissemination of
sci-entific research documents, whether they are
pub-lished or not. The documents may come from
teaching and research institutions in France or
abroad, or from public or private research centers.
L’archive ouverte pluridisciplinaire HAL, est
destinée au dépôt et à la diffusion de documents
scientifiques de niveau recherche, publiés ou non,
émanant des établissements d’enseignement et de
recherche français ou étrangers, des laboratoires
publics ou privés.
Validation with in-situ aircraft measurements
T. Wagner, J. Heland, M. Zöger, U. Platt
To cite this version:
T. Wagner, J. Heland, M. Zöger, U. Platt. A fast H2O total column density product from GOME ?
Validation with in-situ aircraft measurements. Atmospheric Chemistry and Physics, European
Geo-sciences Union, 2003, 3 (3), pp.651-663. �hal-00295268�
www.atmos-chem-phys.org/acp/3/651/
Atmospheric
Chemistry
and Physics
A fast H
2
O total column density product from GOME – Validation
with in-situ aircraft measurements
T. Wagner1, J. Heland2, M. Z¨oger3, and U. Platt1
1Institut f¨ur Umweltphysik, University of Heidelberg, Germany
2Deutsches Zentrum f¨ur Luft- und Raumfahrt (DLR), Institut fr Physik der Atmosph¨are, Oberpfaffenhofen, Germany 3Deutsches Zentrum f¨ur Luft- und Raumfahrt (DLR), Flugabteilung, Oberpfaffenhofen, Germany
Received: 31 October 2002 – Published in Atmos. Chem. Phys. Discuss.: 29 January 2003 Revised: 13 May 2003 – Accepted: 27 May 2003 – Published: 5 June 2003
Abstract. Atmospheric water vapour is the most important greenhouse gas which is responsible for about 2/3 of the natural greenhouse effect, therefore changes in atmospheric water vapour in a changing climate (the water vapour feed-back) is subject to intense debate. H2O is also involved in many important reaction cycles of atmospheric chemistry, e.g. in the production of the OH radical. Thus, long time series of global H2O data are highly required. Since 1995 the Global Ozone Monitoring Experiment (GOME) continu-ously observes atmospheric trace gases. In particular it has been demonstrated that GOME as a nadir looking UV/vis-instrument is sensitive to many tropospheric trace gases. Here we present a new, fast H2O algorithm for the retrieval of vertical column densities from GOME measurements. In contrast to existing H2O retrieval algorithms it does not de-pend on additional information like e.g. the climatic zone, aerosol content or ground albedo. It includes an internal cloud-, aerosol-, and albedo correction which is based on simultaneous observations of the oxygen dimer O4. From sensitivity studies using atmospheric radiative modelling we conclude that our H2O retrieval overestimates the true atmo-spheric H2O vertical column density (VCD) by about 4% for clear sky observations in the tropics and sub-tropics, while it can lead to an underestimation of up to −18% in polar re-gions. For measurements over (partly) cloud covered ground pixels, however, the true atmospheric H2O VCD might be in general systematically underestimated. We compared the GOME H2O VCDs to ECMWF model data over one whole GOME orbit (extending from the Arctic to the Antarctic) in-cluding also totally cloud covered measurements. The cor-relation of the GOME observations and the model data yield the following results: a slope of 0.96 (r2= 0.86) and an av-erage bias of 5%. Even for measurements with large cloud fractions between 50% and 100% an average
underestima-Correspondence to: T. Wagner
tion of only −18% was found. This high accuracy of our GOME H2O data is also confirmed by the excellent agree-ment with in-situ aircraft measureagree-ments during the MINOS campaign in Greece in summer 2001 (slope of 0.97 (r2 = 0.86), and an average bias of only 0.2%). Our H2O algo-rithm can be directly adapted to the nadir observations of SCIAMACHY (SCanning Imaging Absorption SpectroMe-ter for Atmospheric CHartographY) which was launched on ENVISAT in March 2002. Near real time H2O column data from GOME and SCIAMACHY might be of great value for meteorological weather forecast.
1 Introduction
Global data sets of atmospheric H2O are needed for the in-vestigation of important atmospheric processes. As the most important atmospheric greenhouse gas H2O is strongly in-volved in the energy balance of the earth’s atmosphere. An increase of the atmospheric temperatures should result in higher evaporation rates and thus could cause increased at-mospheric water vapour contents, e.g. leading to higher precipitation rates. Long term global data sets might be well suited to investigate whether such an increase of the atmospheric water vapour content has already taken place. Near real time GOME H2O column data over extended areas might also serve as valuable input to improve meteorologi-cal weather forecast. In particular they could be helpful in predicting heavy precipitation events.
H2O also plays an important role in many atmospheric chemical reactions. In the winter polar stratosphere hetero-geneous reactions with H2O are an important prerequisite for chlorine activation and ozone destruction during ozone hole events (see e.g. Solomon 1999). In the troposphere the reac-tion of O(1D) with H2O is the dominant source for the OH radical which is the most important atmospheric reactant (see e.g. Atkinson 1990, 2000).
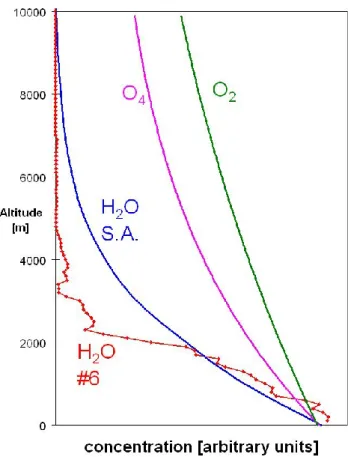
Fig. 1. Atmospheric height profiles for H2O, O2, and O4. The bulk
of the atmospheric O4column is located much closer to the earth’s surface than that for O2. (’H2O SA’ indicates the H2O profile of the
1976 US standard atmosphere, ’H2O #6’ that of the MINOS flight
#6, see also Fig. 2).
For these reasons extended global data sets of the atmo-spheric H2O distribution are highly required. H2O has so far been measured by in-situ observations with hygrome-ters at the ground, on radiosondes and on aircraft. Remote sensing from the ground is usually performed with spectro-scopic methods using photometers. Such observations yield the integrated atmospheric H2O concentration, the so called vertical column density, VCD in units of molec./cm2 or g/cm2(1022molec/cm2≈0.3 g/cm2) (Halthore et al., 1997). However, both the in-situ and photometer measurements can only provide local information. For the determination of the global atmospheric H2O distribution satellite observa-tions are necessary. Several satellite instruments, e.g. MLS, HALOE, SAGE II, POAM, LIMS, ATMOS, MAS, and ILAS yield H2O concentration profiles in the stratosphere by so-lar occultation or microwave limb emission techniques. A good overview and summary can be found in Kley and Rus-sel (2001). However, information on the H2O content of the middle or lower troposphere could not be retrieved from these observations.
First global tropospheric H2O data from satellite surements have been analysed from TOVS and GOES
mea-surements (Jedlovec, 1985, Soden and Bretherton, 1996; Chaboureau et al., 1998, and references therein). They yielded (limited) information on the vertical distribution but lacking precise information on the total atmospheric H2O column. Observations of upper tropospheric H2O in the IR spectral region were also performed by the CRISTA instru-ment on board the NASA Space shuttle (Schaeler and Riese, 2001).
Tropospheric H2O data are also obtained from mi-crowave observations of the Special Sensor Mimi-crowave Im-ager (SSM/I) (Bauer and Schluessel, 1993). Recently, atmo-spheric H2O data have also been derived from the signals of the GPS network (Bevis et al., 1992, Rocken et al., 1997, Baltink et al., 2002). This new and very promising method utilizes the influence of atmospheric H2O on the GPS sig-nals. Most recently global GPS water vapour profiles could be obtained from the CHAMP satellite (Wickert et al., 2001). In April 1995 the Global Ozone Monitoring Experiment (GOME) was launched on ERS-2. As a nadir-looking-UV/vis-instrument GOME is capable of measuring several tropospheric trace gases like NO2, BrO, HCHO, SO2, H2O and O3(ESA, 1995). In particular it can observe the total at-mospheric H2O column including the layers near the surface. GOME is now continuously operating for more than 7 years, thus these observations might be well suited for the investi-gation of trends of atmospheric trace gases like H2O. Atmo-spheric H2O has already been analysed from GOME obser-vations and compared to independent data sets by different groups (No¨el et al., 1999; Maurellis et al., 2000; Casadio et al., 2000; No¨el et al., 2000; 2002, Lang et al., 2003) and rea-sonable agreement was found. However, these GOME H2O algorithms suffer from different shortcomings:
a. First, they are based on complex retrieval schemes in-cluding e.g. different reference atmospheres (see e.g. No¨el et al. 1999) or vertically resolved atmospheric modelling (see e.g. Lang et al. 2003). Such complex re-trieval schemes might be appropriate if sufficient infor-mation on the atmospheric properties during the mea-surements is available. However, this is usually not the case for the large amount of GOME observations. b. Second, these algorithms typically mix information
from the measurements with additional information like assumptions on the atmospheric pressure and tempera-ture and radiative transfer (see e.g. Lang et al. 2003). Thus the H2O results become dependent not only on the observations but also on this a-priori information. c. Since most of the GOME observations are covered by
clouds, the largest uncertainty of tropospheric trace gas products is due to the influence of clouds on the ob-served spectra. The earlier H2O algorithms did not take this cloud influence into account at all. First very promising attempts for a cloud correction using O2 ab-sorptions were undertaken by No¨el et al. (2000, 2002)
and Casadio et al. (2000). However, usually the atmo-spheric profiles of O2with a scale height of ≈8 km and H2O are quite different (see Sect. 2.3.3 and Fig. 1). In this study we present a new H2O retrieval algorithm from GOME observations which is based on the DOAS-method (e.g. Platt et al., 1994). It is shown that this spectral retrieval procedure is robust, very fast and in particular in-dependent from assumptions on atmospheric properties. The saturation effect of the GOME H2O observations is corrected for after the spectral retrieval. For this purpose a simple rela-tionship between GOME observations and the atmospheric H2O column density is used which is derived from spec-tral convolution of the high resolved H2O absorption struc-ture with the instrument function of GOME (see e.g. Van Roozendael et al. 1999).
Finally the derived H2O absorptions are converted into the atmospheric vertical column density using the simulta-neously measured absorption of the oxygen dimer O4. The vertical column density of O4is known – it varies slightly with changes in air density and can be expected to be nearly constant – therefore the GOME observations of O4 allow the quantification of the effects of the atmospheric radiative transfer. This method has several advantages:
a. Since the O4concentration is proportional to the square of the oxygen concentration, the maximum of the O4 concentration is located close to the earth’s surface with a scale height of about 4 km. Thus the effects of the ra-diative transport through the atmosphere are more sim-ilar to H2O, which is also located close to the earth’s surface (see Fig. 1).
b. The effects of a changing ground albedo and aerosol content are largest for trace gases which are located close to the earth’s surface. The simultaneously mea-sured O4absorption allows a direct correction for these influences without further independent assumptions. c. Since clouds strongly influence the atmospheric
radia-tive transfer and cover nearly all GOME pixels, an ad-equate cloud correction is the prerequisite for correct tropospheric data products from GOME observations. In particular “subtle” cloud effects like multiple scat-tering inside clouds or horizontal light paths within the large ground pixels - which are difficult to model – are automatically taken into account.
d. No atmospheric radiative transfer modelling is included. In addition, all atmospheric scenes are analysed with the same retrieval approach. This makes our data analysis very transparent and stable.
The shortcomings of our approach include the remaining differences of the atmospheric radiative transfer for H2O and O4and are caused by the differences of the altitude profiles and the differences in the absorption strength. However, for most of the GOME observations these differences are small.
2 Instruments and data analysis
2.1 In-situ aircraft measurements of water vapour
The DLR research aircraft Falcon is permanently equipped with a standard in-situ meteorological measurement system to determine temperature, pressure, wind and humidity of the undisturbed air. The atmospheric water vapour is measured by three different instruments: a commercial aircraft dew point hygrometer (GE 1011B, General Eastern), a slightly modified capacitive sensor (Humicap-H ®,Vaisala) and a Lyman-alpha absorption instrument (Buck Research, Boul-der). The details of the instruments and intercomparisons with other sensors on board of different aircraft are described elsewhere (e.g.: Buck, 1985, Str¨om et al., 1994, Helten et al. 1998).
Due to its fast response time of a few milliseconds and wide sensitivity range the data of the Lyman-alpha instru-ment are used whenever possible. At high boundary layer water vapour concentrations, where saturation of the Lyman-alpha absorption instrument occurred, the Humicap data were used. Covariance analysis of Humicap and Lyman-alpha time series yield a response time of 3 s for the Humicap instrument at boundary layer conditions. At typical ascent or descent rates of 8 m/s (1500 ft/min) this corresponds to a vertical resolution of approximately 25 m. The accuracy of this instrument under lower tropospheric conditions is better than 5%. Both instruments were calibrated with a calibration bench similar to the one described by Z¨oger et al. (1999) using a commercial frost/dew point hygrometer as reference. All calibrations were performed over a realistic range of wa-ter vapour concentrations and pressures and are traceable to national standards. The error of the calibration is less then 3% of the measured value.
The low time resolution of the aircraft dew point hygrome-ter yielded a very low data coverage. Thus useful data of the dew point hygrometer where used only for consistency check with the other instruments.
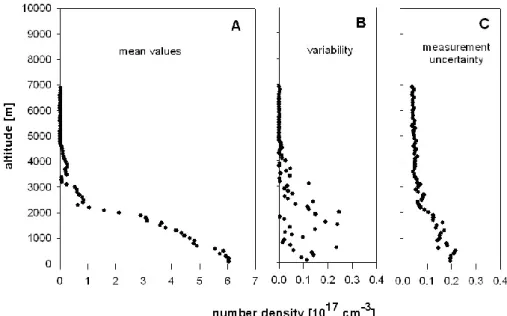
In order to reduce the amount of data the experimental data were averaged in 100 m altitude bins. In addition, since the error of the Lyman-alpha instrument is a non-linear function of the water vapour concentration and the pressure, a dedi-cated error analyses for the sensors was performed along the flight track of a representative flight, and averaged into 100 m altitude bins, too. Fig. 2 shows the altitude profile of MINOS flight #6 on 14 August 2001 (Fig. 2a), the variability of the data in the 100 m bins as 1σ standard deviations (Fig. 2b), and the mean error of the data in the 100 m bins (Fig. 2c). The resulting uncertainty of the tropospheric H2O column density due to the experimental errors is 0.6·1022molec./cm2 or approximately 6%. The variability of the data in the 100 m bins leads to an additional uncertainty of the column of about 0.3·1022molec./cm2or 3%.
Due to the lack of experimental H2O data in the upper troposphere with H2O mixing ratios below the
Fig. 2. Falcon H2O measurements as a function of altitude (a) on MINOS flight #6 (14.08.2001) between 07:20–08:40 TUC including the
variability of the experimental data in the 100 m altitude bins (b) and the measurement errors (c).
Lyman-alpha detection limit of approximately 50–100 ppmV or ≈9 km the resulting H2O column towards the tropopause at approximately 17 km altitude was estimated from a “range” of H2O mixing ratios of (50±50) ppmV to be about (2±2)·1020molec./cm2. Since the tropospheric H2O columns in the measurement area in this season are in the order of 1023molec./cm2 the contribution of the upper tro-pospheric H2O is well below 1% and can be neglected. The contribution of the stratospheric H2O column is even smaller; according to the H2O profile of the US standard atmosphere it is <1‰.
2.2 GOME on ERS-2
The GOME instrument is one of several instruments aboard the European research satellite ERS-2 (European Space Agency (ESA), 1995). It consists of a set of four spectrome-ters that simultaneously measure sunlight reflected from the Earth’s atmosphere and ground in four spectral windows cov-ering the wavelength range between 240 and 790 nm with moderate spectral resolution (0.2–0.4 nm full width at half maximum). The satellite operates in a nearly polar, sun-synchronous orbit at an altitude of 780 km with an equator crossing time at approximately 10:30 local time. While the satellite orbits in an almost north-south direction, the GOME instrument swaps in the perpendicular east-west direction. During one swap, three individual spectral scans are per-formed. The corresponding three ground pixels covering an area of 320 km from east to west by 40 km north to south lie side by side giving a western, a centre, and an eastern pixel. The Earth’s surface is totally covered within 3 days, and poleward from about 70◦latitude within 1 day.
2.3 GOME analysis
The retrieval of the H2O VCD from GOME measurements includes 2 basic steps. In the first step the integrated trace gas absorption along the light path which will also be referred to as the slant column density (SCD) is determined from the raw spectrum. In the second step the SCD is transformed into the vertically integrated H2O concentration, see e.g. Solomon et al. (1987).
2.3.1 Spectral Retrieval
From the raw spectra (level 1 data) the trace gas absorption of H2O as calculated from the HITRAN data base (Roth-man et al. 1992, 1998), and O4 (Greenblatt et al., 1990) are analysed using the DOAS method (Platt, 1994). For this study the wavelength range from 612 to 676 nm was used. The measured spectra are modelled with a non-linear fitting routine (Stutz and Platt, 1996) that suitably weights the absorption spectra of the atmospheric trace gases includ-ing O2(Rothman et al., 1992, 1998) and a solar background spectrum (Fraunhofer reference spectrum). Also, the influ-ence of atmospheric Raman scattering, the so-called Ring effect, is considered (Grainger and Ring, 1962; Bussemer, 1993). Contributions of atmospheric broad-band extinction processes (e.g., Rayleigh, and Mie scattering) and surface reflection are accounted for by including a third order poly-nomial into the fitting routine. The H2O cross section was calculated for a fixed temperature and pressure of 273 K and 900 hPa, respectively. We therefore investigated the temper-ature and pressure dependence of the H2O absorption struc-ture by varying the temperastruc-ture by ±20 K and the pressure
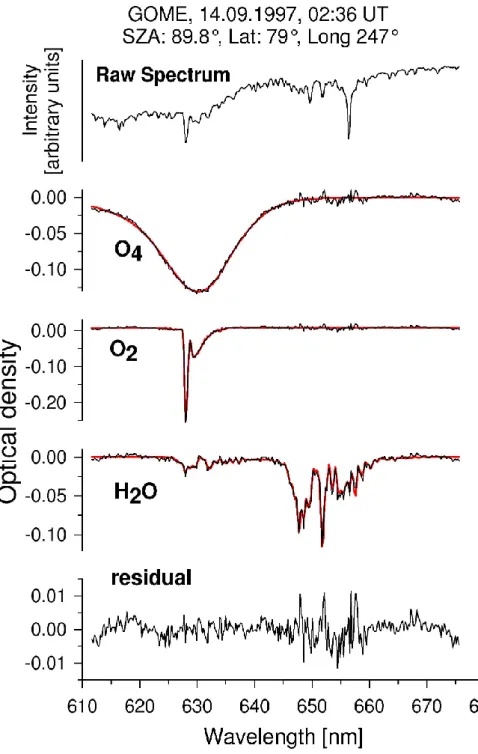
Fig. 3. In the upper panel a raw spectrum measured by GOME for the wavelength range of the H2O analysis is shown. Below the results
of the spectral evaluation for H2O and O4for this GOME spectrum are presented. Also the result of the simultaneously analysed O2are
included. The thick lines show the trace gas absorption spectra scaled to the respective absorptions detected in the measured GOME spectrum (thin lines).
by ±100 hPa. The analysis of GOME measurements using these different H2O spectra yielded H2O SCDs varying by only ±3%. Compared to the other errors of the GOME H2O analysis (see below) these uncertainties can be neglected.
From the inferred absorption, and the knowledge of the absorption cross section, the trace gas SCD is calculated. In
Fig. 3 the result of the DOAS retrieval is shown. All three ab-sorbers, H2O, O2and O4, respectively, can be clearly iden-tified in the selected spectral window of the GOME spec-trum. From the errors of the spectral fitting process and the uncertainty of the absorption cross section the total error of the derived atmospheric SCDs can be quantified (Stutz et al.,
1996). For H2O the error of the spectral retrieval is about 5% (or <2·1022molec./cm2). For O4 the uncertainty is about 8% (or <2·1042molec.2/cm5. Here the O4 column density is expressed as the integrated quadratic O2 concentration, see Greenblatt et al., 1990). For the conversion of the ob-served O4absorption into the respective column density we applied an O4cross section of 9.61·1046cm5/molec.2which was determined from atmospheric observations (Wagner et al., 2002). In some cases the relative fitting error of O4can become significantly larger than that of H2O. This was found especially for large atmospheric H2O columns over ocean surfaces, most probably due to the small light intensity over the dark surface and/or the impact of sun glint.
2.3.2 Correction of the non-linearity between the measured absorption and the atmospheric H2O column density While the broad band O4absorptions can be spectrally re-solved by the GOME instrument, this is not the case for the highly fine structured H2O and O2absorption bands. Thus the derived H2O SCD is no more a linear function of the at-mospheric H2O column density (Solomon et al., 1989; Wag-ner et al., 2000). Especially for large H2O SCDs this effect can become important, e.g. for an atmospheric H2O SCD of 2.5·1023molec./cm2the underestimation is about 30%. Nev-ertheless, a correction can be easily applied to the results of the DOAS analysis. The respective correction factors are cal-culated from the numerical simulation of this effect by math-ematical convolution of the high resolved H2O spectrum with the instruments slit function.
First, the spectrally high resolved H2O cross section σ (λ), taken from the HITRAN data base (Rothman, 1992, 1998), is multiplied with the assumed atmospheric H2O SCD and the respective atmospheric absorption spectrum is calculated according to Beer-Lamberts law:
I (λ) = I0·exp[−σ (λ) · SCD] (1)
Second, this H2O absorption spectrum is convoluted with the instrument response function of GOME F (λ, λ0):
I∗(λ) = F∗I (λ) = Z
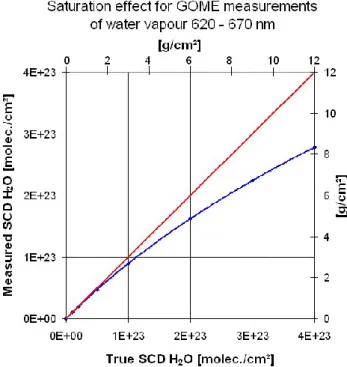
F (λλ0) · I (λ0) · dλ0 (2) In the third step the logarithm is applied to the convoluted H2O absorption spectrum which is then analysed using the DOAS method in the same way as for the real GOME mea-surements. In Fig. 4 the relationship between the derived H2O SCD and the H2O SCD which is used as the input for the modelling is shown. As indicated above, for small H2O SCDs the non-linearity is still small, but large H2O SCD’s are systematically underestimated by up to more than 30%. Using this relationship the H2O SCDs derived from the DOAS retrieval are corrected and the actual H2O SCD is determined.
This approach combines the advantage of the fast and ro-bust DOAS retrieval with the necessary correction for satura-tion effects in the spectra. In Fig. 5 (upper and middle panel)
Fig. 4. Results of the numerical Simulation of the saturation
ef-fect of the H2O measurements (at 650 nm) from GOME. The
non-linearity between the actual H2O VCD and the observed H2O VCD
from the DOAS analysis is indicated by the blue line.
the impact of the saturation correction is demonstrated for one GOME orbit. For high H2O SCDs in the tropics the largest correction has to be applied.
2.3.3 Application of “measured” air mass factors
Since the derived H2O SCDs strongly depend on the solar zenith angle (SZA), they have to be converted into VCDs. Usually for this purpose the radiative transfer through the at-mosphere is modelled, see e.g. Solomon et al. (1987), and Marquard et al. (2000). The results of these numerical mod-els are conventionally expressed as air mass factors (AMF) which describe the ratio between the SCD and the VCD. However, while this is possible with high accuracy for strato-spheric trace gases like NO2 or O3, the situation is much more complicated for tropospheric absorbers. Since the air density increases towards the surface multiple Rayleigh scat-tering plays an important role for tropospheric observations. Also, reflections at the ground further increase the effects of multiple scattering, especially for a large ground albedo. Fi-nally, the influence of aerosols and in particular clouds be-comes very important. In extreme cases, clouds can com-pletely shield trace gases which are located below the cloud cover. For these reasons the numerical modelling of the ra-diative transfer through the troposphere may lead to large un-certainties (Richter and Burrows, 2002; Wagner et al., 2001). Even if detailed information on the different atmospheric and
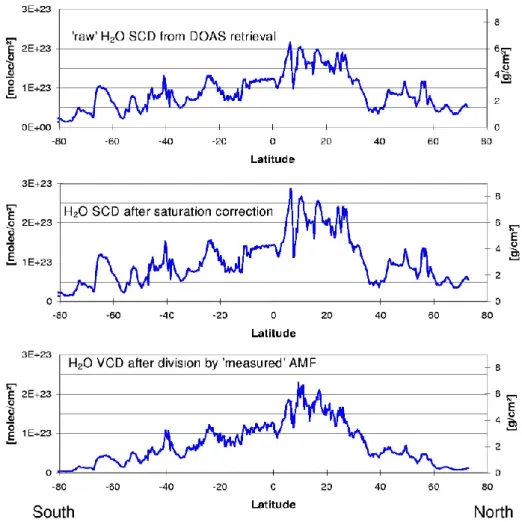
Fig. 5. Different steps of the GOME H2O retrieval (for the orbit 81023175, 23 October 1998). Upper panel: the uncorrected H2O SCDs
as derived from the DOAS retrieval. Middle panel: H2O SCDs after the correction of the “saturation effect” (see text). Lower panel: H2O VCDs after application of the “measured AMFs”. It can be seen that the strong variations of the H2O SCD between 0 and 30◦latitude are
strongly reduced after the conversion into the H2O VCDs. This shows the power of our method in automatically correcting the influence of clouds.
ground/surface properties within a GOME ground pixel was available (which is usually not the case) current radiative transfer models still have deficiencies in the adequate mod-elling of the radiative transfer inside clouds. This is why the application of “measured AMFs” becomes an interesting option. These “measured AMFs” can be derived from the absorptions of tropospheric gases with known (and almost constant) concentrations. The ratio between the measured SCD of such an absorber and the known VCD for a stan-dard atmosphere, e.g. normal conditions at ground, clear sky, yields the “measured AMF”. Such “measured AMFs” auto-matically take into account the effects of multiple scattering, aerosols, ground albedo and clouds. It should be noted here that because of the large ground pixel size nearly all GOME observations are affected by clouds which thus are usually the dominant source of error for tropospheric observations (Richter and Burrows, 2002; Wagner et al., 2001; Velders et al., 2001).
First attempts towards “measured AMFs” were undertaken by No¨el et al. (2000, 2002) and Casadio et al. (2000) uti-lizing measurements of the atmospheric O2absorption. Be-cause of the large difference between the shapes of the con-centration profiles of O2and H2O, however, it is evident that the derived correction is usually not well suited for the appli-cation to the H2O measurements. Let us assume for exam-ple a cloud at about 2 km altitude. While most of the H2O absorption is shielded by this cloud (the bulk of the H2O is located close to the ground), most of the O2 column is still above the cloud. In this study we use the simultaneous measurements of O4for the determination of the “measured AMF”. Because of the square dependence of the O4 con-centration on the O2concentration (see e.g. Greenblatt et al. 1990) the dominant contribution of the O4profile is located much closer to the ground; the scale height is only about 4 km compared to 8 km for O2(see Fig. 1). Because of the larger similarity between the O4 profile and the H2O profile, the
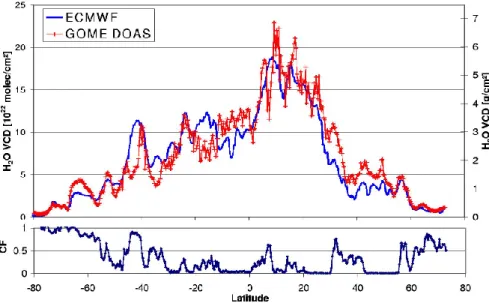
Fig. 6. Comparison of the GOME H2O analysis for the same orbit as in Fig. 5 with modelled H2O VCDs (ECMWF). The same orbit was
also analysed by Maurellis et al. (2000) (from whom the model data are taken) and Lang et al. (2003). The cloud fractions displayed in the lower panel are derived with a GOME PMD algorithm developed at the University of Heidelberg (Grzegorski, 2003).
measured O4AMFs are therefore much more appropriate for the conversion of the measured H2O SCDs into VCDs.
However, the measured O4AMFs are also subject to sev-eral limitations: First, the cloud correction is only valid un-der the assumption that the H2O profile is horizontally ho-mogeneous throughout the whole GOME ground pixel. This is in general not the case; especially for measurements with cloud fractions close to 100% the respective error can be-come large. In such cases only very limited or even no in-formation on the water vapour concentration below the cloud can be retrieved. Fortunately, it turned out that even for cloud cover between 50% and 100% our algorithm underestimates the true atmospheric values by only 18% (see Sect. 3). Nev-ertheless, it might be a good procedure for future routine ap-plications of our algorithm to exclude GOME observations with cloud fractions above a certain threshold.
Second, because of the remaining difference of the H2O and O4profiles and because of the differences in the absorp-tion strengths the actual AMFs for both species still show systematic deviations. While for large SZA the difference in the profile shape is the dominant effect, for small SZA the difference in the absorption strength becomes more impor-tant due to the high H2O concentrations in the tropics where the smallest SZA for a GOME orbit appear. We modelled these effects using the Monte Carlo radiative transfer model AMFTRAN (Marquard et al., 2000) assuming clear sky con-ditions and a ground albedo of 5%. Both effects lead to a systematic underestimation of the actual H2O SCD which ranges between about 16% in the tropics and about 18% for measurements at 80◦SZA. For medium SZA, between about 40◦ and 70◦, the underestimation is smallest (about 12%).
It is important to note that for higher values of the ground albedo the differences become significantly smaller.
Third, the atmospheric O2VCD and thus also the O4VCD changes with pressure and temperature. Nevertheless, except extreme weather situations like e.g. strong cyclones, such changes are below ±5%. Advanced future H2O algorithms could easily correct this effect using data on the surface pres-sure, e.g. from meteorological models.
Fourth, while in general the earth’s albedo at 630 nm (O4) and 650 nm (H2O) can be expected to be very similar (Koe-jlemeier et al., 2003), over specific surface types strong vari-ations of the albedo within this spectral regions can not be totally ruled out. Such potential variations would have a (small) effect on the retrieved H2O VCD.
Fifth, due to the different profile shapes of H2O and O4 the effects of clouds are different for both species. We also modelled these effects with our radiative transfer model. We used the simplifying assumptions that clouds were reflecting surfaces with an albedo of 80%. Two dominant effects have to be considered:
a. The cloud shielding effect: Especially for low and medium high clouds the relative fraction of the total VCD which is shielded below the cloud is systemati-cally different for both species. In contrast, this effect becomes negligible for high clouds, e.g. in the trop-ics, since then the main part of the total H2O VCD as well as the main part of the total O4VCD is shielded. Also for surface near clouds or fog the errors are small. In Table 1 the magnitude of the underestimation of the GOME H2O VCD is summarised.
Table 1. Estimated underestimation of the H2O VCD in the case of partially cloudy GOME ground pixels. For the calculations it is assumed
that clouds are shielding surfaces with an albedo of 80%. The errors are largest for clouds between 1 and 5 km altitude. Please note that except polar regions the systematic underestimation of the true H2O VCD is largely compensated by the temperature dependence of the O4
absorption cross section (see also text) (Newnham and Ballard, 1998; Wagner et al., 2002)
Cloud top height Cloud fraction 20% Cloud fraction 50% Cloud fraction 70%
<1 km <5% <15% <30%
1–5 km <10% <25% <45% 5–8 km <8% <20% <35%
>8 km <3% <6% <15%
b. The cloud albedo effect: Since clouds are bright they enhance the sensitivity towards trace gases directly above the cloud with respect to the clear sky scene with a low ground albedo (Richter and Burrows, 2002; Wag-ner et al., 2001; Velders et al., 2001). Thus especially low clouds or fog at the ground can enhance the sensitiv-ity of the measurements for H2O. Thus they might to a small degree compensate the shielding effect of clouds. A similar but generally smaller effect can be also due to multiple Mie scattering inside the clouds and aerosol layers or reflections between the cloud layer and the sur-face. Nevertheless, these effects should in general be small and the shielding effect is expected to dominate the total cloud effect.
One additional aspect has to be considered, which fortu-nately largely compensates the systematic underestimation outlined above. For the O4analysis we applied an O4cross section which was measured in polar winter (Wagner et al., 2002), when the tropospheric temperatures are significantly lower than during measurements especially in the tropics and sub-tropics. For example during the MINOS campaign the difference is about 40 K. The respective underestimation of the true atmospheric O4absorption at 630 nm is about 14% (Newnham and Ballard, 1998, Wagner et al., 2002). Thus this effect can nearly completely compensate the expected underestimation of the true H2O VCD by GOME for a clear day. Especially in the Tropics and sub-tropics the true atmo-spheric H2O VCD for clear sky can even be overestimated by a few percent because of this effect. Only for high cloud fractions the differences between the derived and the actual H2O VCDs can become relatively large, in extreme cases of total cloudy sky it might be up to more than 50%.
However, these uncertainties have to be compared to the uncertainties which can appear if calculated AMFs are used and no or a not adequate cloud correction is applied or wrong aerosol and albedo data are used: Even for clear sky condi-tions the influence of a changing ground albedo and chang-ing aerosol content can cause systematic errors of up to more than 30%. If the influence of clouds is not corrected at all, an additional systematic underestimation of the H2O VCD in the order of about 50% or more can be expected for nearly all GOME observations, because nearly all GOME ground
pix-els are partly covered by clouds. These effects are directly corrected for by our method of “measured AMFs”. In the lower panel of Fig. 5 the H2O VCDs for the selected GOME orbit are shown. Especially in the tropics the strong variation of the H2O SCDs (caused by clouds) is strongly reduced by the application of the “measured AMFs”.
3 Results and discussion
3.1 Comparison of measured and modelled H2O VCDs along one GOME orbit
In Fig. 6 the H2O VCDs derived with our method for a se-lected GOME orbit (see Fig. 5) are displayed. The same or-bit was also analysed by Maurellis et al. (2000), and Lang et al. (2003), who compared their data to model values from ECMWF. We used these modelled H2O VCDs also for a comparison with our GOME H2O analysis. The results of our study (here all measurements including the cloudy scenes are shown) agree well with the model results (see Table 2). In particular, the shielding effect of the clouds affects the de-rived H2O VCDs around the latitude of 5◦ much less than in the data from Maurellis et al. (2000). Lang et al. (2003) found that their GOME H2O results compare well with the ECMWF data only for cloud fractions <10%. From the cor-relation of the observations (including the cloudy scenes) and the model data we derived a slope of 0.96 (r2= 0.86) and an average bias of 5%. Even for measurements with large cloud fractions between 50% and 100% an average underestima-tion of only −17.5% was found (see also Table 2).
It should be noted that a comprehensive validation will need the analysis of much larger data sets including in par-ticular different seasons. It should in parpar-ticular include a de-tailed statistical analysis of the influence of further measure-ment parameters like e.g. the heterogeneity of surface and atmospheric parameters. Nevertheless, already the limited validation study presented in this section can give a first es-timate on the accuracy of our new method. Further detailed validation will be the subject of future studies.
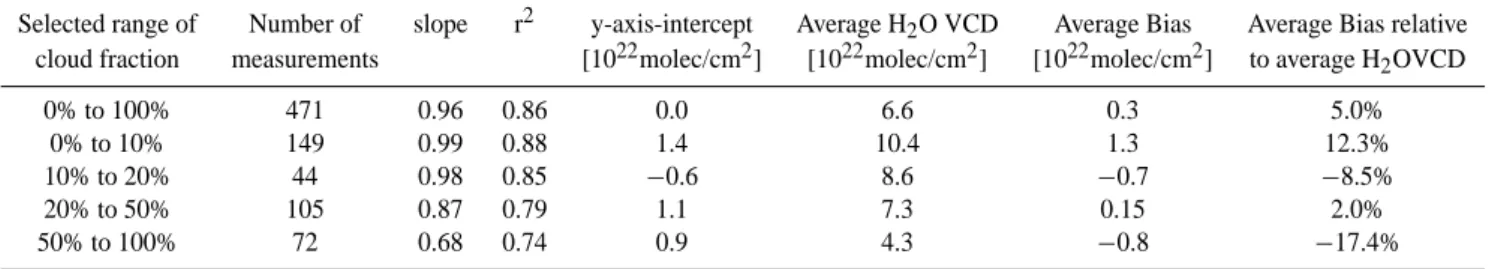
Table 2. Statistical analyis of the correlation between the GOME DOAS H2O VCDs and ECMWF model data along GOME orbit 81023175.
For cloud fractions between 50%–100% only the latitudes between −60◦and +70◦were used because of the potential influence of ice and snow on the cloud algorithm in polar regions. The cloud fractions are derived with a GOME PMD algorithm developed at the University of Heidelberg (Grzegorski, 2003)
Selected range of Number of slope r2 y-axis-intercept Average H2O VCD Average Bias Average Bias relative
cloud fraction measurements [1022molec/cm2] [1022molec/cm2] [1022molec/cm2] to average H2OVCD
0% to 100% 471 0.96 0.86 0.0 6.6 0.3 5.0% 0% to 10% 149 0.99 0.88 1.4 10.4 1.3 12.3% 10% to 20% 44 0.98 0.85 −0.6 8.6 −0.7 −8.5% 20% to 50% 105 0.87 0.79 1.1 7.3 0.15 2.0% 50% to 100% 72 0.68 0.74 0.9 4.3 −0.8 −17.4%
3.2 Comparison with in-situ aircraft data during MINOS 2001
During the MINOS campaign in Greece 2001 (Lelieveld et al. 2002, http://www.mpch-mainz.mpg.de/∼reus/minos/ index.htm) airborne in-situ H2O observations were made which could be compared to tropospheric H2O VCDs from GOME. In total, during the course of the campaign, seven flights do show a reasonably good temporal and spatial over-lap with the GOME observations. However, because the air-craft missions were not optimised for satellite validation the flight tracks did not necessarily cover a representative area of a GOME ground pixel. Therefore, it should be noted that especially in cases of strong gradients or fluctuations of the H2O VCD or other parameters like e.g. ground albedo or cloud cover across one or more GOME ground pixels, even for a good overlap the explanatory power of a comparison between GOME and aircraft observations is limited.
Because the atmospheric H2O VCD is dominated by the contributions close to the ground only those GOME pixels covering the areas of a full vertical aircraft profile including the start and/or landing areas over Crete were selected for the comparisons.
For all comparisons the sky was almost cloud free accord-ing to METEOSAT images (Mannstein, 2002) and GOME cloud fractions as derived with the CRUSA cloud algorithm, see Wenig (2001). However, on some days, e.g. on 14 Au-gust, 2001, several small cloud fragments were spread over the Mediterranean Sea.
An overview of all coincidences and a comparison of the respective H2O columns derived from the measurements dur-ing the MINOS 2001 campaign are shown in Table 3 and Fig. 7. Generally, for the flights which were made close to the time of the GOME overpass the agreement between both, the GOME and in-situ data is very good. For instance, for MINOS flights #5 and #6 the agreement is excellent.
The result for flight #7, which was made on the same day and in almost the same region as flight #6, but approximately 7 hours later, reveals a strong deviation which can be at-tributed to the large temporal difference.
Fig. 7. Comparison between the H2O VCD derived from the aircraft
(x-axis) and satellite (y-axis). For the cases of good temporal and spatial coincidence good agreement is found. For some cases with a large temporal difference or large spatial gradients the agreement is worse (indicated by red circles).
Another case with only moderate agreement between the GOME (8.7·1022molec./cm2) and the in-situ data (6.8·1022molec./cm2) is MINOS flight #10. On the day of this flight (19.08.2001) the GOME observations show a strong west-east gradient in the Falcon flight area, see Fig. 8. The boundary layer was sampled by the aircraft in the south-east part of the Falcon flight descending from the west into Heraklion, Crete. With the assumption that the H2O VCD east-west gradient of 5.5·1022molec./cm2 per 650 km – as estimated from the three neighbouring GOME measurements – also exists across the eastern GOME pixel of the Falcon flight area a H2O VCD of 7.3·1022molec./cm2is estimated over Crete. This value is very close to – and well within the error margins of – the H2O column of 6.8·1022molec./cm2 as determined from the aircraft observations.
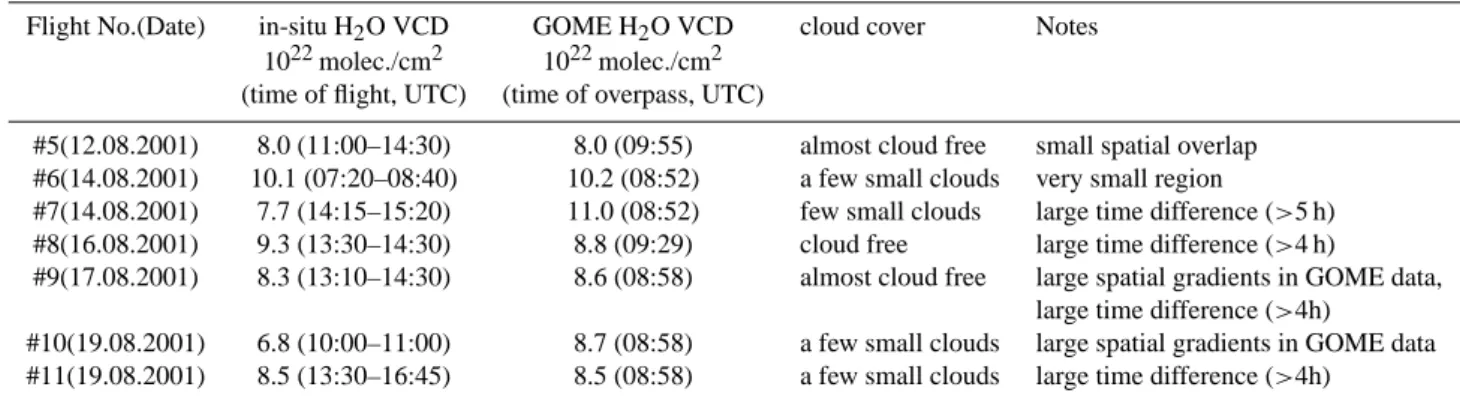
Table 3. Overview of all coincidences and a comparison of the respective H2O columns derived from the measurements during the MINOS
2001 campaign
Flight No.(Date) in-situ H2O VCD GOME H2O VCD cloud cover Notes
1022molec./cm2 1022molec./cm2 (time of flight, UTC) (time of overpass, UTC)
#5(12.08.2001) 8.0 (11:00–14:30) 8.0 (09:55) almost cloud free small spatial overlap #6(14.08.2001) 10.1 (07:20–08:40) 10.2 (08:52) a few small clouds very small region
#7(14.08.2001) 7.7 (14:15–15:20) 11.0 (08:52) few small clouds large time difference (>5 h) #8(16.08.2001) 9.3 (13:30–14:30) 8.8 (09:29) cloud free large time difference (>4 h)
#9(17.08.2001) 8.3 (13:10–14:30) 8.6 (08:58) almost cloud free large spatial gradients in GOME data, large time difference (>4h)
#10(19.08.2001) 6.8 (10:00–11:00) 8.7 (08:58) a few small clouds large spatial gradients in GOME data #11(19.08.2001) 8.5 (13:30–16:45) 8.5 (08:58) a few small clouds large time difference (>4h)
Fig. 8. GOME H2O maps over the Mediterranean for 14 July (flight #6) and 19 July (flight #10). Also shown are satellite images from METEOSAT (Mannstein, 2002). For flight #6 an excellent agreement between the GOME and Falcon observations is found. For flight #10 both observations differ by about 30%. This discrepancy can be attributed to the strong west-east gradient of the H2O VCD on that day (see
text). For both flights (especially for flight #6) significant “scatter” is found for the GOME H2O data along the orbit. This scatter can be
attributed to several small clouds over the Mediterranean Sea (1022molec/cm2≈0.3 g/cm2).
From the correlation of the GOME H2O VCDs to the in-situ measurements (excluding both cases mentioned above) we derive a slope of 0.97 (r2 = 0.86) and an average bias of only 0.2%. We conclude that the agreement between the
GOME and in-situ columns is generally very good and the differences are mainly due to poor spatial and temporal co-incidences, especially when strong gradients are observed in the area of interest.
4 Conclusions
A new and fast GOME algorithm for the retrieval of the to-tal atmospheric column of H2O was developed. In contrast to already existing algorithms no additional a-priori informa-tion on the climatic zone or other important parameters like atmospheric aerosol content, surface albedo or cloud cover is needed. It includes an internal cloud-, aerosol-, and albedo correction which is based on simultaneous observations of the oxygen dimer O4.
From sensitivity studies using atmospheric radiative trans-port modelling we conclude that our H2O retrieval overes-timates the true atmospheric H2O vertical column density (VCD) by about 4% for clear sky observations in the trop-ics and sub-troptrop-ics, while it can lead to an underestimation of up to −18% in polar regions. For measurements over (partly) cloud covered ground pixels, however, the true atmo-spheric H2O VCD might be in general systematically under-estimated. We compared the GOME H2O VCDs to ECMWF model data over one whole GOME orbit (extending from the Arctic to the Antarctic) including also totally cloud covered measurements. The correlation of the GOME observations and the model data yield the following results: a slope of 0.96 (r2= 0.86) and an average bias of 5%. Even for mea-surements with large cloud fractions between 50% and 100% an average underestimation of only −18% was found. This high accuracy of our GOME H2O data is also confirmed by the excellent agreement with in-situ aircraft measurements under clear sky conditions during the MINOS campaign in Greece in summer 2001 (slope of 0.97 (r2 = 0.86), and an average bias of only 0.2%).
It should be noted that our algorithm can be easily adapted to the nadir observations of SCIAMACHY which was launched on the European research satellite ENVISAT on 1 March 2002 (Bovensmann et al., 1999). Since there is already a large temporal overlap between GOME and SCIA-MACHY we expect a continuous time series of the global atmospheric H2O VCD over the entire lifetime of both sen-sors.
Acknowledgements. The authors thank Michael Buchwitz, Stefan
No¨el, and Andreas Richter (University of Bremen, Germany) for interesting and constructive discussions. Additional thanks go to R¨udiger Lang (University of Mainz) and to an anonymous reviewer for their very constructive remarks. Without the good cooperation with the MINOS project team and the DLR Falcon aircraft crew this work would not have been possible.
References
Atkinson, R.: Gas-phase tropospheric chemistry of organic com-pounds: A review, Atmospheric Environment, 24A, 1–41,1990. Atkinson, R.: Atmospheric chemistry of VOCs and NOx,
Atmo-spheric Environment, 34, 2063–2101, 2000.
Baltink, H. K., van der Marel, H., and van der Hoeven, A. G. A.: In-tegrated atmospheric water vapor estimates from a regional GPS network, J. Geophys. Res., 107, 2002.
Bauer, P. and Schluessel, P.: Rainfall, total water, ice water, and water vapor over sea-polarized microwave simulations and spe-cial sensor microwave/image data, J. Geophys. Res., 98, 20 737– 20 759, 1993.
Bevis, M., Businger, S., Herring, T. A., Rocken, C., Anthes, R. A., and Ware, R. H.: GPS meteorology: remote sensing of at-mospheric water vapor using the global positioning system, J. Geophys. Res., 97, 15 787–15 801, 1992.
Buck, A.: The lyman-alpha absorption hygrometer, ISA Proceed-ings of the International Symposium on Moisture and Humidity, 411–436, 1985.
Bovensmann, H., Burrows, J. P., Buchwitz, M., Frerik, J., No¨el, S., Rozanov, V. V., Chance, K. V., and Goede, A.: SCIAMACHY – mission objectives and measurement modes, J. Atmos. Sci., 56(2), 127–150, 1999.
Bussemer, M.: Der Ring-Effekt: Ursachen und Einflu auf die spek-troskopische Messung stratosph¨arischer Spurenstoffe, Diploma thesis, University of Heidelberg, 1993.
Casadio, S., Zehner, C., Pisacane, G., and Putz, E.: Empirical re-trieval of the atmospheric air mass factor (ERA) for the measure-ment of water vapour vertical content using GOME data, Geo-phys. Res. Lett., 27, 1483–1486, 2000.
Chaboureau, J.-P., Ch´edin, A., and Scott, N. A.: Remote Sensing of the Vertical Distribution of Atmospheric Water Vapor from the TOVS Observations. Method and Validation, J. Geophys. Res., 102, 4343–4352, 1997.
European Space Agency (ESA): GOME, Global Ozone Monitoring Experiment, users manual, edited by F. Bednarz, Spec. Publ. SP-1182, Publ. Div. Eur. Space Res. and Technol. Cent. (ESTEC), Frascati, Italy, 1995.
Grainger, J. F. and Ring, J.: Anomalous Fraunhofer line profiles, Nature, 193, 762, 1962.
Greenblatt G. D., Orlando, J. J., Burkholder, J. B., and Ravis-hankara, A. R.: Absorption measurements of oxygen between 330 and 1140 nm, J. Geophys. Res., 95, 18 577–18 582, 1990. Grzegorski, M.: Bestimmung von Wolkenparametern fr das Global
Ozone Monitoring Experiment mit breitbandigen Spektrometern und aus Absorptionsbanden von Sauerstoffdimeren, Diploma Thesis, University of Heidelberg, 2003.
Halthore, R. N., Eck, T. F., Holben, B. N., and Markham, B. L.: Sun photometric measurements of atmospheric water vapor column abundance in the 940-nm band, J. Geophys. Res., 102, 4343– 4352, 1997.
Helten, M., Smit, H. G. J.; Str¨ater, W., Kley, D., Nedelec, P., Z¨oger, M., Busen, R.: Calibration and performance of automatic com-pact instrumentation for the measurement of relative humidity from passenger aircraft, J. Geophys. Res., 103, 25 643–25 652, 1998.
Jedlovec, G. J.: An evaluation and comparison of vertical profile data from the VISSR Atmospheric Sounder ( VAS). J. Atmos. Oceanic Technol. , 2, 559–581, 1985.
Kley, D. and Russel, J. M.: SPARC assessment of upper tropo-spheric and stratotropo-spheric water vapour, edited by the SPARC office, Service d’A´eronomie, CNRS, Verrires-le-Buisson cedex, France,, SPARC Newsletter n◦16, 11–16, 2001.
Koelemeijer, R. B. A, de Haan, J. F., and Stammes, P.: A database of spectral surface reflectivity in the range 335–772 nm derived from 5.5 years of GOME observations, J. Geophys. Res., 108, D2, 10.1029/2002JD002429, 2003.
Lang, R., Williams, J. E., van der Zande, W. J., and Maurellis, A. N.: Application of the Spectral Structure Parameterization tech-nique: retrieval of total water vapour coloumns from GOME, Atmos. Chem. Phys., 3, 145–160, 2003.
Lelieveld, J., Berresheim, H., Borrmann, S., Crutzen, P. J., Den-tener, F. J., Fischer, H., de Gouw, J., Feichter, J., Flatau, P., He-land, J., Holzinger, R., Korrmann, R., Lawrence, M., Levin, Z., Markowicz, K., Mihalopoulos, N., Minikin, A., Ramanathan, V., de Reus, M., Roelofs, G. J., Scheeren, H. A., Sciare, J., Schlager, H., Schultz, M., Siegmund, P., Steil, B., Stier, P., Traub, M., Warneke, C., Williams, J., and Ziereis, H.: Global air pollution crossroads over the Mediterranean, Science, in press 2002. Mannstein, H.: DLR-IPA, Germany, personal communication 2002. Marquard, L. C., Wagner, T., and Platt, U.: Improved air mass fac-tor concepts for scattered radiation differential optical absorp-tion spectroscopy of atmospheric species, J. Geophys. Res.,105, 1315–1327, 2000 .
Maurellis, A. N., Lang, R., van der Zande, W. J., Aben, I., and Ubachs, W.: Precipitable Water Column Retrieval from GOME data, Geophys. Res. Lett., 27, 903–906, 2000.
Newnham, D. A. and Ballard, J.: Visible absorption cross section and integrated absorption intensities of molecular oxygen (O2
and O4), J. geophys. Res., 103, 28 801–28 816, 1998.
No¨el, S., Buchwitz, M., Bovensmann, H., Hoogen, R., Burrows, J. P.: Atmospheric Water Vapor Amounts Retrievd from GOME Satellite data, Geophys. Res. Lett., 26, 1841–1844, 1999. No¨el, S., Bovensmann, H., and Burrows, J. P.: Water vapour
re-trieval from GOME data including cloudy scenes, Proc. EN-VISAT/ERS Symposium, Gothenburg, 2000.
No¨el, S., Buchwitz, M., Bovensmann, H., and Burrows, J. P.: Retrieval of Total Water Vapour Column Amounts from GOME/ERS-2 Data , Adv. Space Res., 29, 1697–1702, 2002. Platt, U.: Differential optical absorption spectroscopy (DOAS),
in Air Monitoring by Spectroscopic Techniques, M. W. Sigrist (Ed.), Chemical Analysis Series Vol. 127, John Wiley, New York, 1994.
Richter, A. and Burrows, J. P.: Retrieval of Tropospheric NO2from
GOME Measurements, Adv. Space Res., 29 (11) ,1673–1683, 2002.
Rocken, C., Hove, T. V., and Ware, R.: Near real-time GPS sensing of atmospheric water vapor, Geophys. Res. Lett., 24, 3221–3224, 1997.
Rothman, L. S., Gamache, R. R., Tipping, R. H., Rinsland, C. P., Smith, M. A. H., Benner, D. C., Malathy Devi, V., Flaud, J.-M., Camy-Peyret, C., Perrin, A., Goldman, A., Massie, S. T., Brown, L. R., and Toth, R. A.: The HITRAN molecular database: editions of 1991 and 1992, J. Quant. Spectrosc. Radiat. Transfer, 48, No. 5/6, 469–508, 1992.
Rothman, L. S., Rinsland, C. P., Goldman, A., Massie, S. T., Ed-wards, D. P., Flaud, J.-M., Perrin, A., Camy-Peyret, C., Dana, V., Mandin, J.-Y., Schroeder, J., McCann, A., Gamache, R. R., Wattson, R. B., Yoshino, K., Chance, K. V., Jucks, K. W., Brown, L. R., Nemtchinov, V., and Varanasi, P.: The HITRAN molecular spectroscopic database and HAWKS (HITRAN At-mospheric Workstation): 1996 edition, Journal of Quantitative Spectroscopy and Radiative Transfer, 60, No. 5, 665–710, 1998. Schaeler, B. and Riese, M.: Retrieval of Water Vapor in the Tropopause Region from CRISTA Measurements, Adv. Space
Res., 27, 1635–1640, 2001.
Soden, B. J. and Bretherton, F. P.: Interpretation of TOVS water vapor radiances in terms of layer-average relative humidities: Method and climatology for the upper, middle, and lower tro-posphere, J. Geophys. Res., 101, 9333–9343, 1996.
Solomon, S., Schmeltekopf, A. L., and Sanders, R. W.: On the in-terpretation of zenith sky absorption measurements, J. Geophys. Res., 92, 8311–8319, 1987.
Solomon, S., Miller, H. L., Smith, J. P., Sanders, R. W., Mount, G. H., Schmeltekopf, A. L., and Noxon, J. F: Atmospheric NO3
1. Measurement Technique and the Annual Cycle, J. Geophys. Res., 94, 11 041–11 048, 1989.
Solomon, S.: Stratospheric Ozone Depletion: A review of concepts and history, Review of Gephysics, 37, 275–316, 1999.
Str¨om, J., Busen, R., Quante, M., Guillemet, B., Brown, P. R. A., Heintzenberg, J.: Pre-EUCREX intercomparison of airborne humidity measuring instruments, Journal of Atmospheric and Oceanic Technology, 11, 1392–1399, 1994.
Stutz, J. and Platt, U.: Numerical analysis and error estimation of Differential Optical Absorption Spectroscopy measurements least-squares methods, Appl. Optics, 35, 6041–6053, 1996. Van Roozendael, M., Fayt, C., Lambert, J.-C., Pundt, I., Wagner, T.,
Richter, A., and Chance, K.: Development of a bromine oxide product from GOME, in Proceedings of the European Sympo-sium on Atmospheric Measurements From Space (ESAMS 99), 18 to 22 Jan., ESTEC, Noordwijk, Netherlands, Rep. WPP-161, 543–547, Eur. Space Agency, Noordwijk, Netherlands, 1999. Velders, G. J. M., Granier, C., Portmann, R. W., Pfeilsticker, K.,
Wenig, M., Wagner, T., Platt, U., Richter, A., and Burrows, J. P.: Global tropospheric NO2column distributions: Comparing 3-D model calculations with GOME measurements, J. Geophys. Res., 106, 12 643–12 660, 2001.
Wagner, T., Otten, C., Pfeilsticker, K., Pundt, I., and Platt, U.: DOAS moonlight observation of atmospheric NO3and NO2in
the Arctic winter, Geophys. Res. Lett, 27, 3441–3444, 2000. Wagner, T., Leue, C., Wenig, M., Pfeilsticker, K., and Platt, U.:
Spa-tial and temporal distribution of enhanced boundary layer BrO concentrations measured by the GOME instrument aboard ERS-2, J. Geophys. Res., 106, 24 225–24 236, 2001.
Wagner, T., von Friedeburg, C., Wenig, M., Otten, C., and Platt, U.: UV/vis observations of atmospheric O4absorptions using direct
moon light and zenith scattered sunlight for clear and cloudy sky conditions, J. Geophys. Res., in press, 2002.
Wenig, M.: Satellite Measurement of Long-Term Tropospheric Trace Gas Distributions and Source Strengths - Algorithm De-velopment and Data Analysis, PhD-Thesis, University of Hei-delberg, Germany, 2001
Wickert, J., Reigber, C., Beyerle, G., K¨onig, R., Marquard, C., Schmidt, T., Grunwaldt, L., Galas, R., Meehan, T. K., Mel-bourne, W. G., and Hocke, K.: Atmospheric sounding by GPS ra-dio occultation: first results fropm CHAMP, Geophys. Res. Lett., 28, 3263–3266, 2001.
Z¨oger, M., Afchine, A., Eicke, N., Gerhards, M.-T., Klein, E., McKenna, D. S., M¨orschel, U., Schmidt, U., Tan, V., Tuitjer, F., Woyke, T., and Schiller, C.: Fast in-situ stratospheric hy-grometers: A new family of baloon-borne and airborne Lyman α photofragment fluorescence hygrometers, J. Geophys. Res., 104, No. D1, 1807–1816, 1999.