DON FRASER, Graduate Studies,
University of British Columbia_
MENTAL ABILITIES OF BRITISH COLUMBIA
INDIAN CHILDREN
Several studies (Jamison & Sandiford, 1928; Turner & Penfold, 1952; Wilson, 1952) have been designed to assess the general intelligence of Canadian Indian children. However, it seems that there has been no attempt to go beyond the measurement of mental age and I.Q. to analyze specific mental abilities of these children.
THE PROBLEM
The purpose of this investigation was to discover whether Indian pupils differ significantly from white pupils and whether urban Indian pupils differ significantly from rural Indian pupils on a number of specific mental abilities as well as on general intelligence. The study was motivated by a concern over the poor achievement and early drop-out common among the British Columbia Indian children who now are being integrated in increasing numbers into public schools. It was felt that remedial help might be more beneficial if the content and method of instruction could be guided by a better knowledge of the Indians' pattern of mental abilities. PROCEDURE
The sample included 62 children of legal Indian status who, at the time of testing, were not over a chronological age of 9.0 years and who were enrolled in grades one, two, three, or special classes of British Colum bia public schools. Twenty-seven of these were urban children who made up 100% of the defined sample as of November 15, 1968, in the Vancouver School District. The other 35 were rural children who made up 100% of the defined sample as of June 30, 1968, in the Merritt School District. It
was assumed that these two districts were representative of urban and rural areas of British Columbia. The urban and rural groups were very evenly matched for age and fairly evenly matched for sex.
The purpose and design of this investigation led almost immediately to a choice of the Stanford-Binet Intelligence Scale Form L-M (Terman &
Merrill, 1960). Meeker (1965, p. 26) has stated some attributes of the Binet for measuring mental abilities. No attempt was made to select a cul ture-fair test because the purpose was to measure abilities which are con sidered important for success in a school system which is culturally loaded in favor of white children.
The Binet was administered to each child by the present investigator only, in order to control for administrative variance. Testing procedure adhered to Terman and Merrill's (1960, Part 2) manual of instructions for administering Form L-M.
Results were obtained for the sample and for each sub-group in the form of mean IQ scores and mean scores on 14 of J. P. Guilford's Structure of Intellect (5.0.1.) ability categories. Behavioral content was not included
CONSEILLER CANADIEN, VOL. 3, No.3, JUIN, 1969
43
because Binet items had not been rated in terms of tbat category (Bonsall
& Meeker, 1963). Guilford's three-dimensional model bas five opera tion categories arranged along one dimension, four content categories along a second dimension, and six product categories along a third dimension. Those readers who are not familiar with the S.O.1. may refer to Guilford apd Hoepfner (1966, pp. 3-4) or Guilford (1967, pp. 60-65) for a descrip tion of each ability category. Many recent textbooks in educational psy chology also have summary descriptions of the categories.
An adaptation of Meeker's (1965) procedure for analysis of Binet responses was used to obtain scores for individuals 00 each S.O.1. ability category. Urban Indian means were then compared with rural Indian means and Indian means were compared with white population norms, which were derived on the basis of the Binet standardization. Detailed accounts of the procedure for the analysis of Binet responses and for the derivation of white population norms are included in the original report of this investiga tion (Fraser, 1969).
HYPOTHESES
1. There are significant differences between Indian children and white children on all S.O.1. ability categories and on IQ.
2. There is no significant difference between urban and rural Indian children on any S.O.1. ability category or on IQ.
3. There are significant differences between both urban and rural Indian children and white children, on their profiles of mean scores on S.O.1. ability categories.
4. There is no significant difference between urban and rural Indian chil dren on their profiles of mean scores on S.O.I. ability categories. Standard t tests were employed to test hypotheses 1 and 2, and Hotel ling's P test (Winer, 1962, pp. 632-635) was used to test hypotheses 3 and 4. Mean scores, standard deviations, t values, and the values of Hotelling's ']'2 statistic were computed at the University of British Columbia computing center.
RESULTS
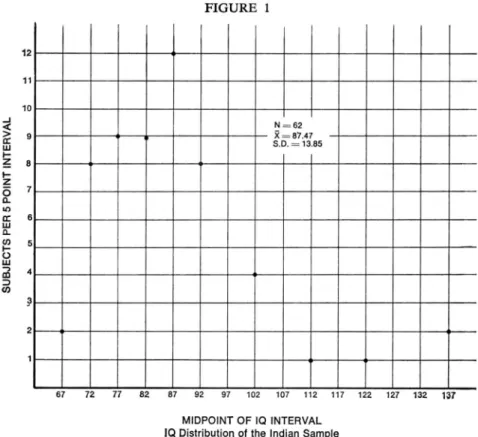
The data on general intelligence are summarized in Table 1, and in the form of a frequency polygon in Figure 2. The IQ scores for the total Indian sample ranged from 68 to 136, with a mean of 87.47 and a standard devi ation of 13.85. Figure 2 shows that although 90% of these scores fell below 100.00, one child scored in the "high average" and two in the "superior" range according to Terman and Merrill's (1960, p. 8) classifica tion. As hypothesized, the difference between the Indian mean and the white population mean of 100.00 was highly significant (p<.OOl).
TABLE I
Means and standard deviations of the IQs for the Indian groups and the white population with t tests of significance.
Group N Mean SD Range
Total Indian 62 87.47 13.85 68-136 -7.03* White population 100.00 16.00 Urban Indian 27 87.37 15.73 68-136 Rural Indian 35 87.54 12.45 68-135 *p
<
.001 -0.05Table I shows that the urban Indian children's IQ scores ranged from 68 to 136, with a mean 87.37 and a standard deviation of 15.73. The rural Indian children's scores ranged from 68 to 135 with a mean of 87.54 and a standard deviation of 12.45. As hypothesized, the difference between these means was not significant.
Table 2 compares the results for the total Indian sample with the norms for the white population on each S.O.I. ability category. As hypothe sized, Indian means were all significantly lower (p<.05) than the white population means. However, as the profile in Figure 2 shows, Indian means were not uniformly low, but, instead, showed a marked differential pattern.
TABLE 2
Means and standard deviations of structure of intellect ability categories and IQ for the Indian sample and means for the white population with
t tests of significance
Indian Sample White Population
Ability Category Mean SD Mean
Cognition (C) 39.68 4.28 44.03 -7.97*** Memory (M) 11.02 2.76 12.03 -2.81 ** Divergent production (D) 3.50 1.84 4.39 -3.75*·* Convergent production (N) 25.32 2.57 28.19 -8.75*" EvaluatIOn (E) 15.65 2.36 17.61 -6.48*** Figural (F) 42.90 3.44 43.87 -2.19* Symbolic (S) 4.66 1.84 5.94 -5.47·** Semantic (M) 48.60 9.23 56.81 -6.87*** Units (U) 31.03 2.75 31.77 -2.11* Classes (C) 9.97 0.88 10.84 -7.73*** Relations (R) 20.32 3.40 21.77 -3.36** Systems (S) 16.21 1.97 17.84 -6.48*** Transformations (T) 7.39 1.93 9.71 -9.37*·* Implications (I) 11.42 3.74 14.68 -6.79*** IQ 87.47 13.85 100.00 -7.03·** *p
<
.05 **p<
.01 ***p<
.001 TABLE 3Means and standard deviations of structure of intellect ability categories and IQ for the urban Indian group and for the rural Indian group with
t tests of significance Ability Category
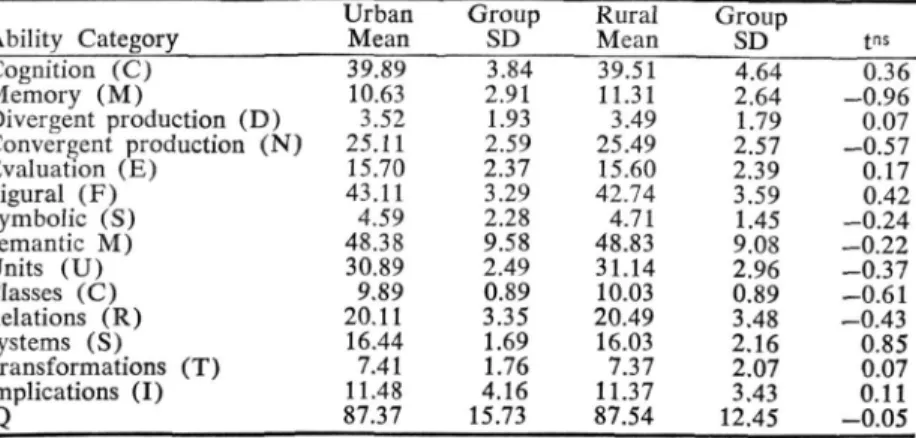
Urban
Mean Group SO Rural Mean Group SD tns
Cognition (C) Memory (M) Divergent production (D) Convergent production (N) EvaluatIon (E) Figural (F) Symbolic (S) Semantic M) Units (U) Classes (C) Relations (R) Systems (S) Transformations (T) Implications (I) IQ 39.89 10.63 3.52 25.11 15.70 43.11 4.59 48.38 30.89 9.89 20.11 16.44 7.41 11.48 87.37 3.84 2.91 1.93 2.59 2.37 3.29 2.28 9.58 2.49 0.89 3.35 1.69 1.76 4.16 15.73 39.51 11.31 3.49 25.49 15.60 42.74 4.71 48.83 31.14 10.03 20.49 16.03 7.37 11.37 87.54 4.64 2.64 1.79 2.57 2.39 3.59 1.45 9.08 2.96 0.89 3.48 2.16 2.07 3.43 12.45 0.36 -0.96 0.07 -0.57 0.17 0.42 -0.24 -0.22 -0.37 -0.61 -0.43 0.85 0.07 0.11 -0.05
CONSEILLER CANADIEN, VOL. 3, No.3, JUIN, 1969
45
FIGURE 1 12 11 10 ...J N=62 > 9 )(=87.47«
a: 5.0.=13.85 W I ~ 8 I Z 0 7 a. It) a: 6 W a. (fJ 5 I 0 W...,
4 III ~ (fJ ;l 2 67 72 77 82 87 92 97 102 107 112 117 122 127 132 la1 MIDPOINT OF IQ INTERVAL IQ Distribution of the Indian SampleTable 3 shows the means and standard deviations for the urban Indian group and the rural Indian group on each ability category. As hypothesized, there were no significant differences between the two groups on any of the categories. The urban group scored slightly higher on seven of the cate gories and the rural group scored slightly higher on the other seven.
TABLE 4
Hotelling's T2 test for differences between profiles of the mean scores on structure of intellect ability categories including critical values (CY)
Group r/ob CY.oo CY'Ol
Urban Indian 27 690.72* 75.32 106.40 White population Rural Indian 35 1318.27* .54.54 80.00 White population Urban Indian 27 25.62 34.13 44.50 Rural Indian 35 *p
<
.01Table 4 shows the results of Rotelling's T2 test for differences between the profiles of the mean scores on 14 S.O.I. ability categories. As hypothe sized, the differences between the urban Indian profile and the white popu
lation and between the rural Indian profile and the white population were both highly significant (p <.01). As hypothesized, no significant difference was found between the profile for the urban Indian group and the rural Indian group.
DISCUSSION AND CONCLUSIONS
The low IQ results for Indian children support the previous findings of Jamison and Sandiford (1928), Turner and Penfold (1952), and Wilson (1952). The results do not necessarily mean that these children are less intelligent than white children, but they do suggest that Indian pupils are less well eqUipped with the kind of ability which seems important to do well in a learning situation which is geared for white children.
It is not part of the present investigation to explain why some Indian children obtained much higher IQ scores than others. It is interesting to note, however, that the seven children whose IQ exceeded 100.00 were evenly divided according to sex and according to urban-rural location. One
FIGURE 2
,
I I 1 I r
0.0 - -- - - --
--
- - BASE LINE FOR COMPARISON - - -- -- - -
-0.1 -0.2 .05 LEVEL -0.3 .01 ~EVEL -0.4'"
.001 LEVEL ~ ·0.5 o () ~ -0.6'"
~ ·0.7..
z ~ -0.8 -0.9 I -1.0 -1.1 -1.2 -1.3I
F C M 0 N S M U C R S T I EI
I'Q
OPERATIONS CONTENTS PRODUCTS N==62
Structure of Intellect abilities and IQ of the Indian sample compared with the means in
the nonn group which established the standardized scores in the S.O.I. instrument. The dotted
line across the top of the figure indicates the standardized mean for each ability category of the S.O.I., and for the Stanford-Binet IQ instrument. Mean scores for the Indian sample are indicated by dots above the abbreviation (along the bottom of the figure) for ability cate gories and for the IQ. The horizontal solid lines represent confidence levels: dots appearing between the lines for .05 and .01 confidence-level lines indicate that on these 2 ability cate gories, Indian mean scores are significantly lower than the mean of the norm group beyond the .05 level of confidence. Similarly, the 2 dots between the .01 and .001 confidence-level lines indicate Indian mean scores lower than the mean of the norm group beyond the .01 level, and the remaining dots indicate Indian means lower than the norm group beyond the .001 level of confidence. For example, the Indian children score, on the average, lowest-and farthest from the norm-group mean-<>n ability category T (Transformations), and highest and nearest the norm-group mean-on ability category U (Units). Both differences are signifi cant beyond the .05 level of confidence, but the first indicates a far greater difference (over one standard deviation) than the second.
CONSEILLER CANADIEN, VOL. 3, No.3, JUIN, 1969
47
half of them were full blooded Indians, the other half were of mixed blood, and all lived on reserve land.
The striking similarity between urban Indian and rural Indian IQ's indicates that, in the case of British Columbia Indian children, this differ ence in location is likely a relatively unimportant factor.
The results on 8.0.1. ability categories (Figure 2, Table 3) are possibly of more potential value to Indian education than are the IQ results. They imply that (1) Indian children need more remedial help on tasks which involve what seem to be particularly weak abilities: namely cognition, con vergent production, and evaluation operations; symbolic and semantic con tents; and production of classes, systems, transformations, and implications. (2) Indian children need less extra practice on tasks which involve what seem to be relatively strong abilities: namely memory and divergent pro duction operations; figural content; and production of units and relations.
(3) Remedial programs designed for poorly achieving white children are not likely to be appropriate for Indian children who are also poor achievers.
It is not part of the present study to investigate why some Indian abili ties were relatively weak while others were relatively strong compared to white abilities. It might be hypothesized, for example, that the low semantic score and high figural score in contents are a result of a lack of pre-school practice with the English language. Further research might be designed to test such a hypothesis.
The similarity between the urban Indian and the rural Indian group on each 8.0.1. ability category as well as on their profiles of ability cate gories indicates that the differential pattern of abilities for the total Indian sample (Figure 2) could be used as a guide for implementing remedial practice, regardless of whether the children lived in urban or rural areas.
Further research might determine whether remedial practice, fitted to the Indian pattern of 8.0.1. abilities which was demonstrated in this inves tigation, would, in fact, help close the present gap between the Indian and white levels of school achievement.
REFERENCES
Bonsall, M. R., & Meeker, M. Structure of intellect components in the Stanford Binet form L-M-experimental draft no. 3. Unpublished manuscript, Los Angeles County Schools, 1963.
Fraser, W. D. Mental abilities of British Columbia Indian Children. Unpublished master's thesis, University of British Columbia, 1969.
Guilford, J. P. The nature of human intelligence. New York: McGraw-Hill, 1967. Guilford, J. P., & Hoepfner, R. Structure of intellect factors and their tests, 1966. Reports from the Psychological Laboratory, University of Southern California,
1966, No. 36.
Guilford, J. P., & Merrifield, P. R. The structure of intellect model: Its uses and implications. Reports from the Psychological Laboratory, University of Southern California, 1960, No. 24.
Jamison, E., & Sandiford, P. The mental capacity of Southern Ontario Indians. Journal of Educational Psychology, 1928, 35, 536-551.
Meeker, M. A procedure for relating Stanford Binet behavior samplings to Guil ford's structure of intellect. Journal of School Psychology, 1965, 3(3), 26-36.
Terman, L. M., & Merrill, M. A. Stanford-Binet intelligence scale, manual for the third revision, form L-M. Cambridge, Mass.: Houghton MifHin, 1960.
Terman, L. M., & Merrill, M. A. Stanford-Binet test kit form L-M, 1960 revision. Boston: Houghton Mifflin, 1960.
Turner, G. H., & Penfold, D. J. The scholastic aptitude of the Indian children of the Carodoc reserve. Canadian Journal of Psychology, 1952, 6, (3), 31-44. Wilson, L. A comparison of the Raven Progressive Matrices (1947) and the
performance scale of the Wechsler Intelligence Scale for Children for assessing the intelligence of Indian children. Unpublished master's thesis, University of British Columbia, 1952.
Winer, B. J. Statistical principles in experimental design. New York: McGraw·Hill, 1962.
LES CAPACITIES INTELLECTUELLES DES ENFANTS INDIENS D'AMERIQUE DE LA
COLOMBIE-BRITANNIQUE DON FRASER
Cette investigation a pour but de comparer Ie quotient d'intelligence et les capacites inteUectueUes specifiques des enfants Indiens avee eeux des enfants blanes, et aussi de comparer les enfants Indiens des villes avec ceux des Indiens de la campagne.
Les resultats reveIent que les enfants Indiens obtiennent un nombre de points definitivement inferieur acelui des enfants blancs sur trois points: Ie quotient d'intelligence (p < .001), chaque niveau des categories de capacite d'apres la Structure d'lntelligence de Guilford (p< .05), et enfin l'analyse (Ie tableau des donnees) des categories de capacite base sur la Structure d'lntelligence (p <.01).
D'autre part, la meme comparaison entre les enfants Indiens des villes et les enfants Indiens de la campagne ne montre nulle difference significative, statistiquement par/ant.
L'auteur suggere que l'on developpe de meilleurs programmes repara teurs pour les enfants Indiens en suivant les elements des pouvoirs et des faiblesses montres par Ie tableau Indien des capacites selon la Structure d'Intelligence de Guilford.