HAL Id: hal-02476029
https://hal.archives-ouvertes.fr/hal-02476029
Submitted on 12 Feb 2020
HAL is a multi-disciplinary open access
archive for the deposit and dissemination of
sci-entific research documents, whether they are
pub-lished or not. The documents may come from
teaching and research institutions in France or
abroad, or from public or private research centers.
L’archive ouverte pluridisciplinaire HAL, est
destinée au dépôt et à la diffusion de documents
scientifiques de niveau recherche, publiés ou non,
émanant des établissements d’enseignement et de
recherche français ou étrangers, des laboratoires
publics ou privés.
Unsteady flows measurements using a calorimetric wall
shear stress micro-sensor
Cécile Ghouila-Houri, Abdelkrim Talbi, Romain Viard, Quentin Gallas, Eric
Garnier, Alain Merlen, Philippe Pernod
To cite this version:
Cécile Ghouila-Houri, Abdelkrim Talbi, Romain Viard, Quentin Gallas, Eric Garnier, et al..
Un-steady flows measurements using a calorimetric wall shear stress micro-sensor. Experiments in Fluids,
Springer Verlag (Germany), 2019, 60 (4), pp.1-10. �10.1007/s00348-019-2714-5�. �hal-02476029�
(will be inserted by the editor)
Unsteady flows measurements using a calorimetric
wall shear stress micro-sensor
Cecile Ghouila-Houri · Abdelkrim
Talbi · Romain Viard · Quentin Gallas · Eric Garnier · Alain Merlen · Philippe Pernod
Received: date / Accepted: date
Abstract A microscale low power high temperature gradient calorimetric (HTGC) sensor measuring both mean and fluctuating bidirectional wall shear stress is presented. The micromachined sensor is composed of three free-standing 3 µm × 1 mm micro-wires mechanically supported using perpendic-ular micro-bridges. The static and dynamic characterisations were performed in a turbulent boundary layer wind tunnel on a flat plate configuration, and compared to the one obtained with a conventional hot-film probe. The results demonstrated that the calorimetric sensor behaves similarly to the hot-film in constant temperature anemometry with nonetheless lower power consumption and better spatial resolution and temporal response. Additionally, its calori-metric measurement detected the direction of the wall shear stress component orthogonal to the wires, corresponding to the shear stress sign in 2D flows. The
Cecile Ghouila-Houri
Univ. Lille, CNRS, Centrale Lille, ISEN, Univ. Valenciennes, UMR 8520 – IEMN, LIA LICS/LEMAC, F-59000 Lille, France
DAAA, ONERA The French Aerospace Lab, Lille, 59014, France
Univ. Lille, CNRS, ONERA, Arts et M´etiers Paris Tech, Centrale Lille, Laboratoire de M´ecanique des Fluides de Lille – Kamp´e de F´eriet, F-59000, Lille, France
E-mail: [email protected] Abdelkrim Talbi, Alain Merlen, Philippe Pernod
Univ. Lille, CNRS, Centrale Lille, ISEN, Univ. Valenciennes, UMR 8520 – IEMN, LIA LICS/LEMAC, F-59000 Lille, France
E-mail: [email protected] Romain Viard
Fluiditech/Thurmelec, 68840 Pulversheim, France Quentin Gallas
DAAA, ONERA The French Aerospace Lab, Lille, 59014, France
Univ. Lille, CNRS, ONERA, Arts et M´etiers Paris Tech, Centrale Lille, Laboratoire de M´ecanique des Fluides de Lille – Kamp´e de F´eriet, F-59000, Lille, France
Eric Garnier
calibrated HTGC micro-sensor was then used for unsteady flow separation de-tection downstream a 2D square rib for Reh = 2.56 × 10⁴. The calorimetric
micro-sensor enabled self-correlated measurements and consequently success-fully achieved the detection of flow separation and the reattachment point around x/h = 10.7.
Keywords Wall shear stress sesor · MEMS sensor · Flow control · Flow separation
1 Introduction
Controlling complex flow phenomena provides a solution for reducing the im-pact of vehicles on the environment leading to both a reduction in consump-tion and a improvement of aerodynamic performances. The accurate measure-ment of wall shear stress in turbulent flows is necessary as it is directly linked to flow phenomena such as flow separation and reattachment or the lami-nar/turbulent transition. In high Reynolds number flows, the length scale of coherent structures is in the order of dozens of microns or less leading to the demand of sensors with sensitive elements on the same range of size (Chan-drasekaran 2005 [4]). In addition, a bandwidth of several kilohertz is necessary to capture the complete turbulent spectrum (Lofdhal and Gad-el-Hak 1999 [14], Chandrasekaran 2005 [4]). Micro-Electro-Mechanical Systems (MEMS) are adequate solutions and wall shear stress micro-machined sensors have been broadly developed, working on direct or indirect measurement principle. Direct shear stress sensors are floating-element devices employing piezoresistive (Bar-lian 2007 [2]) or capacitive (Chandrasekharan 2011 [5]) transduction mecha-nisms. Indirect wall shear stress sensors are usually referred as thermal sensors and are based on heat transfer between a thermo-resistive hot wire and the flow.In aerodynamics, two different technologies are used: wire and hot-film sensors, both compatible with MEMS technology. For hot-wires, the wire is located in the flow field and is only fixed on both extremities. These sensors are useful to measure the flow velocity within the flow field (Bailey 2010 [1], Talbi 2015 [18]) or close to the wall (Lofdhal 2003 [13]). Miniaturization re-duces the thermal inertia and improves the frequency response of such systems. However these sensors are fragile and intrusive. For hot-film sensors, the wire is deposited on a substrate. Designed for surface mounting, these sensors are used for shear stress measurement. However, their bandwidth is determined by the thermal inertia of the substrate. To reduce this impact, Sheplak 2002 ([17]) or Xu 2003 ([21]), for example, developed membrane based hot-film sensors.
Most studies on thermal flow MEMS sensors present the sensor calibration in flat plate configuration and just a few of them use the MEMS sensors to detect complex flows such as flow separation (Xu 2003 [21],Buder 2008 [3], Leu 2016 [11]). Xu et al (Xu 2003 [21]) used a cylinder model with an array of MEMS hot-film sensors. This skin based array is mounted on a semicylindrical aluminum bloc whose angle of attack is changed. The 16 shear stress hot-film sensors composing the array achieved to measure the shear stress variation for
different angles and velocities and thus to detect the flow separation point. Leu et al (Leu 2016 [11]) used a 25 hot-film micro-sensors array to study unsteady flow above a pitching wind turbine blade. Buder et al (Buder 2008 [3]) devel-oped wall mounted hot-wire micro-sensors for detection the flow separation on an airfoil model.
Besides, direction sensitive thermal sensors have also been developed using what is called the calorimetric effect. Theses sensors are composed of a heater and two (or more) temperature detectors on both sides (Kuo 2012 [10]). These sensors have mostly been designed and fabricated for gas sensing and mass-flow measurements (Furges 2004 [6] Vereshchagina 2015 [19]) and they are usually film-based sensors or membrane-based sensors.
In this paper, we present aerodynamic experiments using a high tempera-ture gradient calorimetric (HTGC) micro-sensor designed for shear stress mea-surement and flow separation detection. The purpose of the sensor design was to combine a thermal microstructure developed by Viard 2013 [20] and calori-metric concept. The HTGC micro-sensor is composed of wall-mounted free-standing nickel-platinum micro-wires, and is thereby a compromise between hot-films and hot-wires. It enhances forced convection compared to classical hot-film sensors. Moreover, two cold wires are placed on both sides of the heater providing a single component calorimetric measurement for the detec-tion of the flow direcdetec-tion in addidetec-tion to the measurement of the wall shear stress amplitude. Thereby it can detect the sign of the wall shear stress com-ponent orthogonal to the wires. This paper is divided in three parts. The first one shortly describes the design and fabrication that have been more precisely presented before (Ghouila-Houri 2016 [7], Ghouila-Houri 2017 [8]). The second part presents the testing in wind tunnel with the measurement of the mean wall shear stress, the detection of the flow direction and the measurement of the turbulent spectrum. In the third part we used the HTGC micro-sensor in parallel with a conventional hot-film sensor to study the unsteady separated and reattaching turbulent flow downstream a two-dimensional square rib. The comparison demonstrated the advantage provided by the HTGC micro-sensor that detected instantaneously the flow separation and reattachment. The re-sults provided the first experimental shear stress measurements (amplitude and sign) on this configuration.
2 The HTGC micro-sensor design and characteristics
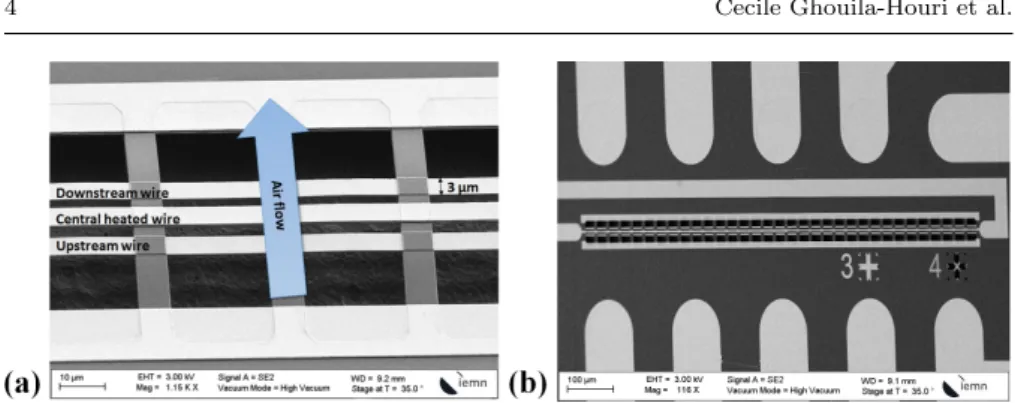
The design of the thermal microstructre was upgraded from the first version of Viard et al (2013 [20]). It is composed of three micro-wires separated from the substrate by an underneath cavity, and mechanically supported by per-pendicular micro-bridges. The three wires are 3 µm × 1 mm and less than 1 µm high. The micro-bridges are 7 µm × 30 µm and 500 nm high. The cavity is about 20 µm deep.
Fig. 1 (a) SEM image focused on the HTGC micro-sensor sensitive part along with legend and schematic (b) SEM image of the complete sensitive part of the HTGC micro-sensor
The choice of a three wires solution is originated in calorimetric sensors. Calorimetric sensors are composed of a hot-wire as heating element (or heater) and two temperature detectors located on both sides of the heater. They mea-sure the difference of temperature between the two detectors as a function of the flow rate. Here, the two detectors are cold micro-wires measuring the temperature 3 µm away from the heater. The total of three micro-wires are set in parallel one to another and perpendicularly to the flow (Figure 1 (a)). The objective of this design is to measure the shear stress amplitude with the heater and to detect the flow direction with the lateral cold-wires. Indeed, the upstream wire is more cooled than the downstream one and the difference of temperature between them states the flow direction.
Manufacturing the HTGC micro-sensors needed a set of standard semi-conductor micromachining techniques precisely described on previous work (Ghouila-Houri 2016 [7]). Only five technological steps were necessary to com-plete the fabrication of more than a hundred of HTGC micro-sensors on a 3 inches diameter silicon wafer. First, the fabrication of the measurements cold-wires was made in Ni/Pt by lift-off technique. The second step was the deposition of the insulator SiO2layer and the fabrication of the heater, made
of gold, by lift-off. The third step was the micro-bridges fabrication by etching the SiO2 layer. The fourth one consisted in depositing contact pads by lift-off.
The final step opened the cavity by etching the substrate. As shown on in Fig-ure 1 (b), each sensor chip is composed of the sensing element (the three wires and the micro-bridges over the cavity) and contact pads partially visible on the Scanning Electron Microcopy (SEM) picture. The surface micromachining process allows the microstructure to be non intrusive and flush mounted unlike hot-wire probes.
The operating principle of the HTGC micro-sensor is similar to the con-ventional thermal anemometry. An electric current supplies the heater and heats it above the fluid temperature. Working in constant temperature (CT) mode, the heater temperature is maintained constant by a closed-loop regu-lation on the heating current. In HTGC micro-sensors, heating and measure are uncoupled. The current regulation is based on the central Ni/Pt
multi-Fig. 2 (a) Zero pressure gradient turbulent boundary layer wind tunnel (b) HTGC micro-sensor and hot-film probe flush-mounted on the wind tunnel wall
layer thermistor temperature although the heating current heats the Au layer. Therefore, purpose-built CT circuits (see Ghouila-Houri 2018 [9]) have been designed and manufactured for testing the HTGC micro-sensors.
The thermal coefficient of resistance (TCR) of the HTGC micro-sensor was measured close to 2400 ppm/˚C. The temperature rise coefficient was measured at 9˚C/mW for the central element and 5˚C/mW for the lateral elements (Ghouila-Houri 2017 [8]). Therefore only 7 to 10 mW are required for the HTGC micro-sensor to work efficiently compared to 100 et 300 mW for conventional hot-film sensors. Furthermore, due to the high aspect ratio of the wires, mechanical characterizations were performed by simulation on COM-SOL Multiphysics.The mechanical resonance of the structure was evaluated at more than 1 MHz.
3 Measurements in turbulent boundary layer
Then, wind tunnel experiments evaluated the performances of the HTGC micro-sensors for mean and fluctuating wall shear stress measurements. The experiments were performed on a controlled turbulent boundary layer wind tunnel with zero pressure gradient (figure 2(a)). The test section is 300 × 300 mm2in cross section and 3 m in length.
The HTGC micro-sensor is flush-mounted in the wind tunnel wall on a plexiglas plug, as shown in figure 2 (b). Electrical contacts are welded on a flexible band using gold-wire micro-bonding technique that ensured that the sensing part was perfectly flush-mounted, unlike in previous work (Ghouila-Houri 2017 [8]) where the micro-sensor was slightly under the wall, in a small cavity due to front side welding. The wire bond is 15 µm high.
The measurements were compared to measurements obtained using a com-mercially available Dantec hot-film probe 55R47, also mounted in the wind tunnel wall. The hot-film sensitive element was 100 µm wide for 900 µm long. The mean flow is two-dimensional at the sensors position, which is far from the lateral walls of the wind tunnel. During the calibrations, the velocity
measurement in the center of the wind tunnel test section is performed using a hot-wire probe. This probe is at the same distance from the wind tunnel entry as the micro-sensor and the hot-film.
Hot-wire probe measurements provided the velocity profile of the boundary layer for nominal free-stream velocities U∞ going from 10 to 35 m/s. At the
sensors position, the boundary layer is characterized by a shape factor H = 1.29 and a thickness δ = 19 mm.. The experimental momentum thickness θ is deduced from the velocity profile for each U∞. The relation of
Coles-Fernholz in equation 1 was then used to evaluate the skin friction coefficient Cf (Nagib 2007 [16]). The H factor value demonstrated that the boundary
layer was canonical and that equation 1 could be used. The wall shear stress τ and the wall velocity Uτ were finally deduced from relations 2 and 3, valid
for incompressible flows.
Cf = 2 ( 1 k ln(Reθ) + C) −2 (1) with k = 0.384, C = 4.127. : τ = 1 2 ρ U 2 ∞ Cf (2) and Uτ= U∞ r Cf 2 (3)
This method links the hot-wire measurements at the center of the wind tunnel test section with the shear stress or the wall velocity, with an uncer-tainty less than one-tenth.
Static calibrations were performed for U∞ ranging from 0 to 38 m/s
cor-responding to wall shear stress τ ranging 0 to 2.5 Pa in amplitude and wall velocity Uτ going up to 1.5 m/s. The time-averaged CT voltage Vh of the
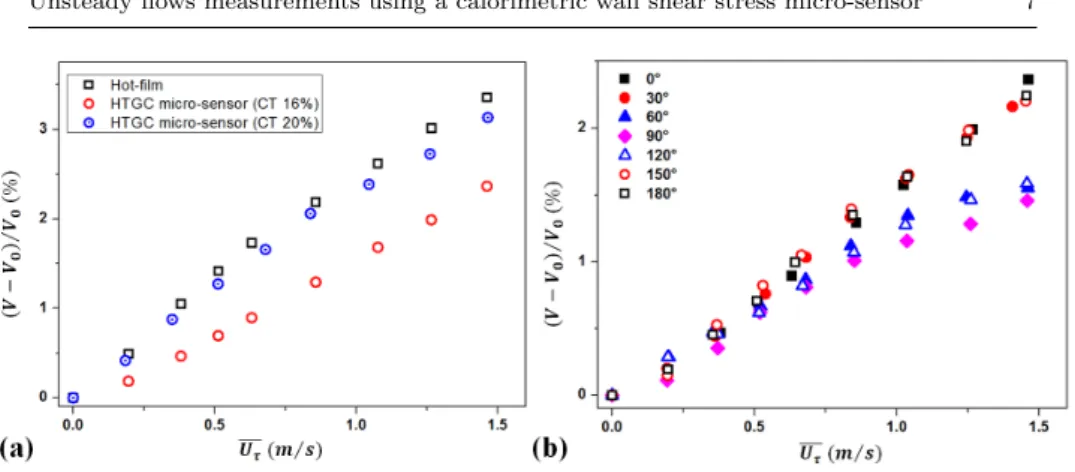
HTGC micro-sensor heating current corresponds to the measured wall shear stress amplitude as in classical thermal anemometry. The output voltage for each value of τ for both the HTGC micro-sensor (considering the central wire only) and the hot-film probe, is shown on the calibration curves in figure 3 (a). Two values of overheat (OH) are considered for the HTGC micro-sensor: the maximum available OH at 20% (about 90˚C) and the OH at 16% (about 70˚C). This last one is the one used for the other experiments presented in this paper. It can be seen that the HTGC micro-sensor reaches a sensitivity very close to the one of the hot-film probe for the maximum OH (20%), despite the reduction of the sensitive element width from 100 µm (hot-film) to 3 µm (HTGC micro-sensor). Even the results with the OH at 16% present a signif-icant sensitivity considering the fact that the wire temperature is twice lower than the hot-film temperature. Moreover, thermal losses due to conduction into the kapton foil of the hot-film probe are part of the hot-film sensitivity and are not separable from the heat transfer by forced convection with the fluid. On the contrary, the suspended structure of the HTGC micro-sensor avoid this issue: the heat losses from the micro-bridges are negligible
Fig. 3 (a) Calibration curves of the HTGC micro-sensor and the hot-film probe (b) Flow direction influence on the HTGC micro-sensor central wire sensitivity
due to the fact that they are suspended, as it was shown using thermal imaging in previous work (Ghouila-Houri 2017 [8]). Therefore, the assumption that the whole sensitivity of the HTGC micro-sensor is entirely due to forced convec-tion with the fluid is valid. One can also note that the mounting system with wire bonding allowed a doubled sensitivity compared to what was reported in previous work (Ghouila-Houri 2017 [8]).
The figure 3 (b) presents the influence of the flow direction on the HTGC sensor central wire response. It has to be noted that the HTGC micro-sensor is designed to work perpendicularly to the flow. As shown on fig-ure 3 (b), the HTGC micro-sensor allows a large range of angles for which the sensitivity remains maximum. Indeed the results at 0˚, 180˚, 30˚ and 150˚ are merged meaning that the HTGC micro-sensor is highly sensitive for ± 30˚ around the ideal position (perpendicular to the flow). For 60˚ and 120˚ in one hand and 90˚ on the other hand, the calibration curve is different for the same shear stresses and measurement needs precaution. Figure 4 (a) presents the voltage difference between the two lateral wires as a function of the flow direction, for various values of wall velocities.Thanks to the TCR relation, the voltage difference is directly linked to the tempera-ture difference between the two lateral cold-wires. At 0˚ and 180˚ the flow direction is perpendicular to the wires and the differences of temperature are respectively negative minima and positive maxima for the different values of wall velocity. On the contrary, at 90˚, the flow direction is parallel to the wires and the difference of temperature is null for all wall velocities, because the two lateral wires are both cooled identically. In 2D flows, one can only consider the responses for 0˚ and 180˚ corresponding to negative and positive shear stresses or wall velocities.
In figure 4 (b) is presented the full HTGC microsensor response for -2.4 Pa ≤ τ ≤ -2.4 Pa. It combines the responses from both the central wire and the lateral wires. The CT voltage central wire response gives the measurement
Fig. 4 (a) Voltage difference between the two lateral wires as function of the flow direction for various Uτ (b) HTGC micro-sensor response to positive and negative wall shear stress
of the wall shear stress amplitude. The lateral wires difference of temperature gives the flow direction detection, that is to say the wall shear stress sign in 2D
mean flows.
The evaluation of the power spectral density (PSD) G(f ) gave the HTGC micro-sensor dynamic response to turbulence. The Welch’s method was used with a Hamming type window. Acquisition was performed at high frequency (100 kHz). Figure 5 presents the frequency weighted spectrum obtained at maximum wall velocity Uτ = 1.48 m/s. The black line is the central wire
response working in CT, and is to be compared to the hot-film response (gray line). Up to 10 kHz, the two responses are mingled: the amplitude increases up to 2 kHz after which starts decreasing. After 10 kHz, the hot-film electronics cuts rapidly and gives no information on the turbulent structures. On the contrary, the HTGC micro-sensor provides information on the fluid dynamics up to 13.5 kHz. It then shows an electronic resonance peak at altering the results after 13.5 kHz.
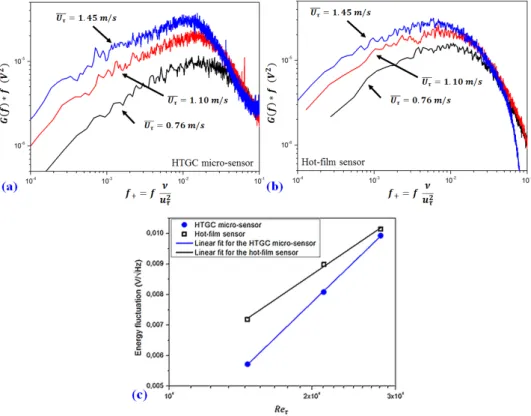
In figure 6 (a) and (b), the frequency weighted PSD was measured for different values of Uτ by both sensors and expressed as function of f+= fUν2
τ
, as in Mathis et al (Mathis 2013 [15]). The HTGC micro-sensor curves show a peak at f+= 0.012, close to 0.01 found by Mathis et al. On the contrary, the
hot-film sensor barely gives a peak at 0.007 and for 1.45 m/s, the amplitude after f+= 0.02 falls rapidly.
Figure 6 (c) presents the fluctuation magnitude of voltage as a function of log(Reτ). The slope was determined with the three measurements for both
sensors. Its value is 0.015 for the HTGC micro-sensor and 0.0106 for the hot-film. In the paper of Mathis et al (Mathis 2013 [15]), the slope was calculated at 0.018.
The complete set of flat plate characterisations of the HTGC micro-sensor demonstrated its ability to compete with conventional shear stress hot-film sensors, in terms of sensitivity and bandwidth, and also to provide additional
Fig. 5 Frequency weighted Power Spectral Density for Uτ = 1.48 m/s measured by the
HTGC micro-sensor central wire and the hot-film
Fig. 6 Frequency weighted Power Spectral Density for Uτ= 0.76, 1.10, 1.45m/s, measured
by (a) the HTGC micro-sensor central wire and (b) by the hot-film sensor. (c) Energy fluctuations as a function of log(Reτ) for the HTGC micro-sensor and the hot-film sensor
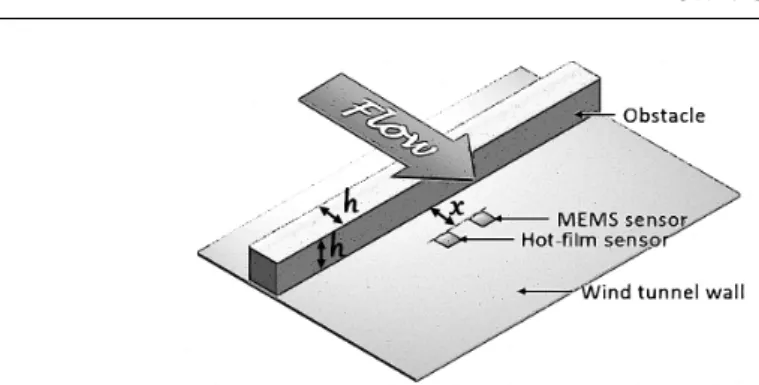
Fig. 7 Schematic of the experimental setup with the HTGC micro-sensor and the hot-film sensor downstream the 2D square rib
information on the wall shear stress sign which is particularly interesting for flow separation detection.
4 Unsteady flow separation and reattachment downstream a 2D square rib
A turbulent boundary layer flow over a surface-mounted rib leads to a strongly separated and reattaching flow. Previous studies established that the time-averaged recirculation length downstream the rib depends on the ratio of the boundary layer thickness δ and the rib height h and the ratio of the streamwise rib width w to the rib height (Liu 2008 [12]).
Experiments were performed in the same turbulent boundary layer wind tunnel as for previous flat plate experiments but at a different location where δ = 15 mm. A 2D square rib with height h = 19 mm was flush-mounted. The hot-film and the HTGC micro-sensor were placed downstream the rib, at a distance x from it, as shown in figure 7. The aspect ratio between the test-section height and h being larger than 12, the mean turbulent flow over the rib could be assumed two-dimensional along the centerline. The ratio δ/h = 0.8. It has to be noted that previous experimental studies on this configuration were only performed using pressure sensors like the work of Liu et al (Liu 2008 [12]). For the experiments presented in this paper, performed with shear stress sensors, only averaged results like the recirculation length can be compared to literature.
The experiments aimed at detecting the recirculation bubble length and study the unsteady flow downstream the rib. For this purpose, the distance x between the rib and the sensors was increased from x/h = 0.5 to x/h = 20, by moving the rib away from the sensors. The experiments were performed at constant main-stream flow velocity leading to a Reynolds number based on h of Reh= 2.56 × 10⁴.
Figure 8 (a) and (b) and the combined figure 9 present the time-averaged measurements, normalized by the measurement on the flat plate configuration for the same flow velocity. In figure 8 (a), the time-averaged shear stress
mea-Fig. 8 (a) Time-averaged shear stress measurements with the HTGC micro-sensor central wire (circles) and the hot-film (square symbols) for Reh= 2.56 × 10⁴ and for x/h going
from 0.5 to 20 (b) Time-average difference of resistance between the two lateral wires
Fig. 9 Time-averaged HTGC response combining the central wire response and the lateral wires response for Reh= 2.56 × 10⁴and for x/h going from 0.5 to 20
surements performed by both the HTGC micro-sensor central wire and the hot-film sensor are displayed. The two sensors present matching tendencies with an increased shear stress amplitude up to x/h = 5.5 then a decrease amplitude until x/h = 10.5 and finally an increase up to x/h = 20, final measurement point.
Figure 8 (b) displays the voltage difference between the HTCG micro-sensor lateral wires. On this configuration, positive values of voltage difference indicates a flow direction being the same as the main flow, and negative val-ues show back flow. Thereby the results clearly identify a reattachment point between x/h = 10.5 and x/h = 11, around x/h = 10.7. For a comparison, for a smaller Reynolds number Reh= 1.32 × 10⁴ but a close ratio δ/h, Liu et al
(Liu 2008 [12]) found a recirculation length of 9.75h. Figure 9 combines the amplitude measurement made by the HTGC micro-sensor central wire and the flow direction measurements by the HTGC micro-sensor lateral wires. On this
figure, the inversion appears clearly between x/h = 10.5 and x/h = 11 and is abrupt. As expected, for x/h > 11 the mean friction relaxes smoothly toward the one of the flat plate. Contrary to the HTGC micro-sensor, the hot-film sensor is unable to certify that the diminution of amplitude up to x/h = 10.5 is due to the flow reattachment.
In addition, the results at x/h = 0.5 enlighten the small eddy close to the rib with an inversed direction compared to the separation bubble and this presenting small amplitude shear stress in the main flow direction. One can notice that the measurement of this ”positive” eddy was made possible only because the HTGC micro-sensor detected the sign of the wall shear stress. Con-ventional hot-film technology cannot detect this eddy from the recirculation bubble. The comparison of the HTGC micro-sensor and the hot-film demon-strated the advantage of the HTGC micro-sensor that precisely detected the different zones of interest in the flow.
The large bandwidth of the HTGC micro-sensor enabled to study the dy-namics of the unsteady flow downstream the rib. Figure 10 displays the energy of voltage fluctuations normalized by the flat plate case for all distances x/h. These values were obtained by integrating the power spectral density on the frequency range of the HTGC micro-sensor. Different areas appear as function of x/h. For x/h < 3, the energy is less important than in flat plate up to x/h = 3 where it reaches the flat plate level. Then the energy of fluctuations increases reaching a maximum in x/h = 7. This maximum also corresponds to the maximum in time-averaged measurements in figure 9. After this point, the energy decreases until the flow is reattached. A peak in energy appears for x/h = 10.5, close to the reattachment point, as compared to x/h = 10 and x/h = 11, highlighting the reattachment as a fluctuating zone. For x/h > 11, the energy of fluctuations increases again and is kept as a higher lever than the flat plate configuration.
This figure shows that separation induces an energetic turbulent flow down-stream the rib once a minimum distance of 3h is passed.The energy is sensitive to the events occurring in the flow, namely the maximum of the recircula-tion bubble and the reattachment point. The highly energetic reattached flow means that the turbulent separated flow energy is transmitted along the down-stream flow and consolidated after reattachment.
5 Conclusions
This paper presented a high temperature gradient calorimetric micro-sensor designed for bidirectional wall shear stress measurement, and aiming flow sepa-ration detection for flow control applications. Although the technology was pre-cisely described in previous work (Ghouila 2017 [8]), the first part of this paper recalled the design and main functional characterisation. It highlighted the hy-brid micro-structure with suspended wall-mounted micro-wires supported by micro-bridges, the micro-scale dimensions, the calorimetric structure and the electro-thermal performances of the device. The second part of the paper dealt
Fig. 10 Energy of voltage fluctuations downstream the rib normalized by the energy ob-tained in flat plate, for Reh= 2.56 × 10⁴ and for x/h going from 0.5 to 20
with wall shear stress calibration in a turbulent boundary layer wind tunnel. The experiments conducted in a turbulent boundary layer wind tunnel demon-strated the HTGC micro-sensor performances, competing with conventional commercially available sensor. They demonstrated also the micro-sensor par-ticularity to measure bidirectional wall shear stress and detect flow direction. Wall turbulence measurements were performed up to 13.5 kHz. Ongoing work is currently improving the electronics performances to enlarge the bandwidth. With a lower power of consumption and a 30 times smaller sensitive element, the HTGC micro-sensor performs a better spatial and temporal resolution compared to commercially available hot-film probes. The HTGC micro-sensor was then employed for studying the unsteady separation of turbulent flow downstream a 2D square rib at Reh= 2.56 × 10⁴. The reattachment point was
measured around x/h = 10.7, the maximum of the recirculation bubble was detected at x/h = 7 and the small eddy close to the rib wall was also measured at x/h = 0.5. The turbulent spectra of the unsteady flow was measured in dif-ferent x/h points capturing the evolution of turbulence energy downstream the rib and highlighting the maximum fluctuation energy for x/h = 7 as well as a peak of energy for x/h = 10.5, close to the reattachment point. Overall, this work successfully demonstrated the interest of using the HTGC micro-sensor for measuring averaged and fluctuating wall shear stress and detecting separation in turbulent flows. Ongoing and future work aims at using an array of HTGC micro-sensors for reactive flow control experiments on airfoil models.
This work is funded by the French National Research Agency (ANR) in the framework of the ANR ASTRID CAMELOTT project. It is supported by the regional platform CONTRAERO in the framework of the CPER ELSAT 2020 project and RENATECH, the French national nanofabrication network.
References
1. Bailey S. et al, (2010) Turbulence measurements using a nanoscale thermal anemometry probe, J. Fluid Mech, 663 160-179.
2. Barlian A. A. , Park S-J., Mukundan V., Pruitt (2007) B. L. Design and characteri-zation of microfabricated piezoresistive floating element-based shear stress sensor, Sens. Actuators A Phys, 134, 77-87.
3. Buder U., Petz R. , Kittel M. , Nitsche W. , Obermeier E., (2008) AeroMEMS polyimide based wall double hot-wire sensors for flow separation detection Sens. Actuators A Phys, 142, No. 1 130-137.
4. Chandrasekaran V., Cain A. , Nishida T., CattafestaL. N. , Sheplak M. (2005) Dynamic calibration technique for thermal shear stress sensors with mean flow, Exp. in Fluids, 39, 56-65.
5. Chandrasekharan V., Sells J., Meloy J., ArnoldD. P. , Sheplak M. (2011) A microscale differential capacitive direct wall-shear-stress sensor, J Microelectromech Syst, 20, no. 3, 622-635.
6. Furjes P., Legradi G., Ducso Cs., Aszodi A. , Barsony I. (2004) Thermal characterisation of a direction dependent flow sensor, Sensors and Actuators A: Physical, 115, no. 2, 417-423.
7. Ghouila-Houri C., Claudel J., Gerbedoen J-C., Gallas Q. , Garnier E. , Merlen A. , Viard R. , Talbi A. , Pernod P., (2016) High temperature gradient micro-sensor for wall shear stress and flow direction measurements Appl. Phys. Lett., 109, No. 24 241905.
8. Ghouila-Houri C. , Gallas Q. , Garnier E. , Merlen A. , Viard R. , Talbi A. , Pernod P., (2017) High temperature gradient calorimetric wall shear stress micro-sensor for flow separation detection Sens. Actuators A Phys., 266, 232-241.
9. Ghouila-Houri C. , Gallas Q. , Garnier E. , Viard R. , Talbi A. , Pernod P., (2018), High temperature gradient wall shear stress micro-sensors for flow separation control, 2018 Flow Control Conference, AIAA AVIATION Forum, (AIAA 2018-3057).
10. Kuo J. , Yu L. , Meng E., (2012), Micromachined Thermal Flow Sensors—A Review, 2012 Micromachines, 3, 500-573.
11. Leu T.S. , Yu J.M. , Miau J.J. , Chen S.J., (2016) MEMS flexible thermal flow sensors for measurement of unsteady flow above a pitching wind turbine blade Exp. Therm. Fluid Sci., 77, 167-178.
12. Liu Y. Z. , Ke F. , Sung H.J., (2008) Unsteady separated and reattaching turbulent flow over a two-dimensional square rib J. Fluids Struct., 24, No. 3 366-381.
13. Lofdahl L. , Chernoray V. , Haasl S. , Stemme G. , Sen M., (2003) Characteristics of a hot-wire microsensor for time-dependent wall shear stress measurements Exp. Fluids, 35, No. 3 240-251.
14. Lofdahl L. , Gad-el-Hak M., (1999) MEMS applications in turbulence and flow control Progress in Aerospace Sciences, 35, 101-203.
15. Mathis R. , Marusic I. , CHernyshenko S. I. , Hutchins N., (2013) Estimating wall-shear-stress fluctuations given an outer region input J. Fluid. Mech., 715, 163-180.
16. Nagib H. , Chauchan K.A., Monkewitz P.A., (2007) Approach to an asymptotic state for zero pressure gradient turbulent boundary layers, Philosophical Transaction of the Royal Society, 365, 755-770.
17. Sheplak M. , Chandrasekharan V. , Cain A. , Nishida T. , Cattafesta L.N., (2002) Characterization of a silicon-micromachined thermal shear-stress sensor AIAA Journal, 40, No. 6 1099-1104.
18. Talbi A. et al, (2015) A micro-scale hot wire anemometer based on low stress (Ni/W) multi-layers deposited on nano-crystalline diamond for air flow sensing, J. Micromech. Microeng., 25, No. 12, 125029.
19. Vereshchagina E., Tiggelaar R.M., Sanders R.G.P., Wolters R.A.M., Gardeniers J.G.E. (2015) Low power micro-calorimetric sensors for analysis of gaseous samples, Sensors and Actuators B: Chemical, 206, 772-787.
20. Viard R. et al, (2013) A robust thermal microstructure for mass flow rate measurement in steady and unsteady flows, J. Micromech. Microeng., 23, No. 6, 065016.
21. Xu Y. , Tai Y-C. , Huang A. , Ho C-M., (2003) IC-integrated flexible shear-stress sensor skin J. Microelectromech. Syst., 12, No. 5 740-747.