HAL Id: hal-00800176
https://hal.archives-ouvertes.fr/hal-00800176
Submitted on 10 May 2021
HAL is a multi-disciplinary open access
archive for the deposit and dissemination of
sci-entific research documents, whether they are
pub-lished or not. The documents may come from
teaching and research institutions in France or
abroad, or from public or private research centers.
L’archive ouverte pluridisciplinaire HAL, est
destinée au dépôt et à la diffusion de documents
scientifiques de niveau recherche, publiés ou non,
émanant des établissements d’enseignement et de
recherche français ou étrangers, des laboratoires
publics ou privés.
Distributed under a Creative Commons Attribution| 4.0 International License
Unanticipated biological changes and global warming
Gregory Beaugrand
To cite this version:
Gregory Beaugrand. Unanticipated biological changes and global warming. Marine Ecology Progress
Series, Inter Research, 2012, 445, pp.293-301. �10.3354/meps09493�. �hal-00800176�
INTRODUCTION
There is unequivocal evidence that the world is warming at an unprecedented rate (Intergovernmen-tal Panel on Climate Change 2007). Many studies suggest that global warming is having a discernible impact on biological and ecological systems of the biosphere, although it remains difficult to decipher the influence of natural climatic variability from global warming in many oceanic regions. For exam-ple, climatic variability related to the North Atlantic
Oscillation (NAO) strongly influences marine ecosys-tems, and a large range of physical and biological responses to the NAO have been documented (Ottersen et al. 2001).
In the North Sea, Fromentin & Planque (1996) provided evidence that year-to-year fluctuations in the state of the NAO and the abundance of the sub-arctic key-structural species Calanus finmarchicus around the British Isles were correlated negatively (Fromentin & Planque 1996). They also showed that the warm temperate species C. helgolandicus was
posi-© Inter-Research 2012 · www.int-res.com *Email: [email protected]
NOTE
Unanticipated biological changes and
global warming
Grégory Beaugrand*
Centre National de la Recherche Scientifique, UMR CNRS LOG 8187, Station Marine, Université des Sciences et Technologies Lille 1 - BP 80, 62930 Wimereux, France
ABSTRACT: Evidence of global warming is now unequivocal, and studies suggest that it has started to influence natural systems of the planet, including the oceans. However, in the marine environment, it is well-known that species and ecosystems can also be influenced by natural sources of large-scale hydro-climatological variability. The North Atlantic Oscillation (NAO) was negatively correlated with the mean abundance of one of the subarctic key species Calanus
fin-marchicus in the North Sea. This correlation was thought to have broken down in 1996, however,
the timing has never been tested statistically. The present study revisits this un anticipated change and reveals that the correlation did not break down in 1996 as originally proposed but earlier, at the time of an abrupt ecosystem shift in the North Sea in the 1980s. Furthermore, the analyses demonstrate that the correlation between the NAO and C. finmarchicus abundance is modulated by the thermal regime of the North Sea, which in turn covaries positively with global temperature anomalies. This study thereby provides evidence that global climate change is likely to alter some empirical relationships found in the past between species abundance or the ecosystem state and large-scale natural sources of hydro-climatological variability. A theory is proposed to explain how this might happen. These unanticipated changes, also called ‘surprises’ in climatic research, are a direct consequence of the complexity of both climatic and biological systems. In this period of rapid climate change, it is therefore hazardous to integrate meteo-oceanic indices such as the NAO in models used in the management of living resources, as it has been sometimes attempted in the past.
KEY WORDS: Global warming · Unanticipated changes · Calanus finmarchicus · North Atlantic Oscillation · Niche
Mar Ecol Prog Ser 445: 293–301, 2012
tively related to the NAO although the relationship was weaker and with a 1 yr lag. Many hypotheses were proposed to explain the link between the NAO and these species: wind-induced turbulence and prey-predator interactions, the influence of tempera-ture on competition between both species, bottom-up control, changes in biogeographical boundaries be-tween both species, the volume of Norwegian Sea Deep Water in which C. finmarchicus is known to overwinter and the flow of the European shelf edge current (Heath et al. 1999, Beaugrand 2009).
Subsequently, Planque & Reid (1998) attempted to forecast the abundance of Calanus finmarchicus in the North Sea as a function of the NAO. Such fore-casting would have been very helpful as the species is of great importance for higher trophic levels. How-ever, the relationship between the NAO and the abundance of C. finmarchicus surprisingly broke down. This was unexpected as the relationship held for > 30 yr. It ceased apparently from 1996, a year marked by one of the most extreme negative phases of the NAO (Planque & Reid 1998). The relationship has been recently revisited (Kimmel & Hameed 2008) but the timing from when it ceased was assumed to be 1996. The authors proposed an alternative model function of the abundance of C. finmarchicus the pre-vious year and the state of the NAO. They tested the model for 3 periods: 1958 to 1980, 1958 to 1992, and 1981 to 2002 and showed that the model performed better during the period 1958 to 1980 than after. However, no analysis was performed to identify the timing of the shift in the correlation between the 2 variables. Kimmel & Hameed (2008) also hypothe-sised that the reduction in the abundance of the sub-arctic copepod was mainly related to increasing sea water temperatures.
The main objectives of the presented paper are: (1) To investigate statistically when the negative correlation between Calanus finmarchicus and the NAO broke down,
(2) To demonstrate that sea temperature modulates the relationship between the state of the NAO and the abundance of Calanus finmarchicus in the North Sea, and
(3) To examine which large-scale hydro-climato-logical phenomenon might be at the origin of the alteration of the thermal regime of the North Sea and the decline in the abundance of Calanus
finmarchi-cus in the North Sea.
I finally propound a theory that explains how global climate change might have influenced the relationship between the NAO and Calanus
fin-marchicus. This theory might be used to better
com-prehend (1) the influence of natural climatic variabil-ity on species and (2) how this influence might be altered by global warming.
MATERIALS AND METHODS Biological data
Biological data on Calanus finmarchicus and C.
helgolandicus (1958 to 2007) come from the
Continu-ous Plankton Recorder (CPR) survey (Reid et al. 2003a). The CPR survey is seen as one of the longest, richest (in terms of species information), and geo-graphically extensive ecological surveys in the world.
Hydro-climatological data
The North Atlantic Oscillation (NAO; 1958 to 2007) is a basin-scale alternation of atmospheric mass over the North Atlantic, between the high pressures cen-tred over the subtropical Atlantic and low pressures around Iceland. The winter NAO index, correspond-ing to months from December to March, was used in this study (Hurrell et al. 2001).
The Atlantic Multidecadal Oscillation (AMO; 1958 to 2007) is a large-scale oceanic phenomenon and the source of natural variability in the range of 0.4°C in the region covered by this study (Keenlyside et al. 2008).
Northern Hemisphere Temperature (NHT; 1958 to 2007) anomalies were used as an index of large-scale change in sea surface temperature. The data were provided by the Hadley Centre for Climate Predic-tion and Research, Meteorological Office, Exeter, UK (www.metoffice.gov.uk).
Mean annual Sea Surface Temperature (SST; 1960 to 2007) in the North Sea originated from the Interna-tional Comprehensive Ocean-Atmosphere Data Set (ICOADS, 1-degree enhanced data) (Woodruff et al. 1987).
Key questions in this study
(1) Did the relationship between NAO and abun-dance of Calanus finmarchicus break down in 1996?
I examined the relationship between the winter NAO index and Calanus finmarchicus by sliding cor-relation analysis (Kirby & Beaugrand 2009) to detect
when the relationship between the 2 variables breaks down. Sliding correlation analysis can be sen-sitive to the size of the time window. That is why the linear coefficient of Pearson was calculated from the beginning of the time series (1958) to the end (2007) by using 2 different time windows (10 and 15 yr; Fig. 1a,b). Probabilities were adjusted for temporal autocorrelation (Beaugrand 2009). As a result of the correlation analyses, scatterplots of the abundance of
C. finmarchicus as a function of the winter NAO
index were presented for 3 periods: 1958 to 1962; 1963 to 1987; and 1988 to 2007 (Fig. 1c).
(2) Is the relationship between NAO and abundance of Calanus finmarchicus modulated by the thermal
regime of the North Sea?
To relate the correlation calculated between the NAO and Calanus finmarchicus, SST values were averaged for each time period corresponding to the windows (10 and 15 yr) used in the sliding correlation analysis (Fig. 1d).
(3) What large-scale climatic phenomenon is at the origin of the alteration in the thermal regime of the
North Sea?
I then examined graphically the relationships between the relative proportion of Calanus
fin-marchicus (subarctic) and C. helgolandicus
(warm-temperate) in the North Sea as a function of mean annual SST, NHT anomalies, the NAO and the AMO (Fig. 2). This analysis was conducted to attempt to explain why the correlation between the NAO and C.
finmarchicus ceased and what processes modulate
the correlation. All analyses were programmed in
MATLAB (MathWorks). 0 1.2 0.4 0.8 1.6 6 4 2 0
Winter NAO index
2 4 6 1960 1958–1962 1963–1987 1988–2007 1970 1980 1990 1974 1984 1994 2004 –1.0 –0.5 0.0 0.5 1.0 10.0 10.2 10.4 10.6 10.8 11.0 –1.0 –0.6 –0.2 0.2 0.6 1958 1962 1966 1970 1974 1978 1982 1986 1990 Corr elation and pr obability Corr elation Mean annual SST CFIN 1960 1970 1980 1990 1969 1979 1989 1999 –1.0 –0.5 0.0 0.5 1.0
b
c
d
a
Correlation SST Fig. 1. Calanus finmarchicus. Sliding correlation analysisbetween the winter NAO index and the mean annual abun-dance (as log10(x+1)) for the period 1958 to 2007, using a time window of (a) 10 yr and (b) 15 yr. Black bars: correlation values; grey line: values of probability after correction to account for temporal autocorrelation. For the x-axis labels, upper and lower years indicate the beginning and the end of the time period for the correlation analysis, respectively. (c) Scatterplots of C. finmarchicus as a function of the winter NAO index for the period 1958 to 1962 (R), 1963 to 1987 (j),
and 1988 to 2007 (m). (d) Long-term changes in the cor -relations (in black) based on a time window of 15 yr and mean annual sea surface temperature (SST) (in grey) for the corresponding period. CFIN: mean annual abundance
Mar Ecol Prog Ser 445: 293–301, 2012
RESULTS
(1) Did the relationship between NAO and abun-dance of Calanus finmarchicus break down in 1996?
Results from sliding correlation analyses (time win-dow of 10 yr) indicate that correlations between the winter NAO index and the mean annual abundance of Calanus finmarchicus in the North Sea were nega-tive from 1958 to 1987 and became posinega-tive from 1988 onwards (Fig. 1a). After correcting for autocor-relation, the probability was significant at the thresh-old of 0.1 until 1986, although the probability was not significant in the periods 1960 to 1963 and 1978 to 1979 (starting year of the sliding correlation analy-sis). This analysis based on a short time window (10 yr) indicates more accurately the timing of the shift than longer time windows but can be more influ-enced by short-scale events. Based on a time window of 15 yr, the relationships were significantly negative from 1960 to 1981 but appear less significant at the beginning of the time series (Fig. 1b). From 1982, the correlation became non-significant and slightly posi-tive. The scatterplots showed a strong negative cor-relation between the NAO and C. finmarchicus dur-ing the period 1963 to 1987 (r = –0.62; p < 0.1; n = 25) and an absence of correlation for the periods 1958 to 1962 (r = 0.09; p > 0.1; n = 5) and 1988 to 2007 (r = 0.15; p > 0.1; n = 20; Fig. 1c). These analyses show that the correlations did not break down in 1996 as originally suggested (Planque & Reid 1998) but rather after the North Sea ecosystem shift.
(2) Is the relationship between NAO and abundance of Calanus finmarchicus modulated by the thermal
regime of the North Sea?
I found a significant relationship between NAO–
Calanus finmarchicus correlations and mean annual
SST in the North Sea based on both time windows (10 yr: r = 0.68; p = 0.09; n = 41; 15 yr: r = 0.92; p = 0.02; n = 36; Fig. 1d). 296 –0.5 0 20 40 60 80 100 –6 –4 –2 0 2 4 6 –0.6 –0.2 0.2 0.6 1.0 –0.3 –0.1 0.1 0.3 0.5 9.5 10.5 11.5
a
e
d
c
b
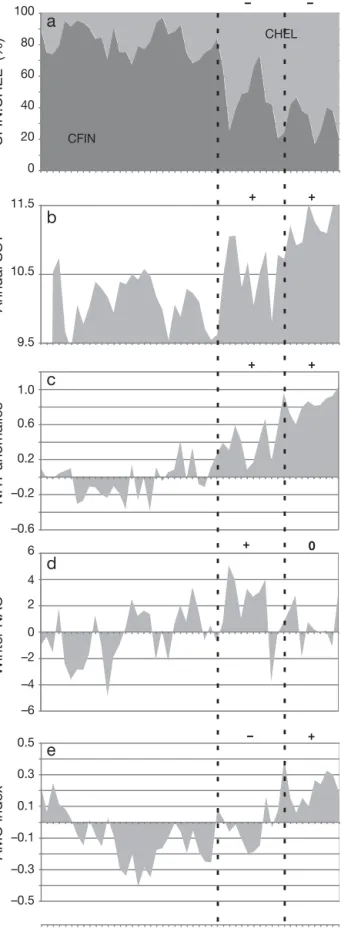
1958 1962 1966 1970 1974 1978 1982 1986 1990 1994 1998 2002 2006 Winter NAO NHT anomalies Annual SST AMO index CFIN:CHEL (%) Year CFIN CHEL + – 0 + + + + + – –Fig. 2. Calanus finmarchicus and C. helgolandicus. Long-term changes in the proportion of the species as percentage (a), in relation to mean annual sea surface temperature (SST) (b), NHT anomalies (c), the winter NAO index (d), and the AMO index (e). The 2 vertical dashed lines indicate the years 1988 and 1998. CFIN: percentage of C. finmarchicus; CHEL: percentage of C. helgolandicus. Positive and nega-tive anomalies are indicated by ‘+’ and ‘−’, respecnega-tively.
(3) What large-scale climatic phenomenon is at the origin of the alteration in the thermal regime of the
North Sea?
I further examined long-term changes in the per-centage of Calanus finmarchicus (subarctic species) and C. helgolandicus (warm-temperate, pseudo-oceanic species) in relation to changes in mean annual SST and large-scale, hydro-climatological indices (Fig. 2). At the beginning of the time period,
C. finmarchicus represented about 80% of Calanus
in the North Sea but only represented about 20% of the Calanus in 2007 (Fig. 2a). Interestingly, the corre-lations between the NAO and C. finmarchicus started to decrease when mean annual SST increased in the North Sea (see Figs. 1 & 2a,b). The regional warming was correlated positively to NHT anomalies (r = 0.69; p = 0.01; n = 48; Fig. 2c). The decrease in the NAO-C.
finmarchicus correlation was not apparent because
the warming coincided with the sustained positive phase of the NAO during the 1980s (Fig. 2d). The decrease in the NAO-C. finmarchicus correlation became apparent from 1996 when the NAO entered a sustained phase of average NAO values (i.e. NAO values ~0), whereas temperature anomalies became highly positive in the North Sea, coinciding with the positive phase of the AMO after the end of the 1990s (Fig. 2e). For the time period 1960 to 2007, the corre-lation between the NAO and C. finmarchicus was lower (although remaining globally significant; r = –0.41; p = 0.1; n = 48) than the correlation between mean annual SST and the copepod (r = –0.65; p = 0.02; n = 48). It is clear from these results that neither the NAO or the AMO can explain the collapse of
C. finmarchicus in the North Sea (Fig. 2d,e).
DISCUSSION
This paper had 3 scientific objectives. The first objective was to revisit the timing of the end of the correlation between Calanus finmarchicus and the NAO in the North Sea proposed by Planque & Reid (1998). The analyses provide evidence that the rela-tionship between the state of the NAO and the abun-dance of C. finmarchicus in the North Sea did not break down in 1996 as originally stated but in the 1980s (Fig. 1a,c). It is not reasonable to be more accu-rate on the timing because in sliding correlation analysis the identification of the years when a corre-lation breaks down often varies as a function of the time window (Fig. 1a,b). However, the results sug-gest that the relationship decreases between the
beginning and the end of the 1980s. Planque & Reid (1998) proposed that the relationship broke down in 1996, a year characterised by a pronounced negative NAO index. Subsequently, some studies have as -sumed that the timing was 1996 (e.g. Reid & Beau-grand 2002, Kimmel & Hameed 2008), and the tem-poral evenness of the relationship has never been tested. Note however that the timing of change in the correlation strength justifies why Kimmel & Hameed (2008) distinguished a period 1980 to 2002 in their analysis. Using both observed and modelled data from these authors (data from their Fig. 3), I found a change in the strength of the correlations between observed and modelled abundance of C.
finmarchi-cus that corresponded to the shift in the correlations
detected in Fig. 1, i.e. between 1982 (time window of 15 yr) and 1987 (time window of 10 yr; figures not shown). The more accurate identification of the period from when the relationship breaks down (1982 to 1987, Fig. 1) is important because it provides an essential indication on the underlying mecha-nisms. This new period corresponds to the time of the abrupt ecosystem shift in the North Sea (Reid et al. 2001, Beaugrand 2004, Beaugrand et al. 2008).
The second scientific objective was to examine whether or not the relationship was modulated by the thermal regime in the North Sea. Although this was hypothesised by Kimmel & Hameed (2008), this was not demonstrated. In the present study, I found a strong positive covariation between the NAO-Calanus
finmarchicus correlation and the mean annual SST in
the North Sea (Fig. 1d).
The third scientific objective of this paper was to investigate which large-scale hydro-climatological phenomenon might have forced the long-term rela-tionship between the NAO and Calanus
finmarchi-cus. The analyses revealed that large-scale
tempera-ture anomalies were highly and positively associated with the North Sea thermal regime (Fig. 2), the change in the strength of the correlation between C.
finmarchicus and the NAO (Figs. 1 and 2), as well as
the proportion of C. finmarchicus on total Calanus in the North Sea (Fig. 2a). Both the AMO and the NAO did not play a constant role during the period 1958 to 2007.
In the light of these results, I propound here a the-ory that explains the collapse of the NAO–Calanus
finmarchicus relationship (Fig. 3). This theory is
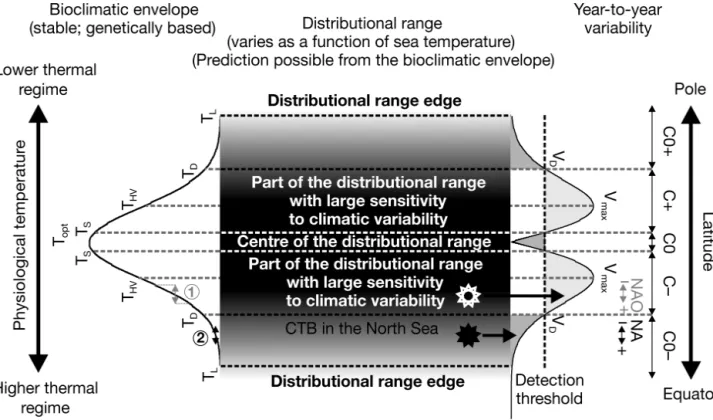
mainly based on the concept of the ecological niche (Hutchinson 1957). Using only temperature as a dimension of the niche, this can be called a biocli-matic envelope or clibiocli-matic or more accurately, a ther-mal niche (left part of Fig. 3). I postulate that (1) the
Mar Ecol Prog Ser 445: 293–301, 2012
thermal niche, genetically based, is stable at a de -cadal scale, invoking the niche conservatism hypoth-esis (Crisp et al. 2009); (2) the bioclimatic envelope determines the distributional range of a species (cen-tral part of Fig. 3); (3) the NAO influences C.
fin-marchicus by its exclusive (positive in the North Sea)
influence on SST, see however the discussion in Dickson & Turrell (2000), Reid et al. (2003b). By cal-culating the primary differences between each prob-ability of occurrence (or theoretical abundance) as a function of temperature, I can provide an assessment of the sensitivity of the species to the year-to-year variability in temperature (right part of Fig. 3). Higher sensitivity is expected at the section of the bioclimatic envelope THV corresponding to Vmax in
zones C+ and C–. These zones define the region of the distributional range where the species is the most influenced by climate. Note that maximal sensitivity (and therefore maximal year-to-year variability) is not located at the edge of the species’ distributional range but in regions of the bioclimatic envelope where the greatest local slopes occur. When the probability of occurrence becomes lower, the noise associated to the biological time series (e.g. noise related to sampling) is likely to prevent the detection of the climatic signal (zones C0+ and C0–). Detection is function of the value of the detection threshold and therefore to the noise associated to the time series (Fig. 3), which determines TDand TS. The species is
abundant or has a high probability of occurrence in a given area when temperatures are optimal. The abundance of a species is likely to be stable and less sensitive to sea temperature changes towards the optimal section of the niche (zone C0), the width of this region depending on TS.
Prior to the shift, the thermal regime of the North Sea was 1°C (annual average) lower, being in the part of the bioclimatic envelope characterised by a higher sensitivity (and year-to-year variability in SST; zone C–; Fig. 3). Therefore, the positive influ-ence of the NAO on SST was susceptible to trigger large changes in the probability of occurrence (or abundance) of Calanus finmarchicus (see the grey double arrow and associated dashed grey lines in the left part of Fig. 3). However, the thermal regime of the North Sea changed, which triggered an abrupt ecosystem shift in the 1980s. Beaugrand et al. (2008) showed that the North Sea abrupt ecosystem shift was related to the northward migration of a Critical Thermal Boundary (CTB) in the North Sea, as indi-cated by the annual isotherm 9 to 10°C (see their Fig. S4; see also the theoretical position of CTB in Fig. 3, herein). This boundary, which reflects the
limit between the Atlantic polar and the temperate biomes, was located in the North Sea prior to the shift and then moved and became positioned north of the North Sea after the shift. When the boundary was present in the North Sea, the NAO used to influence its position and therefore the abundance of C.
fin-marchicus. When the boundary was southwards, the
abundance of C. finmarchicus was probably higher and inversely.
Since CTB disappeared from the North Sea, the NAO had no longer an effect on its position and therefore on Calanus finmarchicus. The post-shift thermal regime in the North Sea corresponds to the section of the niche (zone C0–) when NAO-mediated changes in SST are no longer sufficient to generate large changes in the probability of occurrence (or abundance) of C. finmarchicus (see Point 2 in the left part of Fig. 3). Helaouët et al. (2011) have recently shown, at a monthly scale, that the thermal regime in the North Sea was increasingly outside the biocli-matic envelope of C. finmarchicus. Once the thermal regime is below zone C–, the NAO, which remained moderate especially since the beginning of the 1990s (see Fig. 2d), has not been sufficient to exert a strong influence on annual SST and in turn on the abun-dance of C. finmarchicus. It should be noted that only an extreme negative NAO such as December 2009 to February 2010 might influence the abundance of C.
finmarchicus (influence towards zone C–) because,
at present, the thermal regime is too warm. An extreme positive influence, which could precipitate the disappearance of C. finmarchicus from the North Sea, would not strongly influence the abundance of the species (see the left part of Fig. 3 corresponding to zone C0–).
Myers (1998) showed that the amount of published correlations that have been confirmed when revis-ited was low. However, correlations between the environment and fish recruitment was often signifi-cant at the margin of the distributional range of spe-cies. According to the theory I propose, the highest temperature-induced changes in the abundance of a species should be located in places where the ther-mal regime corresponds to the zone of greatest local slopes of the species’ bioclimatic envelope (Vmaxand
THV). Myers (1998) also noticed the absence of
signif-icant correlation at the centre of the distributional range, which he attributed to the strong effect of den-sity-dependence. According to the theory, this might also be related to the fact that the centre of the distri-butional range of a species corresponds to the opti-mal section of the niche, which is less sensitive to changes in temperatures (zone C0). At the time of the
Fig. 3. Idealised conceptual scheme showing the relationships between the distributional range of a species, its bioclimatic en-velope and its expected year-to-year variability. The grey surface at the centre of the figure denotes the species distributional range, the greyshade being proportional to the probability of occurrence of the species. The diagrams on the left and right sides of the figure represent the species bioclimatic envelope and the expected to-year variability, respectively. The year-to-year variability was assessed from the bioclimatic envelope by calculating the primary difference of each theoretical proba-bility of occurrence as a function of temperature. The bimodal distribution exhibits a maximal variaproba-bility Vmaxcorresponding to greatest slopes (THV; HV for High Variability) of the bioclimatic envelope. The centre of the species distributional range cor-responds to the optimal part (Topt) of the bioclimatic envelope. This stable part, delimited by Ts(s for stable), is thereby charac-terised by low year-to-year variability. The detection threshold corresponds to the theoretical value from which the signal be-comes detectable, i.e. stronger than the noise (e.g. associated to sampling) associated to the biological time series. Areas in dark grey on the right of the figure indicate geographical regions and the section of the bioclimatic envelope (TD; D for Detec-tion) where the year-to-year variance of the signal is inferior to VD(D for detection) and where it is therefore likely to remain undetected. Areas in light grey indicate regions where the variance of the signal is superior to the variance of the noise associ-ated to the biological time series. TLare the temperatures below and above which temperatures become lethal. The white star indicates the mean thermal regime of the North Sea prior to the shift in the relationship NAO–Calanus finmarchicus and the black star indicates the mean thermal regime of the North Sea after the relationship NAO–C. finmarchicus ceased. Prior to the shift, the effect of the NAO on C. finmarchicus was highly detectable because the North Sea thermal regime was in the section of the bioclimatic envelope where the year-to-year variability was high (regions highlighted in light grey). After the shift, the North Sea thermal regime was about 1°C higher (annual average) and the amount of year-to-year variability was too low to be detected. Note however that at the edge of the spatial distribution no relationship between temperature and C. finmarchicus can be expected, even if the variance associated to the noise of the biological time series become negligible. C0–: zone of weak (undetectable) negative influence of a climatic index (e.g. NAO) on C. finmarchicus; C–: zone of detectable negative influ-ence; C0: zone of no influinflu-ence; C+: zone of detectable positive influinflu-ence; C0+: zone of weak (undetectable) positive influence. This scheme is highly dependent on the shape of the bioclimatic envelope and its breadth or degree of eurythermy of species. In this model, the NAO is assumed to affect the species through its positive influence on sea surface temperature (SST) as this is the case in the North Sea. Note however that the NAO can have a negative influence on SST (e.g. the Subarctic Gyre). This model can be applied more directly using annual SST. The double vertical grey arrow (left and right part of the figure) indi-cates the theoretical (high) influence of the NAO on C. finmarchicus prior to the increase of the thermal regime in the North Sea (white star). The double vertical black arrow (left and right part of the Fig.) indicates the theoretical (small and unde-tectable) influence of the NAO on C. finmarchicus after the increase of the thermal regime in the North Sea (black star).
Mar Ecol Prog Ser 445: 293–301, 2012
study by Meyers (1998), it was not known that global climate change might become a force capable of shifting the distributional range of species (Cheung et al. 2008, Lenoir et al. 2011). The theory suggests that our capability to predict species’ responses to cli-mate change in a given area is high in the part of the geographical range that has a thermal regime sponding to zones C+ or C– (Fig. 3). In regions corre-sponding to zones C0+ and C0–, it might be imprac-tical to develop models for ecosystem management that integrate indicators of climate change (espe-cially temperature), because the signal is likely to be too small in comparison to the noise of the biological time series to provide any reliable information on the state of the biological system. At the centre of the species’ distributional range corresponding to zone C0, no response of the species to climate change is likely to be observed. Only a joint concerted approach combining sites that encompass the full distributional range of a species is likely to provide the best predic-tive capability.
The use of past empirical relationships between biological or ecosystem responses and large-scale sources of hydro-climatological variability are prob-lematic because they do not consider potential trade-offs or thresholds associated to the non-linearity of biological systems. As the present theory suggests, part of this non-linearity can be explained by the non-linear thermal preferendum of species.
Incorporating an unanticipated outcome, also called a ‘surprise’ in climatic research (Intergovern-mental Panel on Climate Change 2007), and uncer-tainty undoubtedly represents the most difficult chal-lenge that scientists and ecosystem managers will have to face in a warmer world. This paper shows that global warming can cancel well-documented empirical relationships between large-scale climatic variability (here the NAO) and key biological compo-nents of the ecosystem (here, the mean annual abun-dance of Calanus finmarchicus). As with climate, bio-logical systems are complex. Species react differently to temperature change as a function of the position of their thermal niche (Beaugrand & Kirby 2010) and temperature might also change both the strength and sign of species relationships (Kirby & Beaugrand 2009). These findings have implications for some empiri-cal relationships such as the NAO and the Atlantic cod (Brander 2005), the Pacific Decadal Oscillation (PDO) and the ecosystem state of the North Pacific (Hare & Mantua 2000), the Atlantic Subarctic index and the ecosystem state in the North-east Atlantic (Hatun et al. 2009), and the North Pacific Gyre Oscil-lation (NPGO) and the ecosystem state in San
Fran-cisco Bay (Cloern et al. 2010). Will all these interest-ing and currently robust empirical relationships hold in a warmer world? It is possible that other well-known empirical relationships between large-scale sources of natural variability and species, bio-coenoses or ecosystems might cease in the future if climate continues to warm. In this period of rapid cli-mate change, it is therefore hazardous to integrate meteo-oceanic indices such as the NAO in models used in the management of living resources as it has been attempted in the past.
Acknowledgements. This work was supported by the
‘Cen-tre National de la Recherche Scientifique’ (CNRS) and the programme BIODIMAR. I acknowledge Dr E. Goberville for his comments on an earlier version of the manuscript and both Dr D. G. Kimmel and Dr S. Hameed for kindly provid-ing their data.
LITERATURE CITED
Beaugrand G (2004) The north sea regime shift: evidence, causes, mechanisms and consequences. Prog Oceanogr 60: 245−262
Beaugrand G (2009) Decadal changes in climate and ecosys-tems in the North Atlantic Ocean and adjacent seas. Deep-Sea Res II Oceanogr 56: 656−673
Beaugrand G, Kirby RR (2010) Spatial changes in the sensi-tivity of Atlantic cod to climate-driven effects in the plankton. Clim Res 41: 15−19
Beaugrand G, Edwards M, Brander K, Luczak C, Ibañez F (2008) Causes and projections of abrupt climate-driven ecosystem shifts in the North Atlantic. Ecol Lett 11: 1157−1168
Brander K (2005) Cod recruitment is strongly affected by cli-mate when stock biomass is low. ICES J Mar Sci 62: 339−343
Cheung WWL, Lam VWY, Pauly D (eds) (2008) Modelling present and climate-shifted distribution of marine fishes and Invertebrates. Fisheries Centre Research Report 16(3), 72 p. Available at http://fisheries.ubc.ca/sites/ fisheries.ubc.ca/files/pdfs/fcrrs/16-3.pdf
Cloern JE, Hieb KA, Jacobson T, Sansó B and others (2010) Biological communities in San Francisco Bay track large-scale climate forcing over the North Pacific. Geophys Res Lett 37: L21602 doi:10.1029/2010GL044774
Crisp MD, Arroyo MTK, Cook LG, Gandolfo MA and others (2009) Phylogenetic biome conservatism on a global scale. Nature 458: 754−756
Dickson RR, Turrell WR (2000) The NAO: the dominant atmospheric process affecting oceanic variability in home, middle and distant waters of European Atlantic salmon. In: Mills D (ed) The ocean life of Atlantic salmon environmental and biological factors influencing sur-vival. Fishing News Books, Bodmin, p 92−115
Fromentin JM, Planque B (1996) Calanus and environment in the eastern North Atlantic. II. Influence of the North Atlantic Oscillation on C. finmarchicus and C. helgo -landicus. Mar Ecol Prog Ser 134: 111−118
Hare SR, Mantua NJ (2000) Empirical evidence for North Pacific regime shifts in 1977 and 1989. Prog Oceanogr 47: 300
➤
➤
➤
➤
➤
➤
➤
➤
➤
➤
103−145
Hatun H, Payne MR, Beaugrand G, Reid PC and others (2009) Large bio-geographical shifts in the north-eastern Altantic Ocean: From the subpolar gyre, via plankton, to blue whiting and pilot whales. Prog Oceanogr 80: 149−162
Heath MR, Backhaus JO, Richardson K, McKenzie E and others (1999) Climate fluctuations and the invasion of the North Sea by Calanus finmarchicus. Fish Oceanogr 8(suppl. 1): 163−176
Helaouët P, Beaugrand G, Reid PC (in press) (2011) Macro-physiology of Calanus finmarchicus in the North Atlantic Ocean. Prog Oceanogr 91: 217−228
Hurrell JW, Yochanan K, Visbeck M (2001) The North Atlantic Oscillation. Science 291: 603−605
Hutchinson GE (1957) Concluding remarks. Cold Spring Harb Symp Quant Biol 22: 415−427
Intergovernmental Panel on Climate Change WGI (2007) Climate change 2007: The physical science basis. Cam-bridge University Press, CamCam-bridge
Keenlyside NS, Latif M, Jungclaus J, Kornblueh L, Roeckner E (2008) Advancing decadal-scale climate prediction in the North Atlantic sector. Nature 453: 84−88
Kimmel DG, Hameed S (2008) Update on the relationship between the North Atlantic Oscillation and Calanus
fin-marchicus. Mar Ecol Prog Ser 366: 111−117
Kirby RR, Beaugrand G (2009) Trophic amplification of cli-mate warming. Proc R Soc Lond B Biol Sci 276: 4095−4103 Lenoir S, Beaugrand G, Lecuyer E (2011) Modelled spatial
distribution of marine fish and projected modifications in the north atlantic ocean. Glob Change Biol 17: 115−129 Myers RA (1998) When do environment –recruitment
corre-lations work? Rev Fish Biol Fish 8: 285−305
Ottersen G, Planque B, Belgrano A, Post E, Reid PC, Stenseth NC (2001) Ecological effects of the North Atlantic Oscillation. Oecologia 128: 1−14
Planque B, Reid PC (1998) Predicting Calanus finmarchicus abundance from a climatic signal. J Mar Biol Assoc U K 78: 1015−1018
Reid PG, Beaugrand G (2002) Interregional biological responses in the North Atlantic to hydrometeorological forcing. In: Sherman K, Skjoldal HR (eds) Changing states of the large marine ecosystems of the North Atlantic. Elsevier Science, Amsterdam, p 27−48
Reid PC, Borges M, Svenden E (2001) A regime shift in the North Sea circa 1988 linked to changes in the North Sea horse mackerel fishery. Fish Res 50: 163−171
Reid PC, Colebrook JM, Matthews JBL, Aiken J and others (2003a) The continuous plankton recorder: concepts and history, from plankton indicator to undulating recorders. Prog Oceanogr 58: 117−173
Reid PC, Edwards M, Beaugrand G, Skogen M, Stevens D (2003b) Periodic changes in the zooplankton of the North Sea during the twentieth century linked to oceanic inflow. Fish Oceanogr 12: 260−269
Woodruff S, Slutz R, Jenne R, Steurer P (1987) A comprehen-sive ocean-atmosphere dataset. Bull Am Meteorol Soc 68: 1239−1250
Editorial responsibility: Kenneth Sherman, Narragansett, Rhode Island, USA
Submitted: February 9, 2011; Accepted: November 10, 2011 Proofs received from author(s): January 10, 2012
![[PDF] Securise un serveur Apache document de cours | Cours webmaster](data:image/gif;base64,R0lGODlhAQABAIAAAP///wAAACH5BAEAAAAALAAAAAABAAEAAAICRAEAOw==)