HAL Id: hal-00316762
https://hal.archives-ouvertes.fr/hal-00316762
Submitted on 1 Jan 2001
HAL is a multi-disciplinary open access
archive for the deposit and dissemination of
sci-entific research documents, whether they are
pub-lished or not. The documents may come from
teaching and research institutions in France or
abroad, or from public or private research centers.
L’archive ouverte pluridisciplinaire HAL, est
destinée au dépôt et à la diffusion de documents
scientifiques de niveau recherche, publiés ou non,
émanant des établissements d’enseignement et de
recherche français ou étrangers, des laboratoires
publics ou privés.
transfer events
D. A. Neudegg, S. W. H. Cowley, K. A. Mcwilliams, M. Lester, T. K.
Yeoman, J. B. Sigwarth, G. Haerendel, W. Baumjohann, U. Auster, G.-H.
Fornacon, et al.
To cite this version:
D. A. Neudegg, S. W. H. Cowley, K. A. Mcwilliams, M. Lester, T. K. Yeoman, et al.. The UV aurora
and ionospheric flows during flux transfer events. Annales Geophysicae, European Geosciences Union,
2001, 19 (2), pp.179-188. �hal-00316762�
Annales Geophysicae (2001) 19: 179–188 c European Geophysical Society 2001
Annales
Geophysicae
The UV aurora and ionospheric flows during flux transfer events
D. A. Neudegg1,*, S. W. H. Cowley1, K. A. McWilliams1, M. Lester1, T. K. Yeoman1, J. Sigwarth2, G. Haerendel3, W. Baumjohann3, U. Auster4, K.-H. Fornacon4, and E. Georgescu5
1Department of Physics and Astronomy, Leicester University, Leicester LE1 7RH, UK 2Department of Physics, University of Iowa, USA
3Max-Planck Institut für Extraterrestrische Physik, Garching, Germany 4Technische Universität von Braunschweig, Braunschweig, Germany 5Institute of Space Science, Bucharest, Romania
*Now at: Rutherford-Appleton Laboratory, Oxfordshire OX11 0QX, UK
Received: 24 July 2000 – Revised: 11 December 2000 – Accepted: 12 December 2000
Abstract. Far Ultra Violet (FUV) signatures in the polar
ionosphere during a period of magnetopause reconnection are compared with ionospheric flows measured in the cusp ‘throat’ and dusk cell by the CUTLASS Hankasalmi HF radar. Regions of peak FUV emission in the 130.4 nm and 135.6 nm range, observed by the Polar spacecraft’s VIS Earth Cam-era, consistently lie at the turning point of the flows from the dusk cell, poleward into the throat, and at the equatorward edge of the region of high and varied radar spectral-width as-sociated with the cusp. The Equator-S spacecraft was near the magnetopause at the time of the ionospheric observations and geomagnetically conjugate with the region of ionosphere observed by the radar. Flux transfer events (FTEs), sugges-tive of bursty reconnection between the IMF and geomag-netic fields, were observed by Equator-S prior to and dur-ing the periods of high FUV emission. Enhanced poleward ionospheric flow velocities in the polar cusp region, previ-ously shown to be associated with bursty reconnection, con-sistently lie poleward of the enhanced FUV optical feature. The enhanced optical feature is consistent with the expected position of the largest upward region 1 field-aligned current, associated with electron precipitation, on the dusk edge of the merging gap. The optical feature moves duskward and equatorward during the course of the reconnection sequence, consistent with expansion of the merging line and the polar cap with newly added open magnetic flux by the FTEs. The DMSP F14 spacecraft passed through the enhanced FUV re-gion and measured strong, structured electron precipitation far greater than in the adjacent regions.
Key words. Magnetospheric physics (current systems;
mag-Correspondence to: T. K. Yeoman
netopause, cusp and boundary layers; magnetosphere-iono-sphere interactions)
1 Introduction
The effect of transient dayside reconnection of the interplan-etary and geomagnetic fields on the polar ionosphere has been a prominent theme in magnetosphere-ionosphere cou-pling since its first observation by Elphic et al. (1990) (see e.g. Kan et al., 1996; Provan et al., 1998; Milan et al., 2000). Cowley et al. (1991) presented in detail the expected ef-fects on ionospheric convection of both steady and transient dayside reconnection. Cowley and Lockwood (1992) refined predictions of the excitation and decay of ionospheric flows induced by day- and nightside reconnection including the azimuthal effects of IMF By. Ultimately, such ionospheric flows are driven by field-aligned-currents (FACs) (e.g. Iijima and Potemra, 1978) which transmit energy and stress from the magnetosheath to the polar ionosphere (e.g. Glassmeier and Stellmacher, 1996; Wright, 1996; Cowley, 2000).
HF radars have observed high velocity flow channels in the cusp ionosphere, termed flow channel events (FCEs), that were assumed to be the response to transient reconnection (Pinnock et al. 1993, 1995; Rodger and Pinnock 1997). Qua-si-periodic sequences of such events have also been termed pulsed ionospheric flows (PIFs), and the spatial extent of these events, their flow orientation, MLT occurrence, depen-dence on IMF orientation and repetition frequencies have been extensively examined (Provan et al., 1998, 1999; Provan and Yeoman, 1999; Milan et al., 1999; McWilliams et al., 2000). Neudegg et al. (1999) presented a single case study of a southward turning of the IMF, a coincident episode of
flux transfer at the magnetopause (a flux transfer event or FTE) observed by the Equator-S spacecraft, and the resul-tant flow channel event observed in the conjugate ionosphere by the CUTLASS Hankasalmi HF radar. A survey near the magnetopause with Equator-S and in the polar ionosphere with the network of northern hemisphere SuperDARN radars showed the onset of enhanced velocity flow channels in the cusp ionosphere to be associated with the occurrence of FTEs at a high significance level (Neudegg et al., 2000).
Optical signatures associated with dayside reconnection have been extensively investigated from the ground in the visible wavelengths of 630.0 nm and 557.7 nm, associated with auroral activity (e.g. Lockwood et al., 1989, 1993, 1995; Sandholt et al., 1996; Øieroset et al., 1996; Mende et al., 1998). Generally these studies show equatorward motion of the cusp aurora during reconnection and a sequence of dis-tinct poleward moving auroral forms (PMAFs), the motion of which resembles the flows measured by HF radar. Indeed the occurrence rates of FTEs, PMAFs and PIFs has been shown to be very similar (McWilliams et al., 2000). The availability of space-based measurements in the visible and UV wave-lengths, from platforms such as Polar, has made available global views of emissions not available from the ground and the possibility of observing processes in wavelengths that are screened from ground observation by atmospheric absorption (e.g. Milan et al., 2000).
In this paper, we will examine the relationship between a region of enhanced UV emission observed by the Polar VIS Earth Camera in a wavelength range not often employed in dayside reconnection studies, and the geometry of po-lar ionospheric flows in the dusk cell and cusp throat, as observed by the Hankasalmi SuperDARN HF radar in Fin-land. The enhanced UV region occurs during a period of day-side reconnection in the interval 1015–1050 UT on 4 January 1998 when the Equator-S spacecraft observed FTEs near the magnetopause and was geomagnetically conjugate with the radar field-of-view (Neudegg et al., 1999).
2 Instrumentation
2.1 Polar ionosphere: SuperDARN Hankasalmi HF radar Details of the SuperDARN HF radars are given in Green-wald et al. (1995) and the CUTLASS systems at Hankasalmi in Finland and Þykkvibær in Iceland by Milan et al. (1997). During the Equator-S geomagnetic conjunction with CUT-LASS on 4 January 1998, a special high space- and time-resolution scan mode was run with 30 km range gates and a 2 s dwell time for each beam, resulting in a 32 s sweep over the 16 beams (from beam 15 on the east of the field-of-view (f-o-v) to beam 0 on the west for the Hankasalmi radar). The geomagnetic field lines from Equator-S have been mapped to the ionosphere using the Tsyganenko 89a model for the actual Kp value of 0. This model predicts the spacecraft to have been on open field lines during the interval 0900–1300 UT. The magnetometer data show that Equator-S was located
on magnetospheric field lines until ∼1034 UT, when it en-tered the magnetosheath. The continuation of the predicted geomagnetically conjugate ionospheric point from 0900 UT along a smooth arc places the footprint of Equator-S dur-ing the FTE observations near the far ranges of the radar in beams 0–6 on the western side of the f-o-v. The altitude of the radar backscatter is assumed to be between 300 and 350 km. During this interval, Hankasalmi was the only Super-DARN radar to observe ionospheric scatter in either hemi-sphere.
2.2 Polar ionosphere: Polar VIS Earth camera
The Visible Imaging System (VIS) (Frank et al., 1995) on the Polar spacecraft comprises three camera systems, one of which is the Earth Camera. The VIS Earth Camera has a sufficiently large field-of-view to provide images of an en-tire hemisphere during much of the spacecraft’s orbit and is used as a global survey instrument for the other higher reso-lution cameras in the VIS suite. The Earth Camera operates in the 124–149 nm range and mainly registers the electron precipitation induced O I auroral transitions at 130.4 nm and 135.6 nm in the far ultraviolet (FUV) range (e.g. Feldman and Gentieu, 1982; Meier et al., 1982; Meier and Strickland, 1991). The emissions are excited by electron precipitation in the 1–5 keV range, but the intensities observed above the ionosphere at 5 keV precipitation energies may be signifi-cantly less than those from 1 keV due to scattering and re-absorption of the emissions. The peak intensity for 130.4 nm and 135.6 nm emissions are in the 140–180 km altitude range and production rates peak at 100–130km, determined by in situ rocket measurements (Meier et al., 1982). Each VIS ex-posure is 32.5 seconds and the time between exex-posures is 4 minutes. The spatial resolution of the camera in the data pre-sented here, when the spacecraft was at 8.4 RE, near apogee, was ∼75 km (twice that of the radar range gates). Polar was also located on the nightside so the dayside features suffered from some limb stretching effects which further reduced the spatial resolution.
2.3 Magnetopause: Equator-S spacecraft
The Equator-S spacecraft was launched on 2 December 1997 into an initial geostationary transfer orbit, and was then boos-ted to an elliptical orbit with apogee close to the magne-topause on 11 December 1997. The mission is described in detail by Haerendel et al. (1999). The FTE sequence de-scribed in this paper was observed by the magnetometer ex-periment (Fornacon et al., 1999) near apogee at ∼1020 UT (∼0910 MLT) on 4 January 1998, when the spacecraft was
∼11.3 REfrom Earth at GSM (X, Y, Z) = (8, 7, 4)RE. This occurred during the instrument’s commissioning phase when only the magnetometer was continuously operating, at a 64 Hz sampling rate, although spin-averaged 1.5 s resolution data is used here. The spacecraft trajectory for this period is described in Neudegg et al. (1999).
D. A. Neudegg et al.: The UV aurora and ionospheric flows during flux transfer events 181 -4 -2 0 2 4 6 8 10 IMF (nT) B X B Y BZ
(a) WIND MFI shifted 77 min
08:43 08:53 09:03 09:13 09:23 09:33 09:43 -20 0 20 40 60 BN (nT)
(b) Equator-S FTE FTE magnetosheath
77 78 79 80 81 82 83 Magnetic Latitude 77 78 79 80 81 82 83
Magnetic Latitude (c) CUTLASS Beam 5 -800 -600 -400 -200 0 200 400 600 800 Velocity (ms -1 ) 10:00 10:10 10:20 10:30 10:40 10:50 11:00 UT 76 77 78 79 80 81 82 83 Magnetic Latitude 10:00 10:10 10:20 10:30 10:40 10:50 11:00 UT 76 77 78 79 80 81 82 83
Magnetic Latitude (d) CUTLASS Beam 5
0 3 6 9 12 15 18 21 24 27 Power (dB)
Figure 1
Fig. 1. (a) The Wind upstream IMF
GSM Bx, By and Bz component data
during the interval under study. The data is timelagged by 77 min relative to the panels presented below (b) Equator-S boundary normal component mag-netic field from the magnetopause re-gion (c) Colour-coded (positive (blue) velocities are toward the radar, negative (red) velocities away from the radar) CUTLASS Hankasalmi beam 5 line-of-sight velocity data as a function of mag-netic latitude (d) Colour-coded CUT-LASS Hankasalmi beam 5 backscat-tered power data as a function of mag-netic latitude. Times of FTE-associated enhanced ionospheric flow onsets are marked with dashed vertical lines in panels c and d.
2.4 DMSP spacecraft particle signatures
The DMSP (Defense Meteorological Satellite Program) is a series of spacecraft with upward looking charged particle flux and energy detectors amongst its complement of instru-ments. The particle spectra from these instruments have been used to determine the location and statistical time variation of high latitude plasma regions of the magnetosphere near 830 km altitude (e.g. Newell and Meng, 1992). In this study, the DMSP F14 spacecraft was used as it passed along the equa-torward edge of the region of high FUV intensity, observed by the Polar VIS Earth Camera. The spacecraft is three-axis stabilised with the particle detectors pointing towards the lo-cal zenith, directly away from the Earth, and having a fairly narrow field of view of 8◦. Electrostatic analysers measure electron and ion energies and fluxes from 32 eV to 30 keV in 20 logarithmically based steps (Hardy et al., 1985).
3 Results
3.1 Reconnection sequence overview
The reconnection sequence occured during the period 1000– 1100 UT on 4 January 1998, and is summarised in Fig. 1. Figure 1a presents the IMF measured by the Wind space-craft magnetometer (Lepping et al., 1995), time lagged at the solar wind velocity to the bow-shock and through the magnetosheath to the sub-solar magnetopause using mod-elled bow shock and magnetopause positions, as described
by Neudegg et al. (1999) for the same data sequence. The estimated time delay is 77 minutes with an uncertainty of the order of 5 minutes. The reference point for this timing is the sub-solar magnetopause as a first approximation for the reconnection site. A slight southward IMF turning to near 1 nT from a low northward (< +2 nT) configuration, ob-served by Wind, is estimated to reach the magnetopause at
∼1008 UT. A sharp southward excursion to 2 nT reached the magnetopause at ∼1020 UT. This period of extended IMF southward configuration with a positive By of 5 nT contin-ued until a sharp excursion towards Bz = 0 reached the magnetopause at ∼1039 UT, and then another sharp excur-sion to +4 nT at ∼1042 UT. Equator-S (Fig. 1b) was in the magnetosphere at the start of the sequence and observed a large (∼40 nT peak-to-peak amplitude) FTE onset at 1018 UT; the reconnection bulge having presumably propagated around the magnetopause to Equator-S from the azimuthally expanding reconnection point. The effects of reconnection also propagate to the polar ionosphere from the reconnection site along geomagnetic field lines at the Alfvén speed. Both propagation delays are of the order of 2–3 minutes. The first FTE is followed by a second of only slightly less magnitude at 1026 UT, just before the spacecraft enters the boundary layer at ∼1027 UT, and then the magnetosheath at 1034 UT. Subsequent to this a number of possible magnetosphere re-entries occured (Neudegg et al., 1999).
During the time sequence described above, the Hankasalmi radar observed a series of three line-of-sight (l-o-s) plasma velocity enhancements interpreted as flow channel events or
11 12 13 14 70o 80o (MLT)
10:14 31s
(a)
10:14 34s
(b)
10:18 43s
(c)
10:18 34s
(d)
10:22 19s
(e)
10:22 34s
(f)
-800 -600 -400 -200 0 200 400 600 800Velocity (m s
-1)
10:26 31s
(g)
0.0 0.5 1.0 1.5 2.0 2.5 3.0 3.5Intensity (kR)
10:26 35s
(h)
Figure 2
Fig. 2. Left column (a, c, e, g)
CUT-LASS Hankasalmi line-of-sight veloc-ity scans for four 32 s scans during the interval 1014:31–1026:31 UT, in mag-netic local time-magmag-netic latitude coor-dinates, with noon at the top of the pan-els and dusk to the left. Beamswung velocity vector estimates are overlaid. Right column (b, d, f, h) The corre-sponding 32.5 s Polar VIS auroral im-ages. The beamswung vectors from panels (a, c, e, g) are overlaid for refer-ence, as is the outline of the Hankasalmi field-of-view. Each panel is marked with the radar scan/image start time.
pulsed ionospheric flows (Pinnock et al., 1993, 1995; Rodger and Pinnock, 1997; Provan et al., 1998, 1999; Provan and Yeoman, 1999, Milan et al., 1999) in beams 3 to 7. L-o-s velocity and backL-o-scattered power in beam 5 are L-o-shown aL-o-s functions of magnetic latitude and UT in Fig. 1c and d, re-spectively. PIFs commenced at ∼1020 UT, 1032 UT and 1040 UT, and these times are marked on Fig. 1 as dashed vertical lines. The first flow channel has been shown to be associated with the 1018 UT FTE at Equator-S by Neudegg et al. (1999) and is particularly well defined in the radar data. The strong statistical association between FTEs and flow channels described in Neudegg et al. (2000) suggests
the second enhanced flow may be associated with the 1026 UT FTE. Equator-S does not observe a third FTE, but as it is near apogee, the rapid entry to the sheath suggests an in-ward moving magnetopause may have carried the reconnec-tion bulge earthward, away from the spacecraft. Such in-ferred magnetopause motion is due mainly to flux erosion as a consequence of the southward directed IMF, but also par-tially to solar wind dynamic pressure changes (see the dis-cussion of Neudegg et al., 1999). The third flow channel in the ionosphere commencing at 1040 UT suggests a third FTE near 1036 UT at the magnetopause which was earth-ward of Equator-S. The radar backscattered power exhibits
D. A. Neudegg et al.: The UV aurora and ionospheric flows during flux transfer events 183
10:30 43s
(a)
11 12 13 14 70o 80o (MLT)10:30 35s
(b)
10:34 19s
(c)
10:34 35s
(d)
10:38 31s
(e)
10:38 36s
(f)
-800 -600 -400 -200 0 200 400 600 800Velocity (m s
-1)
10:42 44s
(g)
0.0 0.5 1.0 1.5 2.0 2.5 3.0 3.5Intensity (kR)
10:42 36s
(h)
Figure 3
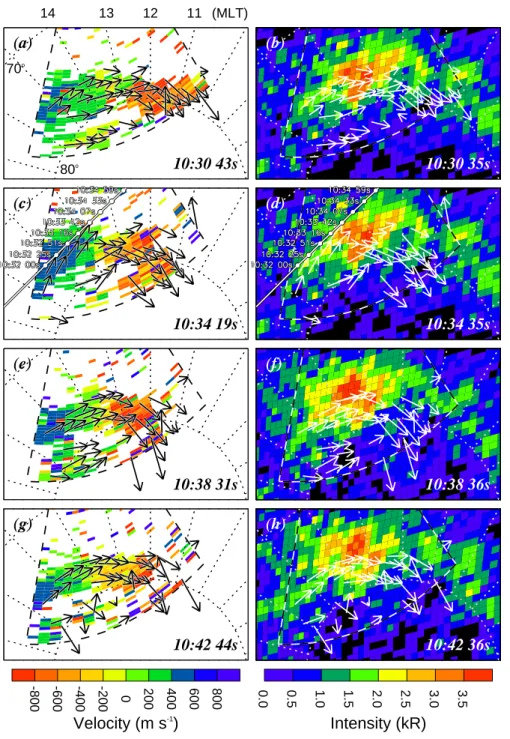
Fig. 3. CUTLASS Hankasalmi
line-of-sight velocity scans and Polar VIS im-ages for the interval 1030:43–1042:44 UT. Format as for Fig. 2. The footprint of a DMSP overpass is also shown in panels c and d.
enhancements co-located with the pulsed flows and of the same duration, often with greater contrast between power levels than between l-o-s velocities. The first event begins at 78.5◦MLAT and the second two events begin close to 77.5◦ MLAT, so a general equatorward motion occurs, suggesting polar cap expansion as new open flux is added by the FTEs (Cowley and Lockwood, 1992). These flows were within the region of high spectral width, which Baker et al. (1995) associated with cusp precipitation, deduced from a study of DMSP particle and radar spectra.
3.2 HF radar and POLAR FUV observations
The left hand side panels of Figs. 2–4 present maps of colour-coded l-o-s velocity measured by the Hankasalmi radar for a sequence of selected scans throughout the interval, in mag-netic latitude-magmag-netic local time coordinates. Overlaid on these scans are a number of estimates of the horizontal flow vector, calculated using a beamswinging algorithm where the flow component parallel to the L-shell is assumed con-stant across the scan (Villain et al., 1987; Ruohoniemi et al., 1989). The radar scans are chosen to correspond to the times of Polar VIS FUV emission images with intensities in kilo-Raleigh, which are presented in corresponding panels on
10:46 20s
(a)
11 12 13 14 70o 80o (MLT)10:46 37s
(b)
10:50 32s
(c)
10:50 37s
(d)
10:54 44s
(e)
10:54 37s
(f)
-800 -600 -400 -200 0 200 400 600 800Velocity (m s
-1)
10:58 20s
(g)
0.0 0.5 1.0 1.5 2.0 2.5 3.0 3.5Intensity (kR)
10:58 38s
(h)
Figure 4
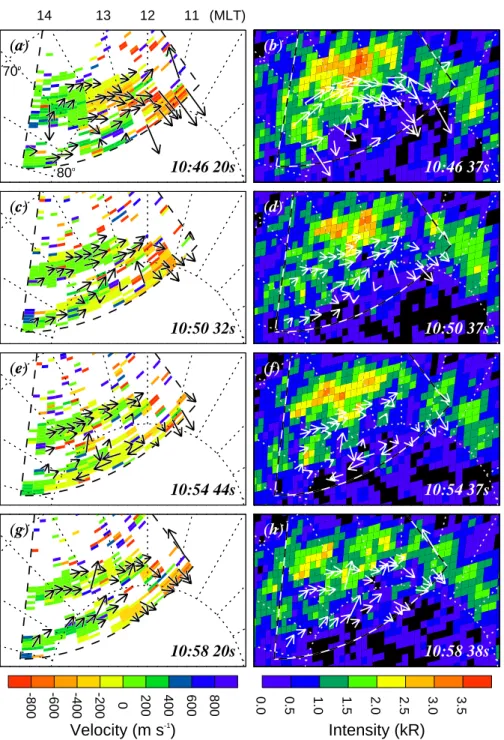
Fig. 4. CUTLASS Hankasalmi
line-of-sight velocity scans and Polar VIS im-ages for the interval 1046:20–1058:20 UT. Format as for Fig. 2.
the right hand side of Figs. 2–4, and are also overlaid with the same beamswung velocities. The nightside (not shown) shows very little optical activity, suggesting that reconnec-tion is confined to the dayside in the period 1000–1100 UT. In Fig. 2a, in the scan starting at 1014:31 UT, before the onset of the first reconnection-associated flow enhancement, the radar observes sunward, return flow in its easternmost beams, with some evidence of weak antisunward flow near the noon meridian. The corresponding auroral image shows only a weak oval, with intensities below 2 kR and confined mainly to an arc along ∼78◦ MLAT. As the first episode of flux transfer develops between 1018:4–1026:31 UT, the
lower three rows of Fig. 2 show a strengthening auroral oval with a region of enhanced FUV emission appearing at 12– 13 MLT, 77◦–79◦MLAT (approximately 300 km × 300 km) collocated with beams 5 and 6 of the radar, reaching inten-sities of 3 kR. The flows enhance, in concert with the FUV emissions, the brightest patch of which lies at the turning point of the flow, which both strengthens and exhibits in-creased curvature. Strong antisunward flows are seen near magnetic local noon at high latitudes, and these correspond to the poleward moving enhanced flow velocity presented in Fig. 1 after 1020 UT. The pulsed flow begins at 79◦MLAT and moves poleward to 82◦MLAT over 8 minutes until it lies
D. A. Neudegg et al.: The UV aurora and ionospheric flows during flux transfer events 185 poleward of the FUV feature. The convection evolves from
sunward, azimuthal flow to antisunward flow, across Han-kasalmi beams 8 to 5, and this region of antisunward flow moves eastward during the sequence of scans presented in Fig. 2. The flow is generally westward as well as poleward, in the ‘throat’ region of the convection pattern, which is con-sistent with predictions by Cowley and Lockwood (1992) for positive IMF By.
Figure 3 presents a similar view of the developing flows from 1030:43–1042:44 UT, corresponding to the second and third intervals of reconnection-associated flows in Fig. 1. These two flow events are not as clearly distinguished as the first, but again, a strong area of enhanced FUV auroral luminosity (now increasing to over 4 kR) is accompanied by ionospheric flows with a strong clockwise-directed cur-vature. The antisunward radar flow measurements lie west and poleward of the centre of the auroral emissions. The centre of the enhanced FUV emissions and the edge of the antisunward flows have migrated duskward compared to the images in Fig. 2, to 13–14 MLT. The footprint of a DMSP spacecraft overpass is indicated in panels c and d, which will be discussed later.
Figure 4 presents the last sequence of flow and auroral maps during the interval from 1046:20–1058:20 UT, after the IMF has turned northward. The dayside auroral zone evolves back to a low level of FUV emissions during this time, and the flows measured by the CUTLASS radar weaken dramat-ically between panels a and g. The final panels of Fig. 4 (panels g and h) closely resemble the first two panels of Fig. 2, which were measured prior to the reconnection activity, but with the auroral oval displaced slightly equatorward.
3.3 DMSP F14 overpass
Several DMSP passes through the radar field of view oc-curred during the reconnection sequence described above, but only one passed close to the region of enhanced FUV intensity, the footprint shown in Fig. 3c, d. Fig. 3d indi-cates that the spacecraft skirted just equatorward of the in-tense FUV emission region, passing closest between 1033:10 and 1033:50 UT. The radar data reveals the overpass to be through a region of sunward flows. This overpass is shown in more detail in relation to the radar f-o-v in Fig. 5, which presents l-o-s velocity, backscatter power and spectral width for the three 32 s radar scans which encompass the overflight of the radar data. The radar data can be seen as largely con-sistent throughout the three scans, although the flow strength-ens slightly between Figs. 5a and c. The DMSP spacecraft traverses a region of sunward flow, just equatorward of a high power region of radar backscatter, which lies at the eastern and equatorward edge of the broad spectral width region. The ‘cusp-like’ enhanced spectral widths (Baker et al., 1995) generally cover both the cusp ‘throat’ on the western edge and the flow turning point, but only part of the dusk return cell flow. The electron and ion spectrograms associated with the overflight are shown in Fig. 6. As the spacecraft enters the radar field of view, it observes low energy electrons and
ions centred around 1 keV. As it passes equatorward of the enhanced FUV region, intense, structured electron precipita-tion is observed. This is the only region of the spectrogram where the electron energy flux dominates that of the ions. The electron precipitation is presumably associated with the FUV aurora, although whether the structuring is temporal, spatial or both is unclear from the data presented here. Sub-sequently, the spacecraft moves to lower latitudes, and higher energy electrons and ions predominate.
4 Discussion and conclusions
The peak FUV emissions above 3.0 kR are constrained to an area less than 500 km by 500 km. They consistently lie in the region, characterised by the narrow radar spectral widths in Fig. 5, at the turning point of the flows from the dusk cell into the poleward cusp ‘throat’ region, as measured by the radar. The FUV region also lies equatorward of the region of enhanced velocity flow channels in the cusp ‘throat’ which are associated with FTEs observed at the magnetopause, and are characterised by broad spectral width in the radar data in Fig. 5. The location of peak FUV emissions is initially centred near noon, but migrates to near 1400 MLT during the interval. This region of bright FUV aurora is consistent with the frequently occurring postnoon ‘hot spot’ (Liou et al., 1999). The dayside cusp ionosphere connects to a com-plex arrangement of FACs including upward region 1 (R1) currents on the dusk side of noon, downward R1 currents on the dawn side of noon and cusp/mantle (C/M) currents slightly poleward of the R1 FACs (e.g. Lu et al., 1995). In a model of polar cap inflation caused by unbalanced day-side reconnection, Siscoe and Huang (1985) predicted that the R1 FACs would maximise at the edge of the ‘flux gap’ or merging line. This maximum FAC thus lies at the point where the flows turn from towards noon in the dayside por-tion of the dusk and dawn return flow cells, to poleward into the cusp ‘throat’ (e.g. Heelis et al. 1976; Weimer, 1995) of the convection pattern as they cross the merging gap. The location of the greatest dusk-side R1 FAC current density was measured by Iijima and Potemra (1978), occurring at 14 MLT, and the FUV peak emission regions are consistent with this. The highly localised and structured peak electron precipitation measured by DMSP, coinciding with enhanced FUV emission, also suggests an upward FAC. The observa-tions presented in this paper thus indicate that the enhanced optical emissions in the FUV range near 12–14 MLT are as-sociated with the R1 FAC on the dusk edge of the merging gap. This R1 FAC is strongly intensified during the dayside reconnection sequence.
Siscoe and Huang (1985) also predicted a widening of the merging gap during an extended dayside reconnection se-quence, and this is observed in both the radar flows and the FUV emissions. The eastward shift of the peak FUV region from near 12 MLT to near 14 MLT, between 1026 UT and 1030 UT, is consistent with the widening of the merging gap, if the peak FUV region is associated with the upward dusk
(a) 10:31 55s - 10:32 27s
(i)
(ii)
(iii)
(MLT) 14 13 12 11
70o
80o
(b) 10:32 31s - 10:33 03s
(i)
(ii)
(iii)
-800 -600 -400 -200 0 200 400 600 800
Velocity (m s
-1)
(c) 10:33 07s - 10:33 39s
(i)
0 3 6 9 12 15 18 21 24 27Power (dB)
(ii)
0 50 100 150 200 250 300 350 400 450Width (m s
-1)
(iii)
Figure 5
Fig. 5. CUTLASS Hankasalmi scans for three 32 s scans centred on the DMSP overpass. Beamswung velocity vector estimates and the
spacecraft track footprint are overlaid. (a) 1031:55–1032:27 UT (i) line-of-sight velocity (ii) backscattered power (iii) spectral width; (b) similarly for 1032:31–1033:03 UT; (c) similarly for 1033:07–1033:39 UT.
R1 FAC at the gap edge. The measured radar flows also show the gap widening with the region of poleward and westward flow into the polar cap, increasing in width over the 1026 UT to 1030 UT period. As episodes of reconnection are ongoing, the ionospheric plasma velocities rapidly increase in the dusk cell and cusp ‘throat’. The merging gap has been observed to expand during the reconnection sequence with the polar cap also expanding, consistent with the predictions of Siscoe and Huang (1985) and Cowley and Lockwood (1992). After the IMF Bz turns northward toward the end of the interval, the ionospheric flows decay and the FUV intensity subsides to levels only slightly higher than those prevailing before the
Bzsouthward turning.
Acknowledgements. Thanks to J. Sartain at University of Iowa for
providing the Polar VIS Earth Camera data, the University of Le-icester CUTLASS HF radar team and S. Milan for data visuali-sation software. For the Equator-S data we thank the Equator-S staff at Max-Planck Institut für Extraterrestrische Physik (MPE), the German Space Operations Centre (GSOC) and T.U. Braunschweig. Equator-S was made possible through grant 50 0C 94024 of the Ger-man Space Agency (DARA). We also thank P. Newell and J. Skura (Applied Physics Lab/Johns Hopkins University) for the DMSP data. D. Neudegg was supported by U.K. PPARC (Particle Physics and Astronomy Research Council) grant GR/L29767. K. A. McWilliams gratefully acknowledges graduate research funding from the Asso-ciation of Commonwealth Universities of the British Council.
The Editor-in-Chief thanks P. E. Sandholt and C. J. Farrugia for their help in evaluating this paper.
D. A. Neudegg et al.: The UV aurora and ionospheric flows during flux transfer events 187
Figure
6
Fig. 6. DMSP spectrogram for the spacecraft overpass in Fig 5. Ion and electron fluxes are presented. Note the inverted energy scale in the
ion panel.
References
Baker, K. B., Dudeney, J. R., Greenwald, R. A., Pinnock, M., Newell, P. T., Rodger, A. S., Mattin, N., and Meng, C.-I., HF radar signatures of the cusp and low-latitude boundary layer, J. Geophys. Res., 100, 7671, 1995.
Cowley, S. W. H., and Lockwood, M., Excitation and decay of so-lar wind-driven flows in the magnetosphere-ionosphere system, Ann. Geophysicae, 10, 103, 1992.
Cowley, S. W. H., Freeman, M. P., Lockwood, M., and Smith, M. F., The ionospheric signature of flux transfer events, Cluster: Day-side polar cusp, ESA SP-330, ESA Noordwijk, The Netherlands, 105, 1991.
Cowley S. W. H., Magnetosphere-ionosphere interactions – A tu-torial review, in ‘Magnetospheric current systems’ edited by S. Ohtani, R. Fujii, M. Hesse and R. L. Lysak, AGU publications, Washington DC, 2000.
Elphic, R. C., Lockwood, M., Cowley, S. W. H., and Sandholt, P. E., Flux transfer events at the magnetopause and in the ionosphere, Geophys. Res. Lett., 17, 2241, 1990.
Feldman, P. D. and Gentieu, E. P., The ultraviolet spectrum of an aurora 530–1520 Å, J. Geophys. Res., 87, 2453, 1982.
Fornacon, K.-H., Auster, H. U., Georgescu, E., Baumjohann, W., Glassmeier, K.-H., Haerendel, G., Rustenbach, J., Dunlop, M., The magnetic field experiment onboard Equator-S and its scien-tific possibilities, Ann. Geophysicae, 17, 1521, 1999.
Frank, L. A., Sigwarth, J. B., Craven, J. D., Cravens, J. P., Dolan, J. S., Dvorsky, M. R., Hardebeck, P. K., Harvey, J. D., and Muller, D. W., The visible imaging system (VIS) for the POLAR space-craft, Space Sci. Rev., 71, 297, 1995.
Glassmeier, K.-H., and Stellmacher, M., Mapping of flux transfer events to the ionosphere, Adv. Space Res. 18, 151, 1996.
Greenwald, R. A., et al., A global view of high-latitude convection, Space Sci. Rev., 71, 763, 1995.
Haerendel, G., Torbert, R. B. and Höfner, H., The Equator-S mis-sion, Ann. Geophysicae, 17, 1499, 1999.
Hardy, D. A., Schmitt, L. K., Gussenhoven, F. J., Yeh, H. C., Schu-maker, T. L., Hube, A., and Pantazis, J., Precipitating electron and ion detectors (SSJ/4) for the block 5D/flights 6–10 DMSP satellites: Calibration and data presentation, Report AFGL-TR-84-0317, Air Force Geophysics Laboratory, Hanscom Air Force Base, Mass., USA., 1985.
Heelis, R. A., Hanson, W. B., and Burch, J. L., Ion convection ve-locity reversals in the dayside cleft, J. Geophys. Res., 81, 3803, 1976.
Iijima, T., and Potemra, T. A., Large scale characteristics of field-aligned-currents associated with substorms, J. Geophys. Res., 83, 599, 1978.
Kan, J. R., Deehr, C. S., Lyu, L. H., and Newell, P. T., Ionospheric signatures of patchy-intermittent reconnection at dayside magne-topause, J. Geophys. Res., 101, 10939, 1996.
Lepping, R. P., et al., The WIND magnetic field investigation, Space Sci. Rev., 71, 207, 1995.
Liou, K., Newell, P. T., Meng, C.-I., Sotirelis, T., Brittnacher, M., and Parks, G., Source regions of 1500 MLT auroral bright spots: simultaneous Polar UV images and DMSP particle data, J. Geo-phys. Res., 104, 24,587, 1999.
Lu, G., Lyons, L. R., Reiff, P. H., Denig, W. F., de la Beaujardiére, O., Kroehl, H. W., Newell, P. T., Rich, F. J., Opgenoorth, H., Persson, M. A. L., Ruohoniemi, J. M., Friis-Christensen, E., Tomlinson, L., Morris, R. J., Burns, G. B., and McEwin, A., Characterstics of ionospheric convection and field-aligned cur-rent in the dayside cusp region, J. Geophys. Res., 100, 11,845, 1995.
Lockwood, M., Sandholt, P. E., and Cowley, S. W. H., Dayside auroral activity and magnetic flux transfer from the solar wind, Geophys. Res. Lett., 16, 1, 33, 1989.
Lockwood, M. Moen„ J., Cowley, S. W. H., Farmer, A. D., Løvhaug, U. P., Lühr, H., and Davda, V. N., Variability of day-side convection and motions of the cusp/cleft aurora, Geophys. Res. Lett., 20, 1011, 1993.
Lockwood, M., Cowley, S. W. H., Sandholt, P. E., and Løvhaug, U. P., Causes of plasma flow bursts and dayside auroral transients: An evaluation of two models invoking reconnection pulses and changes in the Y component of the magnetosheath field, J. Geo-phys. Res., 100, 7613, 1995.
McWilliams, K. A., Yeoman, T. K., and Provan, G., A statistical study of dayside pulsed ionospheric flows as seen by the CUT-LASS Finland HF radar, Ann. Geophysicae, 18, 445, 2000. Meier, R. R. and Strickland, D. J., Auroral emission processes and
remote sensing, Chap II-3, p37, in Auroral Physics, ed. C.-I. Meng, M. J. Rycroft and L. A. Frank, Cambridge University Press, ISBN 0 521 38049 9, 1991.
Meier, R. R., Conway, R. R., Feldman, P. D., Strickland, D. J., and Gentieu, E. P., Analysis of nitrogen and oxygen far ultraviolet auroral emissions, J. Geophys. Res., 87, 2444, 1982.
Mende, S. B., Klumpar, D. M., Fuselier, S. A., and Anderson, B. J., Dayside auroral dynamics: South Pole – AMPTE/CCE observa-tions, J. Geophys. Res., 103, 6891, 1998.
Milan, S. E., Yeoman, T. K., Lester, M., Thomas, E. C., and Jones, T. B., Initial backscatter occurrence statistics from the CUT-LASS HF radars, Ann. Geophysicae, 15, 703, 1997.
Milan, S. E., Lester, M., Greenwald, R. A., and Sofko, G., The ionospheric signature of transient dayside reconnection and the associated pulsed convection return flow, Ann. Geophysicae, 17, 1166, 1999.
Milan, S. E., Lester, M., Cowley, S. W. H., and Brittnacher, M., Convection and auroral response to a southward turning of the IMF: Polar UVI, CUTLASS and IMAGE signatures of transient magnetic flux transfer at the magnetopause, J. Geophys. Res., 105, 15741, 2000.
Neudegg, D. A., Yeoman, T. K., Cowley, S. W. H., Provan, G., Haerendel, G., Baumjohann, W., Auster, U., Fornacon, K.-H. Georgescu„ E., and Owen, C. J., A flux transfer event observed at the magnetopause by the Equator-S spacecraft and in the iono-sphere by the CUTLASS HF radar, Ann. Geophysicae, 17, 707, 1999.
Neudegg, D. A., Cowley, S. W. H., Milan, S. E., Yeoman, T. K., Lester, M., Provan, G., Haerendel, G., Baumjohann, W., Nikutowski, B., Büchner, J., Auster, U., Fornacon, K.-H., and Georgescu, E., A survey of magnetopause FTEs and associated flow bursts in the polar ionosphere, Ann. Geophysicae, 18, 416, 2000.
Newell P. T. and Meng, C.-I., Mapping the dayside ionosphere to the magnetosphere according to particle precipitation characteristics, Geophys. Res. Lett., 19, 609–612, 1992.
Øieroset, M., Lühr, H., Moen, J., Moretto, T., and Sandholt, P. E., Dynamical auroral morphology in relation to ionospheric plasma convection and geomagnetic activity: signatures of mag-netopause X line dynamics and flux transfer events, J. Geophys. Res., 101, 13275, 1996.
Pinnock, M., Rodger, A. S., Dudeney, J. R., Baker, K. B., Green-wald, R. A., and Greenspan, M., Observations of an enhanced convection channel in the cusp ionosphere, J. Geophys. Res., 98, 3767, 1993.
Pinnock, M., Rodger, A. S., Dudeney, J. R., Rich, F., and Baker, K. B., High spatial and temporal resolution observations of the ionospheric cusp, Ann. Geophysicae, 13, 919, 1995.
Provan, G., Yeoman, T. K., and Milan, S. E., CUTLASS Finland radar observations of the ionospheric signatures of flux transfer events and the resulting plasma flows, Ann. Geophysicae, 16, 1411, 1998.
Provan, G. and Yeoman, T. K., Statistical observations of the MLT, latitude and size of pulsed ionospheric flows with the CUTLASS Finland radar. Ann. Geophysicae, 17, 855, 1999.
Provan, G., Yeoman, T. K., and Cowley, S. W. H., The influence of the IMF Bycomponent on the location of pulsed flows in the
day-side ionosphere observed by an HF radar, Geophys. Res. Lett., 26, 521, 1999.
Rodger, A. S. and Pinnock, M., The ionospheric response to FTEs: the first few minutes, Ann. Geophysicae, 15, 685, 1997. Ruohoniemi, J. M., Greenwald, R. A., Baker, K. B., Villain,
J.-P., Hanuise, C., and Kelley, J. D., Mapping high latitude plasma convection with coherent HF radars, J. Geophys. Res., 94, 13463, 1989.
Sandholt, P. E., Farrugia, C. J., Stauning, P., Cowley, S. W. H., and Hansen, T., Cusp/cleft auroral forms and activities in relation to ionospheric convection: Responses to specific changes in solar wind and interplanetary magnetic field conditions, J. Geophys. Res., 101, 5003, 1996.
Siscoe, G. L. and Huang, T. S., Polar cap inflation and deflation, J. Geophys. Res., 90, 543, 1985.
Villain, J. P., Greenwald, R. A., Baker, K. B., and Ruohoniemi, J. M., HF radar observations of E region plasma irregularities pro-duced by oblique plasma streaming, J. Geophys. Res., 92, 12327, 1987.
Weimer, D. R., Models of high-latitude electric potentials derived with a least error fit of spherical harmonic coefficients, J. Geo-phys. Res., 100, 19595, 1995.
Wright, A., Transfer of magnetosheath momentum and energy to the ionosphere along open field lines, J. Geophys. Res., 101, 13169, 1996.