HAL Id: hal-01845045
https://hal.umontpellier.fr/hal-01845045
Submitted on 3 Mar 2021
HAL is a multi-disciplinary open access
archive for the deposit and dissemination of
sci-entific research documents, whether they are
pub-lished or not. The documents may come from
teaching and research institutions in France or
abroad, or from public or private research centers.
L’archive ouverte pluridisciplinaire HAL, est
destinée au dépôt et à la diffusion de documents
scientifiques de niveau recherche, publiés ou non,
émanant des établissements d’enseignement et de
recherche français ou étrangers, des laboratoires
publics ou privés.
false positives
Natalia Pinzón, Blaise Li, Laura Martinez, Anna Sergeeva, Jessy Presumey,
Florence Apparailly, Hervé Seitz
To cite this version:
Natalia Pinzón, Blaise Li, Laura Martinez, Anna Sergeeva, Jessy Presumey, et al.. microRNA target
prediction programs predict many false positives. Genome Research, Cold Spring Harbor Laboratory
Press, 2017, 27 (2), pp.234 - 245. �10.1101/gr.205146.116�. �hal-01845045�
microRNA target prediction programs predict many
false positives
Natalia Pinzón,
1Blaise Li,
1Laura Martinez,
1Anna Sergeeva,
1,5Jessy Presumey,
2,3,6Florence Apparailly,
2,3,4and Hervé Seitz
11
Institut de Génétique Humaine, CNRS UPR 1142, 34396 Montpellier, France;
2INSERM, U1183, IRMB, University Hospital St Éloi,
34295 Montpellier, France;
3University of Medicine, 34060 Montpellier, France;
4Clinical Department for Osteoarticular Diseases,
University Hospital Lapeyronie, 34295 Montpellier, France
According to the current view, each microRNA regulates hundreds of genes. Computational tools aim at identifying
microRNA targets, usually selecting evolutionarily conserved microRNA binding sites. While the false positive rates
have been evaluated for some prediction programs, that information is rarely put forward in studies making use of their
predictions. Here, we provide evidence that such predictions are often biologically irrelevant. Focusing on miR-223-guided
repression, we observed that it is often smaller than inter-individual variability in gene expression among wild-type mice,
suggesting that most predicted targets are functionally insensitive to that microRNA. Furthermore, we found that human
haplo-insufficient genes tend to bear the most highly conserved microRNA binding sites. It thus appears that biological
functionality of microRNA binding sites depends on the dose-sensitivity of their host gene and that, conversely, it is
un-likely that every predicted microRNA target is dose-sensitive enough to be functionally regulated by microRNAs. We
also observed that some mRNAs can efficiently titrate microRNAs, providing a reason for microRNA binding site
conser-vation for inefficiently repressed targets. Finally, many conserved microRNA binding sites are conserved in a
microRNA-independent fashion: Sequence elements may be conserved for other reasons, while being fortuitously complementary to
microRNAs. Collectively, our data suggest that the role of microRNAs in normal and pathological conditions has been
overestimated due to the frequent overlooking of false positive rates.
[Supplemental material is available for this article.]
Together with a protein member of the Argonaute family, microRNAs (miRNAs) constitute the RNA-induced silencing com-plex (RISC), which represses specific mRNA targets by translation inhibition and mRNA decay (Iwakawa and Tomari 2015). Target recognition is typically mediated by imperfect base-pairing be-tween the miRNA and the mRNA. The large number of known miRNAs (several hundred distinct miRNAs in most animal model organisms) (Kozomara and Griffiths-Jones 2014), as well as the poorly specific rules for target recognition, result in a large fraction of coding genes predicted to be repressed by miRNAs in animals (between 19,000 and 20,000 human genes according to Betel et al. 2010 and Paraskevopoulou et al. 2013). Indeed, even after ac-counting for the background of false-positive predictions, about 11,000 human genes are predicted to be conserved targets of miRNAs (Friedman et al. 2009). Not surprisingly then, miRNAs have been proposed to control numerous biological processes in healthy conditions or in diseases (Bartel 2009; Shenoy and Blelloch 2014; Hata and Lieberman 2015).
From a quantitative point of view, however, miRNA target pression appears to be very limited, with endogenous miRNAs re-pressing their targets less than twofold, according to high-throughput proteomic and transcriptomic experiments (Baek et al. 2008; Selbach et al. 2008). Hence, it is currently believed that miRNAs exert most of their biological functions by
fine-tun-ing many mRNA targets, precisely settfine-tun-ing their protein output to its optimal abundance (Bartel and Chen 2004).
Yet, it is well-established that the activity of most genes in an-imals is robust to such small changes in gene expression levels, yielding constant phenotypes despite variable expression. Gene expression typically fluctuates by twofold when comparing two individuals in the human population (Cheung et al. 2003), two pools of individuals from a genetically homogenized Drosophila population (Laurie-Ahlberg et al. 1982), or two phenotypically identical mouse neural stem cells (Subkhankulova et al. 2008). Natural polymorphism in cis-regulatory sequences in the human population causes a large variability in gene expression, which is often greater than twofold (Rockman and Wray 2002).
Neutral regulatory events should be excluded from predic-tions. Therefore, comparative genomics is commonly used to iden-tify miRNA binding sites that have been phylogenetically conserved. Assuming that conservation is due to a selective pres-sure, significant conservation of a miRNA binding site is perceived as an indication of physiological functionality (Bartel 2009). Several miRNA target prediction programs have been written, most of which select candidate binding sites by scoring their phy-logenetic conservation (Friedman and Burge 2014). It seems that most effective miRNA binding sites in animals contain a perfect match to the“seed” (nucleotides 2–7) of the miRNA (Lai 2002; Lewis et al. 2003; Krek et al. 2005): Prediction programs typically
Present addresses:5MSU, The Museum of Natural History, Moscow,
Russia, 119991;6Children’s Hospital, Boston, MA 02115, USA
Corresponding author: [email protected]
Article published online before print. Article, supplemental material, and publi-cation date are at http://www.genome.org/cgi/doi/10.1101/gr.205146.116.
© 2017 Pinzón et al. This article is distributed exclusively by Cold Spring Harbor Laboratory Press for the first six months after the full-issue publication date (see http://genome.cshlp.org/site/misc/terms.xhtml). After six months, it is available under a Creative Commons License (Attribution-NonCommercial 4.0 International), as described at http://creativecommons.org/licenses/ by-nc/4.0/.
select conserved perfect or almost perfect seed matches in mRNA sequences, further refining candidate lists with various sequence or structure criteria. These computational programs are heavily used by the community in addition to experimental assessment of target repression: Phylogenetic conservation is taken as a proof that an experimentally measured repression plays a physiological role. Estimates of the false positive rate for conserved sites of some programs have been published, and they are close to 50% (Krek et al. 2005; Lewis et al. 2005; Friedman et al. 2009), yet this information is frequently ignored in published studies making use of these programs. We thus decided to explore the sources of false positives in miRNA target prediction.
Results
Sensitivity of gene activity to miRNA
The transcriptome-wide effect of a miRNA in a primary cell type has been measured in a few experimental setups, including target repression by granulocyte lineage-specific miR-223 in mouse neu-trophils (Chen et al. 2004; Baek et al. 2008; Johnnidis et al. 2008). The amplitude of miR-223-mediated repression on its targets was measured by comparing mRNA and protein levels in wild-type and Mir223 mutant neutrophils (but note that the experimental procedure did not allow the measurement of inter-individual var-iability: cells were pooled from several individual mice, thus, aver-aging out potential inter-individual differences) (Baek et al. 2008). We reasoned that inter-individual variability in gene ex-pression among wild-type animals is a faithful estimation of the ro-bustness of gene activity relative to fluctuations in gene expression levels. Wild-type populations, shaped by thousands of years of evolution, have been depleted in genome variants that lead to det-rimental gene expression levels. If miRNA binding sites had been selected because targeting by miRNAs maintains gene expression at a nondetrimental level, purifying selection should have elimi-nated any regulatory element that mediates variation in gene ex-pression with amplitudes similar or higher to miRNA-guided repression. We thus measured variability in neutrophil gene ex-pression among wild-type mice.
We isolated neutrophils from five wild-type mice (see
Sup-plemental Table S1for neutrophil purity) and quantified mRNA
abundance by whole-genome arrays. The effect of miRNAs on the abundance of target mRNAs is a good approximation of the ef-fect of the miRNA on protein abundance, at least at steady-state in vertebrates (Hendrickson et al. 2009; Guo et al. 2010; Bazzini et al. 2012), and transcriptomic methods are more sensitive than prote-omic methods (Baek et al. 2008; Selbach et al. 2008). Measuring pure translational repression by miRNAs would thus marginally improve the accuracy of our analysis, but it is currently not feasible at a genome-wide scale. In order to ensure that the dynamic range in our experiment is the same as in the experiment described by Baek et al. (2008), we used the same transcriptomic technology (Affymetrix whole-genome arrays), using 3-month-old C57BL/6 males as in that study.
In order to measure the technical noise introduced by the ex-perimental procedure, we also performed the same experiment on the pooled blood of five additional mice (see Fig. 1A). Taking into account technical variability, we could then compare the ampli-tude of inter-individual variation to the repressive effect of miR-223 on each predicted target (see Fig. 1B for an example). Each of the 10 mice was pathogen-free (39 common pathogens were screened), ensuring that their immune state was as homogeneous
as possible. miR-223 targets were predicted using TargetScan mouse (v. 6.2), which appears to be the most reliable predictor (Agarwal et al. 2015): 196 conserved targets are predicted, 192 of which are probed by the whole-genome array. Individual-to-indi-vidual variability in gene expression is typically twofold when comparing the most highly expressing mouse to the least highly expressing mouse among the five tested mice (seeSupplemental
Fig. S1). Our analysis shows that, for 150 predicted targets out of
192, inter-individual variability in gene expression exceeds the median effect of miR-223 on these genes (see Fig. 1C). Employing another normalization method for microarray data (Loess instead of RMA) only strengthened this result: Even with a p-value cutoff of 0.01, inter-individual variability exceeded the miR-223 effect for 186 genes out of 192.
Real targets for miR-223 (i.e., genes whose repression by the miRNA triggers a macroscopic phenotype) should exhibit tightly regulated expression levels among wild-type mice. Hence, we ex-pect real targets to be enriched among the 42 genes whose inter-in-dividual variability does not appear to exceed miR-223-guided repression. We note that one of these genes, Nlrp3 (see Fig. 1D), could be responsible for the neutrophil hyperactivity phenotype of Mir223 mutants (Johnnidis et al. 2008; Bauernfeind et al. 2012; Haneklaus et al. 2012). Restricting our analysis to mRNA/miRNA teractions with some experimental support (Vlachos et al. 2015) in-creased slightly, but not significantly, the proportion of genes with low inter-individual variability (seeSupplemental Table S2).
Our experiment only probed gene expression levels in mature neutrophils, whereas miR-223 is also expressed in neutrophil pro-genitors (Johnnidis et al. 2008). Some evidence suggests that mis-regulation of one predicted target, Mef2c, is responsible for the high neutrophil titer phenotype of Mir223 mutants, while it is not responsible for the hyperactivity phenotype (Johnnidis et al. 2008). We note that Mef2c expression levels appear highly variable in mature neutrophils, and that gene does not belong to the list of 42 genes enriched for real targets. These observations could mean that the two reported phenotypes for Mir223 mutant mice are ge-netically separable. For example, the hyperneutrophilic pheno-type could be due to the misregulation of Mef2c in progenitor cells, while the hyperactivity phenotype could be due to the mis-regulation of some of these 42 genes in mature neutrophils.
It could be argued that the activity of miR-223 in neutrophils is not uniform among the five tested mice, and the mouse express-ing targets most abundantly may also express the highest level of miR-223, eventually bringing target translation to the same level as in the other mice. This hypothesis would imply that, for every target, the five mice would appear in the same order if ranked by target abundance. This is not the case: There is no global trend sug-gesting that miR-223 targets are coordinately up- or down-regulat-ed from one individual mouse to the next (Supplemental Fig. S2). Hence, most predicted targets for miR-223 in neutrophils may not be functionally affected by the miRNA: The effect of miR-223 on these genes is smaller than inter-individual fluctuations in gene expression among wild-type mice. Yet, our experiment certainly underestimated inter-individual variability: First, the range of gene expression levels could only increase if more than five mice were analyzed. Second, we analyzed mice from an inbred strain (the C57BL/6 strain), which are more genetically homogeneous than wild mice. Therefore, the proportion of miR-223-insensitive predicted targets in neutrophils is probably even larger than 150/ 192.
In this experiment, we analyzed a single miRNA (miR-223) in a single cell type (mature neutrophils). Further analyses on
additional miRNAs would be required to assess experimentally the generality of our conclusions. Among the broadly conserved miRNAs, miR-223 is reported to have an unusually high propor-tion of false-positive predicpropor-tions, with only 40 of its 196 conserved targets listed as having a“probability of conserved targeting” (PCT)
exceeding 50% (Friedman et al. 2009). We also wish to point out that constitutive deletion of the miRNA gene may have resulted
in compensatory gene expression changes in Mir223 mutant neu-trophils, potentially blurring the direct effects of a loss of miR-223. With these limitations in mind, our data suggest that most individ-ual miR-223 binding sites are unlikely to play a biologically rele-vant role in repressing target genes in neutrophils.
We also have to emphasize that an alternative interpretation can be proposed: It can be envisioned that some variably expressed Figure 1. Inter-individual variability in miR-223 target expression is frequently larger than miR-223-guided repression. (A) Principle of the experiment. (B) The measured microarray signal is the sum of the underlying biological value and technical noise (here illustrated with the Styx gene). Measured signals (m1–m5) are deconvoluted using the measured technical variability (seeSupplemental Experimental Procedures). (C ) For each predicted miR-223 target,
the amplitude of miR-223-guided repression is compared to the amplitude of gene expression variability across the five mice (here illustrated with the Styx gene). The p-value measures the probability that the underlying biological variability is smaller than miRNA-guided repression. We used the median repres-sion value measured by Baek et al. (2008) (represented by the red horizontal bar) to estimate miR-223-guided represrepres-sion. (D) Genes whose inter-individual fluctuations are not significantly larger than miR-223-guided repression (p≥ 0.05). Middle column: fold-change due to miR-223-mediated repression ac-cording to data of Baek et al. (2008) (note that some genes have a fold-change < 1, thus appearing to be up-regulated by the miRNA: these genes may be indirectly affected by miR-223). Right column: p-value, measured as in panel C (median across all probe sets for that gene).
genes trigger detrimental phenotypes if expressed above a given threshold. miRNA-mediated repression would thus only be benefi-cial in individuals (or in cells) at the high end of the expression range. In that case, target repression would be conserved because of its utility in the population at large, without being required in every individual. If this were the case, and given the large number of variably expressed genes in our data, such“fail-safe” tions (Bartel 2009) would thus outnumber fine-tuning interac-tions in neutrophils.
Dose-sensitive genes bear the most highly conserved miRNA
binding sites
In order to test the generality of our conclusion regarding the fre-quent insensitivity to miRNAs, we explored the relationship be-tween dose-sensitivity and gene targeting by miRNAs. Real targets are expected to bear the most highly conserved miRNA binding sites. Genes whose repression by the miRNA is physiolog-ically inconsequential should lose their miRNA binding sites more easily in evolution, even if the mRNA/miRNA interaction plays a miRNA-titrating function (Seitz 2009). Hence, the existence of false positives in miRNA target prediction implies that the most dose-sensitive genes should exhibit the most highly conserved miRNA binding sites.
In contrast, considering that predicted miRNA targets are devoid of false positives would simply assume that every predicted target gene is dose-sensitive enough to be functionally affected by miRNAs. miRNA binding site conservation is not expected to cor-relate with dose-sensitivity: Conservation should depend on the functional importance of the repression of any given gene but not on its dose-sensitivity, which is always assumed to be sufficient for functional regulation.
Probably the most accurate available metrics for miRNA bind-ing site conservation is the PCTdescribed by Friedman et al. (2009).
It takes into account the topology of the phylogenetic tree as well as differences in overall conservation between untrans-lated regions (UTRs) to estimate the likelihood that a seed match is under selective pressure.
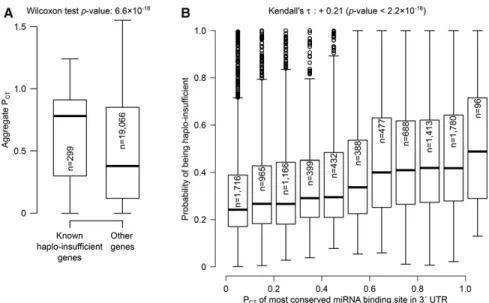
There exists currently no high-throughput method to identify dose-sensitive genes in metazoans. A curated list of haplo-insufficient genes (a type of dose-sensitive genes) is, however, avail-able in humans (Dang et al. 2008). miRNA binding site conservation is sig-nificantly higher in haplo-insufficient genes than in other human genes (see Fig. 2A). Computational methods have also been proposed to predict dose-sen-sitive genes: Huang et al. (2010) published a heuristic method based on genomic, molecular, and functional properties of known human haplo-in-sufficient genes. For each gene, we thus compared its probability of haplo-insufficiency (from the Huang et al. 2010 data) to its highest PCT(i.e., across
all miRNA families with predicted bind-ing sites in that gene, we extracted that with the highest PCT). We found that
the probability of being haplo-insufficient correlates positively with the conservation of the most conserved miRNA binding site (see Fig. 2B).
Such correlation would not have been expected if every com-putationally predicted target was biologically sensitive to miRNA action. The fact that miRNA binding site conservation seems to depend on the host gene’s dose sensitivity rather suggests that ev-ery predicted target is actually not dose-sensitive enough to be functionally affected by miRNAs. Our results thus confirm that miRNA target predictions are contaminated with large numbers of false positives, which were estimated to constitute about half of current prediction lists for some programs (Krek et al. 2005; Friedman et al. 2009).
Assessement of miRNA titration by mRNAs
If, indeed, a large fraction of predicted miRNA targets are function-ally insensitive to the modest miRNA-guided repression, one may ask why they bear phylogenetically conserved seed matches. We proposed that some miRNA binding sites may serve as miRNA ti-trators: Some sites may be conserved because of their miRNA mod-ulating activity, not because of their weak repression of the mRNA (Seitz 2009).
Others have tentatively probed the miRNA-titrating activity of an mRNA (competing endogenous RNA,“ceRNA”) (Poliseno et al. 2010; Salmena et al. 2011), but the proposed titrator is not abundant enough to modulate miRNA activity (Ebert and Sharp 2010). Published experimental evidence relies essentially on ceRNA overexpression experiments, which do not address the ti-trating activity of ceRNA endogenous levels, and ceRNA knock-down experiments by RNAi, where overaccumulation of miRNA targets was perceived as a proof of ceRNA activity. However, the siRNAs used in these experiments exhibit off-target seed matches on target sequences, providing an alternative explanation of the
Figure 2. Human haplo-insufficient genes tend to bear the most highly conserved miRNA binding sites. (A) Known haplo-insufficient genes in humans (Dang et al. 2008) exhibit more conserved miRNA binding sites than other human genes. (B) Conservation of miRNA binding sites correlates with the probability of human genes for being haplo-insufficient, as calculated by Huang et al. (2010) (genes were binned into boxplots according to their PCTfor clarity). In every boxplot in this figure, the number of
genes in each category is indicated inside the boxes. Note: Even though the PCTwas initially defined as a
probability (Friedman et al. 2009), values in the latest PCTdata set (in TargetScan v7, described in Agarwal
observed decrease in target mRNAs upon ceRNA knock-down. Consequently, the consensus now states that mRNAs are unlikely to exert any noticeable titration of miRNAs in the general case (Garcia et al. 2011; Wee et al. 2012; Denzler et al. 2014). It has been proposed that efficient titration could be restricted to high-af-finity target sites, for miRNAs with a low miRNA:target ratio (Bos-son et al. 2014). But another study, performed on a similar biological system with a different methodology, concluded that
even poorly expressed miRNAs are un-likely to be efficiently titrated by any in-dividual mRNA (Denzler et al. 2016).
In order to compare mRNA and miRNA concentrations in a meaningful manner, the analyzed biological sample has to be as homogeneous as possible. We thus decided to study the murine C2C12 cell line. We focused on two myo-tube-specific miRNA families: miR-1a/ miR-206 and miR-133. Both are ex-pressed during the differentiation of C2C12 into myotubes (Chen et al. 2006; Kim et al. 2006), which is inducible in culture, and miR-1a/miR-206 is in-volved in the control of differentiation (Goljanek-Whysall et al. 2012).
Quantifying miR-1a/miR-206 and miR-133 by calibrated Northern blots (see Fig. 3A), we found that the abun-dance of miR-1a/miR-206 molecules per cell increases from≈500 (differentiation day 0) to ≈17,000 (day 6), while the abundance of miR-133 increases from ≈250 (day 0) to ≈2400 (day 4) molecules per cell (see Fig. 3B).
RNA targets for these miRNAs were identified by AGO RIP-seq (RNA immu-noprecipitation followed by poly[A]-in-dependent RNA-seq). In order to identify and exclude nonspecific purification of untargeted mRNAs—e.g., miRNA-inde-pendent recruitment of RISC on mRNAs (Leung et al. 2011)—we performed differ-ential RIP-seq (similar to the differdiffer-ential CLIP described by Loeb et al. [2012]) between cells transfected with antisense oligonucleotides against miR-1a and miR-206, or against miR-133, and with a control oligonucleotide that does not match any murine miRNA seed sequence (see Fig. 3C;Supplemental Fig. S3). Trans-fected antisense oligonucleotides can efficiently inhibit miRNAs, in particular in C2C12 cells (Hutvágner et al. 2004; Goljanek-Whysall et al. 2012). Cells were transfected after 2 d of differentia-tion, then 1 d later they were cross-linked and AGO-RNA complexes were immuno-precipitated for RNA-seq library prepara-tion. Each condition was analyzed as three biological replicates.
mRNAs that are reproducibly im-munoprecipitated in the three control replicates, while being depleted in the three replicates of antisense oligonucleotide-treated cells, were annotated as“experimentally identified mRNA targets.” Our procedure identified 37 targets for the miR-1a/miR-206 family and 17 targets for the miR-133 family (note that these are all coding RNAs, but noncoding RNAs were in-cluded in our analysis) (see Fig. 3D). Approximately 40% of our ex-perimentally identified targets bear perfect seed matches to the miRNA of interest in their 3′UTRs. As previously reported (Loeb Figure 3. Identification of candidate miRNA-titrating mRNAs in differentiating C2C12 cells. (A) Left
lanes: synthetic miR-1a and miR-206 (for calibration). (M) Size marker. Right lanes: 20 µg total RNA from differentiating C2C12 cells. (B) Quantification of three biological replicates of the experiment shown in panel A for each miRNA family (mean ± standard error). (C ) Experimental identification of miR-1a/miR-206 and miR-133 targets in C2C12 cells. Cells were transfected with 2′-O-Me oligonucleotides directed against miR-1a and miR-206, against miR-133, or against no murine miRNA (“anti-Ø”). mRNAs immu-noprecipitated with AGO proteins were quantified by poly(A)-independent RNA-seq. (D) Identified miRNA targets for miR-1a/miR-206 (top panel) and miR-133 (bottom panel). Red: mRNAs with 3′UTR perfect seed matches. Blue: mRNAs whose best 3′UTR match is one of the top three enriched imperfect matches (CNATTCC, CATNCC, or CNTTCC for miR-1a/miR-206; GACCANA, GNACCAA, or GACNCAA for miR-133). (E) Free and bound miRNA concentrations were calculated from our measures, and after conceptual loss of the miRNA binding site of interest. (F ) Binding sites that exert the highest titrating ac-tivity (>10% increase in free miRNA concentration if site is lost).
et al. 2012; Agarwal et al. 2015), experimentally identified targets also frequently exhibit imperfect seed matches for the miRNAs of interest (shown in blue in Fig. 3D).
With miRNA target lists in hand, we quantified mRNA abun-dance by calibrated ultradeep RNA-seq in the three biological rep-licates of differentiating C2C12 cells at day 0, day 3, and day 6 (see sequencing statistics inSupplemental Table S3; calibration scatter plots are shown inSupplemental Fig. S4A: calibration precision is within a factor≈2). Unsupervised clustering of the RNA-seq data indicates high replicate-to-replicate reproducibility and reveals a differentiation signature in gene expression patterns (see
Supplemental Fig. S4B).
Combining RNA quantification with our measurement of cell volume, we could calculate intracellular RNA concentrations for miRNAs and mRNAs. Using the law of mass action, we used the published dissociation constant between murine RISC and its tar-gets (Wee et al. 2012) to calculate the equilibrium between free and bound miRNA for both miR-1a/miR-206 and miR-133 families. (The dissociation constant between RISC and its targets was mea-sured on let-7-loaded RISC [Wee et al. 2012], but we note that miR-1a/miR-206 and miR-133 seeds have similar predicted affini-ties to their seed matches, within 15%.) To calculate total miRNA binding site concentration, we weighted the concentration of ev-ery experimentally identified target by its number of seed matches (considering perfect seed matches as well as the three most fre-quently observed imperfect seed matches). Performing the same calculation after conceptual loss of a single binding site in a single target (i.e., weighting that target’s concentration by number of sites − 1 instead of number of sites) allowed us to evaluate the individual contribution of each binding site to miRNA titration (see Fig. 3E). This analysis predicts that several miRNA binding sites exert a strong titrating effect on miR-1a/miR-206 or miR-133 (seven mRNAs appear to titrate at least 10% of either miR-1a/miR-206 or miR-133 in at least one time point) (see Fig. 3F). For instance, Tmsb4x appears to titrate half of the free pool of miR-1a/miR-206 at each time point: If Tmsb4x lost its miR-1a/miR-206 binding site, the free pool of miR-1a/miR-206 would be expected to rise by≈50%. Of note, the dynamical behavior of these seven strong titrators does not differ significantly from that of the other exper-imentally identified targets (p-value = 1 both for miR-1a/miR-206 and for miR-133 according to a two-way ANOVA assessing both the contribution of differentiation time and of the titrating status to gene expression dynamics).
In order to verify experimentally the titrating effect of Tmsb4x on miR-1a/miR-206 availability, we mutated its 3′UTR in C2C12 cells with high-fidelity nuclease“SpCas9-HF1” (Kleinstiver et al. 2016). Using homologous recombination, we introduced a reporter cassette for miR-1a/miR-206 activity, while simultaneously mutat-ing the Tmsb4x miR-1a/miR-206 seed match (see Fig. 4A). As a con-trol, we also generated cell lines with the same reporter cassette but without any mutation in the Tmsb4x miR-1a/miR-206 seed match. Nine independent polyclonal cell lines were obtained: five wild-type lines and four lines where the Tmsb4x miR-1a/miR-206 seed match is mutated. In each of the mutant lines, ∼50%–80% of Tmsb4x alleles appear to be mutated (seeSupplemental Fig. S5). Cells were then differentiated, and miR-1a/miR-206 activity was monitored by quantifying luciferase activity: Mutant cells exhibit a significantly lower reporter activity than wild-type cells, demon-strating that endogenous levels of the Tmsb4x mRNA indeed strongly titrate miR-1a/miR-206 in C2C12 cells (see Fig. 4B).
Previous analyses indicate that only miRNA families with a low miRNA:target ratio are susceptible to titration (Bosson et al. 2014).
Our measurements indicate that miR-1a/miR-206 and miR-133 in-tracellular concentrations range between 0.2 and 20 nM in differen-tiating C2C12 cells, while the total concentration of their differential RIP-seq-validated targets falls in the micromolar range. Our observation of Tmsb4x-mediated titration is thus consistent with the conclusions of Bosson et al. (2014). It is, however, hard to reconcile with the notion proposed by Denzler et al. (2016), stat-ing that an efficient titratstat-ing site has to reach∼10%–40% of the ef-fective target abundance, which can be roughly estimated by the total concentration of 6-, 7-, and 8-mer 3′UTR sites for the miRNA of interest. In our libraries, the Tmsb4x miR-1a/miR-206 binding site accounts for∼1% of the total miR-1a/miR-206 3′UTR sites.
Our results thus show that some mRNAs can modulate miRNA activity by titration. Such function could be selected in evolution if beneficial, explaining why some miRNA binding sites are conserved while they are located in genes that are not strongly repressed enough by the miRNAs to be functionally regulated. For example, Tmsb4x may not be repressed enough to be functionally sensitive to miR-1a/miR-206, and its miR-1a/miR-206 binding site could only be conserved because of its miR-1a/miR-206-titrating action: Tmsb4x would, therefore, be a false positive in current tar-get identification procedures.
Figure 4. Tmsb4x titrates efficiently miR-1a/miR-206 in differentiated C2C12 cells. (A) Mutagenesis strategy. A luciferase reporter and G418 re-sistance cassette was introduced 286 bp downstream from the Tmsb4x poly(A) signal, and the Tmsb4x 3′UTR was replaced by a copy where the miR-1a/miR-206 seed match is either replaced by itself (“wt”) or by a hex-amer that is not matched by any known murine miRNA seed (“mutant”). (B) Luciferase activity was assessed in each of the five wild-type and four mutant polyclonal cell lines after differentiation. Each cell line was analyzed as 12 technical replicates (replicates for the same cell line are represented by the same symbol and same color). Mixed-effect linear modeling (taking into account heteroscedasticity within each genotype) shows that geno-type of the Tmsb4x miR-1a/miR-206 binding site has a significant effect on reporter activity (p = 0.0285).
Titration refines miRNA expression patterns
While half a dozen mRNAs appear to exert a clear effect on miRNA titration in differentiating C2C12 cells, these genes only constitute a minority of predicted miR-1a/miR-206 and miR-133 targets. It is possible that most predicted targets do not efficiently titrate miRNAs in any cell type. Alternatively, one can imagine that addi-tional titrators exist for miR-1a/miR-206 and miR-133 in other cell types, where they are expressed abundantly enough.
A testable prediction can be implied from the latter possibil-ity: If, indeed, some mRNAs play a beneficial miRNA titrating role in various cell types, then in each of these cell types, titrating
mRNAs should be highly expressed. The more beneficial the titra-tion, the more conserved the interaction between these mRNAs and the miRNA: It can thus be expected that the most highly ex-pressed miRNA targets should be under the strongest selective pressure to keep their miRNA binding sites. Hence, if mRNAs can exert an efficient titration of miRNAs, one would expect a positive correlation between mRNA abundance and the conserva-tion of their miRNA binding sites in most tissues. Real targets are not expected to exhibit such a correlation, but as they are expect-ed to be outnumberexpect-ed by physiologically insensitive targets (the activity for most genes in animals being robust to an≈twofold change in expression), they should not affect the overall correlation.
For each gene, we thus compared miRNA binding site conser-vation (quantified by their PCT[Friedman et al. 2009]) to mRNA
abundance in publicly available transcriptomic data sets from a va-riety of mouse tissues (seeSupplemental Table S4). We observed that, for most murine miRNA families, mRNA abundance is, in-deed, positively correlated with miRNA binding site conservation (positive Kendall’s τ correlation coefficient, with a low adjusted p-value) (bottom right quadrants in the volcano plots shown in Fig. 5A andSupplemental Fig. S6; see also Farh et al. [2005]; Sun et al. [2012]). Note that the PCTcompensates for 3′ UTR overall
conservation (binding sites located in highly conserved UTRs have to be even more conserved themselves to attain the same PCTthan binding sites in poorly conserved UTRs). This feature
cor-rects potential biases in sequence conservation between poorly and abundantly expressed genes.
Interestingly, correlation was particularly strong not only for miRNAs that are highly expressed in the analyzed tissue, such as miR-1a/miR-206 and miR-133 in muscle, but also for miRNAs that are specific to a tissue other than the one analyzed (e.g., liv-er-specific miR-122 in the muscle) (see Fig. 5B). This suggests that the transcriptome of each cell type is not under a strong selec-tive pressure to modulate its abundant miRNAs. It mostly titrates miRNAs specific for other tissues (presumably, whose expression is detrimental in that cell type). A notable exception to this rule is the brain, where neuron-specific miRNAs seem to exert the strongest selective pressure on miRNA binding sites in the tran-scriptome (see bottom right panel of Fig. 5B). This may be due to the large diversity among neurons, with miRNA titration being beneficial for some neuron-specific miRNAs in neurons that do not express them. Of note, miRNAs specific to another tissue than the one analyzed tend to be expressed at very low levels, cast-ing doubt on the biological advantage of titratcast-ing miRNAs that are already hardly active. But mRNAs themselves could contribute to the decrease in miRNA levels through target-mediated degradation (Ameres et al. 2010; Xie et al. 2012; Denzler et al. 2016), in which case interaction with these miRNAs in these cell types could mod-ulate miRNA efficiently, not through pure competition but by pro-moting miRNA degradation.
Our results suggest that various cell types express high levels of mRNAs that either titrate or promote the degradation of miRNAs which are most strongly expressed in other cell types. These considerations could promote a new interpretation of a well-known phenomenon: miRNAs and their predicted targets tend to be expressed in an overlapping, yet noncoincident fashion. Cells expressing highest miRNA levels tend to be devoid of target expression and reciprocally (Farh et al. 2005; Stark et al. 2005; Shkumatava et al. 2009). When miRNA expression varies continu-ously across the analyzed cell bins, miRNAs and their predicted tar-gets mostly overlap in cells where both the miRNA and the Figure 5. The most highly expressed genes tend to bear the most highly
conserved miRNA binding sites. (A) Volcano plots represent correlation co-efficients between microarray signal and the aggregate probability of con-served targeting (PCT) for each mRNA (x-axis), and their p-values (y-axis).
Each miRNA family is represented by a circle. p-values were adjusted using the Benjamini-Hochberg correction. The dotted red line indicates an ad-justed p-value of 0.05 and the dotted black line indicates a correlation co-efficient of zero. Adjusted p-values lower than 2.2 × 10⁻¹⁶were set to 2.2 × 10⁻¹⁶for graphical clarity. (B) Same conventions as in panel A, but miRNA families with highly specific expression patterns are colored (red: miRNA specific for another tissue than the one analyzed; blue: miRNA specific for the analyzed tissue).
predicted targets are moderately expressed (Farh et al. 2005). It has been proposed that such organization implies that miRNAs prefer-entially repress targets in cells where their targets are already par-tially repressed by other mechanisms. Alternatively, we propose that some mRNAs titrate miRNAs preferentially in cells where the miRNA is already poorly expressed.
False positives in comparative genomics
Computational prediction of miRNA targets usually relies on the identification of phylogenetically conserved seed matches (Friedman and Burge 2014). Our results suggest that just a small fraction of genes with conserved seed matches are sensitive enough to small changes in expression to be functionally regulat-ed by miRNAs (Figs. 1, 2). Among the remaining prregulat-edictregulat-ed tar-gets, some may bear conserved seed matches because of their miRNA-titrating activity (Figs. 3–5). It is hard to tell how many titrator mRNAs exist: For every gene, even among those that ap-pear to be poorly expressed, it is formally possible that its expres-sion level is high in a particular cell type or developmental stage, where it could exert a beneficial miRNA titration. Alternatively, it is possible that many predicted targets are neither functionally sensitive to miRNA-guided repression, nor efficient at titrating miRNAs. Genes in this“gray zone” would thus exhibit conserved seed matches for a reason not attributable to functional targeting nor to efficient miRNA titration. Phylogenetic conservation of such seed matches would remain to be explained. We thus decid-ed to explore the possibility that the results of some comparative genomics-based methods could be contaminated by false positives.
It is indeed possible that a sequence may be conserved because of some other, miRNA-independent reason, while fortu-itously being complementary to a miRNA seed (Friedman et al. 2009). Conservation of that sequence would thus be mistakenly at-tributed to the functionality of the miRNA/mRNA interaction. It is possible to calculate an estimation of the frequency of such false positives by scoring conserved seed matches in species devoid of miRNAs with that seed sequence (miRNAs sharing the same seed belong to the same“miRNA family”). Using the human-centered 100-species whole genome alignment from UCSC (Rosenbloom et al. 2015), we identified 3′UTR seed matches that appear to be more conserved than the miRNA seed itself (see Fig. 6A for an ex-ample). Such“overconserved” seed matches could result in false positives in miRNA target prediction schemes. Their conservation is independent of their interaction with the miRNA: It may be due to other trans factors (such as DNA-binding proteins or RNA-bind-ing proteins), for example.
Comparative genomics-based target prediction programs screen conserved miRNA binding sites for additional criteria (local AU content, pairing to the miRNA 3′ moiety, etc.), which may decrease the false positive rate. Indeed, binding sites predicted by the most popular target prediction algorithms tend to be less fre-quently overconserved than the bulk of 3′UTR seed matches (cf. Fig. 6B,C; seeSupplemental Table S5; note that a widely used pre-diction program, TargetScan, cannot be analyzed here: it does not rely on phylogenetic conservation for miRNAs specific to mam-mals or to shallower mammalian clades). This observation indi-cates that they are less prone to selecting overconserved seed matches than a simple seed match search. Yet, even these pro-grams are heavily contaminated with overconserved seed matches (e.g.,≈50%–70% for most Hominidae-specific seeds in microT and miRanda predictions).
Frequency of overconserved sites shows a striking depend-ency on the phylogenetic depth of the clade of interest: Shallow clades (e.g., Hominidae) tend to exhibit higher rates of overcon-served sites than deep clades (e.g., Euteleostomi). We could imag-ine several interpretations for that phenomenon: (1) miRNA annotation could be less reliable for poorly conserved miRNAs, re-sulting in a high contamination of Hominidae-specific miRNAs by small RNAs which are actually not miRNAs; (2) any given seed match is less likely to be conserved outside deep clades than out-side shallow clades, because it has a higher chance of being lost in a longer evolutionary divergence; or (3) there are more species outside shallow clades than outside deep clades, increasing the chances that an outer species possesses the seed match. In order to assess these possibilities, we measured the proportion of seed matches conserved outside four clades of various depths and for variably conserved seeds (see Fig. 6D;Supplemental Fig. S7). The results show that the number of conserved seed matches decreases when assessing conservation outside deeper clades, and the decrease is similar for all four seed types (Hominidae-specific, Catarrhini-specific, Boreoeutheria-specific, and Euteleostomi-spe-cific seeds). This observation indicates that such decrease is not due to a differential quality of miRNA annotation between deeply conserved and poorly conserved miRNAs. It is simply a conse-quence of the arborescent structure of evolution (interpretations [2] and [3] above). In fact, hexamers that do not match the seed of any known vertebrate miRNA exhibit the same pattern (in black in Fig. 6D), confirming that it is due to the tendency for sequence elements to be more easily conserved outside shallow clades than outside deep clades.
Hence, the false positive rate for miRNA seeds in general is like-ly to be closer to the rate of overconserved sites for Hominidae-spe-cific seeds than for speHominidae-spe-cific seeds: Euteleostomi-specific seeds have lower rates of overconserved sites only because of the general property of overconserved sites to be rare in deep clades. But the propensity of the analyzed target prediction pro-grams to capture false positives is probably similar to that of Hominidae-specific miRNAs, because they use the same predicting criteria for deeply conserved and poorly conserved miRNA families, and they are likely to be similarly contaminated by transcription factor or RNA-binding protein binding sites. Thus, by this measure, the false positive rate for microT and miRanda appears to approach 50% or 70%, while our approach is unable to estimate it for PicTar and TargetScan, which do not attempt to predict biological rele-vance by phylogenetic analysis for the least conserved miRNAs.
Discussion
Assessment of the involvement of miRNAs in a biological process usually relies on two types of tests: measurement of the effect of a miRNA on the expression of a target gene by molecular biology methods (e.g., reporter assays), and the identification of phyloge-netically conserved miRNA binding sites in the target mRNA. Techniques in molecular biology may reveal a direct or indirect ef-fect of the miRNA on a gene’s expression, but they cannot address the physiological significance of such regulation. Hence, the dem-onstration of phylogenetic conservation of the interaction be-tween a miRNA and a mRNA has been central in the validation of proposed interactions: Even if the target is poorly repressed, its regulation was considered biologically important because it is conserved in evolution.
Lists of miRNA targets found by molecular biology experi-ments or by computational predictions are frequently used to infer
miRNA biological functions: Depending on prediction programs, false positive rates of several tens of percent thus heavily contam-inate such functional inferences. miRNAs certainly have a real physiological effect but only through regulation of genes whose activity is sensitive to moderate repression. It has been proposed that miRNAs act globally on gene networks and the simultaneous
modest regulation of many genes would trigger a large phenotypic response (Flynt and Lai 2008). In theory, this property could ex-plain why individual miRNA/mRNA interactions do not control any selectable phenotype, while the coordinated regulation of many mRNAs does. However, it should be kept in mind that each individual miRNA binding site evolves independently from Figure 6. Computationally identified conserved seed matches are frequently more conserved than miRNA seeds themselves. (A) The miR-134 family is specific to placental mammals, but its predicted binding site in USP9X is more broadly conserved. (B) Four vertebrate clades had enough clade-specific miRNA families for a detailed statistical analysis (10 Hominidae-specific families, 14 Catarrhini-specific families, 14 Boreoeutheria-specific families, 10 Euteolostomi-specific families) (seeSupplemental Fig. S7). Each point in the boxplot represents an miRNA seed family. The proportion of overconserved 3′UTR seed matches is defined as the fraction of matches that are conserved in at least one species outside the clade of interest. (C ) Proportion of over-conserved seed matches among the predictions of several miRNA target prediction programs. Note that PicTar2 ignores Hominidae- and Catarrhini-spe-cific miRNAs, while TargetScan predicts and ranks targets of mammalian-speCatarrhini-spe-cific miRNAs without using phylogenetic conservation. In order to make every program output comparable, analyses were restricted to perfect seed matches in 3′UTRs, excluding matches that overlap exon–exon junctions (see
Supplemental Table S5for detailed statistics). (D) 3′UTR seed matches were analyzed as in panel B, but each group of clade-specific seeds was scored
for conserved seed matches outside each of the four clades. Nonseed hexamers (i.e., hexamers that do not constitute the seed of any vertebrate miRNA in miRBase 21) were analyzed identically.
the others: If it does not have a selectable effect by itself, then it should mutate at the same rate as nonfunctional genomic ele-ments. And indeed, genetic validation of the physiological role of mRNA/miRNA interactions usually points to a single target be-ing responsible for all the reported phenotypes of any miRNA mu-tant. To our knowledge, there is currently only one in vivo experiment showing that multiple targets contribute to a miRNA mutant phenotype: the string and wingless targets for miR-965 in Drosophila (Verma and Cohen 2015). All the other published in vivo assessments of the implication of targets in miRNA mutant phenotypes pointed to a single target each.
Recent technological advances now allow a precise dissec-tion of regulatory networks: Mutating miRNAs and targets of in-terest with the CRISPR/Cas9 system, it is now possible to disrupt and restore individual interactions on demand (Ecsedi et al. 2015). It is expected that similar analyses will be performed in the near future: Our prediction is that they will show that the ob-served phenotypes of miRNA mutants are due to a few dose-sen-sitive genes, rather than to a global misregulation of the whole “target-ome.”
That notion could explain why miRNA mutants usually ex-hibit much more specific and limited phenotypes than could be anticipated from the functions of their numerous published tar-gets (Alvarez-Saavedra and Horvitz 2010; Park et al. 2010; Chen et al. 2014; Ecsedi et al. 2015) and why phenotypes of miRNA mu-tants are often hard to infer a priori from the list of expected targets (Li and Carthew 2005; Sokol et al. 2008; Elia et al. 2009; Shaw et al. 2010). Our results thus imply that microRNA target predictions should be used with caution, always considering the possibility that any given predicted target is a false positive.
Methods
Measurement of inter-individual variability in neutrophil
gene expression
Pathogen-free S/SPF C57BL/6J mice were obtained from Charles River Laboratories. Experiments were performed using 10 3-month-old male mice. Approval for these studies was obtained from the Ethics Committee on Animal Research of the Languedoc-Roussillon region (CE-LR-0505). Five blood samples were analyzed separately (“biological replicates”), and five others were pooled, then split into five“technical replicates.” All 10 sam-ples were then treated identically in a double-blind manner. mRNAs were quantified using Affymetrix whole-genome array HT MG-430 PM and the 3′-IVT labeling kit, by the IRB microarray facility (IRB, CHRU-INSERM-UM1 Montpellier). Additional exper-imental details can be found in Supplemental Experimental
Procedures, section 1.1.
RIP-seq-based identification of miRNA targets
C2C12 differentiation was induced as described (Sweetman et al. 2008). Two days later, cells were transfected with 20 nM antisense oligonucleotides using Lipofectamine 2000 (Invitrogen). Oligonucleotides are described in Supplemental Experimental
Procedures, section 1.6. Cells were cross-linked 24 h after
transfec-tion. For AGO RIP-seq, cDNA libraries were prepared from im-munoprecipitated RNA by BGI Tech Solutions using poly(A)-independent RNA-seq, with the fragmentation step performed pri-or to reverse-transcription. Additional experimental details can be found inSupplemental Experimental Procedures, section 1.3.1.
Calculation of mRNA-mediated miRNA titration efficiency
Cell volumes were calculated by approximating cells to ellipsoids, whose semimajor axis and semiminor axis were measured on mi-croscopy pictures of trypsinized cells, resuspended in medium. Pictures were internally calibrated using 4.5-µm diameter beads, and cells were colored with Texas red-conjugated wheat germ ag-glutinin for a better contrast.
The equilibrium between free and bound miRNA was calcu-lated using the dissociation constant measured by Wee et al. (2012):
[ free miRNA][ free binding sites] [miRNA/mRNA duplex] = Kd with:
• [miRNA/mRNA duplex] = the total concentration of miRNA/ mRNA duplex between the miRNA of interest and its mRNA targets,
• measured miRNA concentration = [ free miRNA] + [miRNA/mRNA duplex], and
• measured binding site concentration = [ free binding site] + [miRNA/ mRNA duplex].
“Measured binding site concentration” was measured by summing the concentrations of every experimentally identified target, weighted by their number of perfect or imperfect seed matches (considering the three most frequently observed imper-fect seed matches) (see their sequences in the legend for Fig. 3D). Conceptual loss of an individual binding site was achieved by de-creasing that weight by one site.
Comparison of seed match conservation with seed
conservation in vertebrates
Orthologous sites in 3′UTRs were extracted from UCSC Genome Browser’s 100 species whole-genome alignment using reference gene UTR annotation. Clade-specific miRNA seeds were defined as the seeds present in at least 75% of the species in the clade of in-terest, while being absent in every species outside that clade. For a seed to be flagged as“absent” from a species, it had to be absent from the set of miRBase-annotated miRNA seeds for that species, but also that species’ genome was required to be devoid of any pre-dicted hairpin orthologous to known hairpins expressing a miRNA with that seed in other vertebrate species. Additional experimental details can be found inSupplemental Experimental Procedures, section 1.5.
Data access
Raw and processed microarray data from this study have been sub-mitted to the NCBI Gene Expression Omnibus (GEO; http://www. ncbi.nlm.nih.gov/geo/) under accession number GSE59549. Raw RNA-seq data have been submitted to the NCBI Sequence Read Archive (SRA; http://www.ncbi.nlm.nih.gov/sra/) under accession numbers SRP036149 (RNA-seq during C2C12 differentiation) and SRP065380 (RIP-seq on differentiation day 3).
Acknowledgments
We thank Prof. Z. Mourelatos for the generous gift of anti-mamma-lian Ago 2A8 ascites, as well as Y. Tomari, S. Chambeyron, J. Martinez, I. Busseau, and G. Canal for critical reading of the manuscript, and M. Baragatti for assistance with statistical analyses. Affymetrix microarrays were processed in the Microarray core facility of the IRB, CHRU-INSERM-UM1
Montpellier. Cytometry was performed at the Montpellier RIO im-aging facility. Research in the Seitz lab is funded by the Human Frontier Science Program (CDA-00017/2010-C), CNRS, and Sanofi (ATIP-Avenir program), and La Ligue nationale contre le cancer (postdoctoral fellowship to N.P.). We thank a community leader who suggested important modifications, which were made in the proof stage.
Author contributions: N.P., J.P., F.A., and H.S. conceived the ex-periments. N.P., L.M., A.S., and J.P. performed the exex-periments. N.P., B.L., and H.S. analyzed the data. N.P., B.L., and H.S. wrote the article.
References
Agarwal V, Bell GW, Nam JW, Bartel DP. 2015. Predicting effective microRNA target sites in mammalian mRNAs. eLife4: e05005. Alvarez-Saavedra E, Horvitz HR. 2010. Many families of C. elegans
microRNAs are not essential for development or viability. Curr Biol20: 367–373.
Ameres SL, Horwich MD, Hung JH, Xu J, Ghildiyal M, Weng Z, Zamore PD. 2010. Target RNA–directed trimming and tailing of small silencing RNAs. Science328: 1534–1539.
Baek D, Villén J, Shin C, Camargo FD, Gygi SP, Bartel DP. 2008. The impact of microRNAs on protein output. Nature455: 64–71.
Bartel DP. 2009. MicroRNAs: target recognition and regulatory functions. Cell136: 215–233.
Bartel DP, Chen CZ. 2004. Micromanagers of gene expression: the poten-tially widespread influence of metazoan microRNAs. Nat Rev Genet5: 396–400.
Bauernfeind F, Rieger A, Schildberg FA, Knolle PA, Schmid-Burgk JL, Hornung V. 2012. NLRP3 inflammasome activity is negatively con-trolled by miR-223. J Immunol189: 4175–4181.
Bazzini AA, Lee MT, Giraldez AJ. 2012. Ribosome profiling shows that miR-430 reduces translation before causing mRNA decay in zebrafish. Science 336: 233–237.
Betel D, Koppal A, Agius P, Sander C, Leslie C. 2010. Comprehensive mod-eling of microRNA targets predicts functional conserved and non-canonical sites. Genome Biol11: R90.
Bosson AD, Zamudio JR, Sharp PA. 2014. Endogenous miRNA and target concentrations determine susceptibility to potential ceRNA competi-tion. Mol Cell56: 347–359.
Chen CZ, Li L, Lodish HF, Bartel DP. 2004. MicroRNAs modulate hemato-poietic lineage differentiation. Science303: 83–86.
Chen JF, Mandel EM, Thomson JM, Wu Q, Callis TE, Hammond SM, Conlon FL, Wang DZ. 2006. The role of 1 and microRNA-133 in skeletal muscle proliferation and differentiation. Nat Genet38: 228–233.
Chen YW, Song S, Weng R, Verma P, Kugler JM, Buescher M, Rouam S, Cohen SM. 2014. Systematic study of Drosophila microRNA functions using a collection of targeted knockout mutations. Dev Cell 31: 784–800.
Cheung VG, Conlin LK, Weber TM, Arcaro M, Jen KY, Morley M, Spielman RS. 2003. Natural variation in human gene expression assessed in lym-phoblastoid cells. Nat Genet33: 422–425.
Dang VT, Kassahn KS, Marcos AE, Ragan MA. 2008. Identification of human haploinsufficient genes and their genomic proximity to segmental du-plications. Eur J Hum Genet16: 1350–1357.
Denzler R, Agarwal V, Stefano J, Bartel DP, Stoffel M. 2014. Assessing the ceRNA hypothesis with quantitative measurements of miRNA and tar-get abundance. Mol Cell54: 766–776.
Denzler R, McGeary SE, Title AC, Agarwal V, Bartel DP, Stoffel M. 2016. Impact of microRNA levels, target-site complementarity, and coopera-tivity on competing endogenous RNA-regulated gene expression. Mol Cell64: 565–579.
Ebert MS, Sharp PA. 2010. Emerging roles for natural microRNA sponges. Curr Biol20: R858–R861.
Ecsedi M, Rausch M, Großhans H. 2015. The let-7 microRNA directs vulval development through a single target. Dev Cell32: 335–344.
Elia L, Quintavalle M, Zhang J, Contu R, Cossu L, Latronico MV, Peterson KL, Indolfi C, Catalucci D, Chen J, et al. 2009. The knockout of miR-143 and -145 alters smooth muscle cell maintenance and vascular ho-meostasis in mice: correlates with human disease. Cell Death Differ16: 1590–1598.
Farh KK, Grimson A, Jan C, Lewis BP, Johnston WK, Lim LP, Burge CB, Bartel DP. 2005. The widespread impact of mammalian microRNAs on mRNA repression and evolution. Science310: 1817–1821.
Flynt AS, Lai EC. 2008. Biological principles of microRNA-mediated regula-tion: shared themes amid diversity. Nat Rev Genet9: 831–842. Friedman RC, Burge CB. 2014. MicroRNA target finding by comparative
ge-nomics. Methods Mol Biol1097: 457–476.
Friedman RC, Farh KK, Burge CB, Bartel DP. 2009. Most mammalian mRNAs are conserved targets of microRNAs. Genome Res19: 92–105. Garcia DM, Baek D, Shin C, Bell GW, Grimson A, Bartel DP. 2011. Weak
seed-pairing stability and high target-site abundance decrease the profi-ciency of lsy-6 and other microRNAs. Nat Struct Mol Biol18: 1139–1146. Goljanek-Whysall K, Pais H, Rathjen T, Sweetman D, Dalmay T, Münsterberg A. 2012. Regulation of multiple target genes by miR-1 and miR-206 is pivotal for C2C12 myoblast differentiation. J Cell Sci 125: 3590–3600.
Guo H, Ingolia NT, Weissman JS, Bartel DP. 2010. Mammalian microRNAs predominantly act to decrease target mRNA levels. Nature 466: 835–840.
Haneklaus M, Gerlic M, Kurowska-Stolarska M, Rainey AA, Pich D, McInnes IB, Hammerschmidt W, O’Neill LA, Masters SL. 2012. Cutting edge: miR-223 and EBV miR-BART15 regulate the NLRP3 inflammasome and IL-1β production. J Immunol 189: 3795–3799.
Hata A, Lieberman J. 2015. Dysregulation of microRNA biogenesis and gene silencing in cancer. Sci Signal8: re3.
Hendrickson DG, Hogan DJ, McCullough HL, Myers JW, Herschlag D, Ferrell JE, Brown PO. 2009. Concordant regulation of translation and mRNA abundance for hundreds of targets of a human microRNA. PLoS Biol7: e1000238.
Huang N, Lee I, Marcotte EM, Hurles ME. 2010. Characterising and predict-ing haploinsufficiency in the human genome. PLoS Genet6: e1001154. Hutvágner G, Simard MJ, Mello CC, Zamore PD. 2004. Sequence-specific
in-hibition of small RNA function. PLoS Biol2: E98.
Iwakawa HO, Tomari Y. 2015. The functions of microRNAs: mRNA decay and translational repression. Trends Cell Biol25: 651–665.
Johnnidis JB, Harris MH, Wheeler RT, Stehling-Sun S, Lam MH, Kirak O, Brummelkamp TR, Fleming MD, Camargo FD. 2008. Regulation of pro-genitor cell proliferation and granulocyte function by microRNA-223. Nature451: 1125–1129.
Kim HK, Lee YS, Sivaprasad U, Malhotra A, Dutta A. 2006. Muscle-specific microRNA miR-206 promotes muscle differentiation. J Cell Biol174: 677–687.
Kleinstiver BP, Pattanayak V, Prew MS, Tsai SQ, Nguyen NT, Zheng Z, Joung JK. 2016. High-fidelity CRISPR-Cas9 nucleases with no detectable ge-nome-wide off-target effects. Nature529: 490–495.
Kozomara A, Griffiths-Jones S. 2014. miRBase: annotating high confidence microRNAs using deep sequencing data. Nucleic Acids Res42: D68–D73. Krek A, Grün D, Poy MN, Wolf R, Rosenberg L, Epstein EJ, MacMenamin P, da Piedade I, Gunsalus KC, Stoffel M, et al. 2005. Combinatorial microRNA target predictions. Nat Genet37: 495–500.
Lai EC. 2002. MicroRNAs are complementary to 3′UTR sequence motifs that mediate negative post-transcriptional regulation. Nat Genet30: 363–364.
Laurie-Ahlberg CC, Wilton AN, Curtsinger JW, Emigh TH. 1982. Naturally occurring enzyme activity variation in Drosophila melanogaster. I. Sources of variation for 23 enzymes. Genetics102: 191–206. Leung AK, Young AG, Bhutkar A, Zheng GX, Bosson AD, Nielsen CB, Sharp
PA. 2011. Genome-wide identification of Ago2 binding sites from mouse embryonic stem cells with and without mature microRNAs. Nat Struct Mol Biol18: 237–244.
Lewis BP, Shih IH, Jones-Rhoades MW, Bartel DP, Burge CB. 2003. Prediction of mammalian microRNA targets. Cell115: 787–798. Lewis BP, Burge CB, Bartel DP. 2005. Conserved seed pairing, often flanked
by adenosines, indicates that thousands of human genes are microRNA targets. Cell120: 15–20.
Li X, Carthew RW. 2005. A microRNA mediates EGF receptor signaling and promotes photoreceptor differentiation in the Drosophila eye. Cell123: 1267–1277.
Loeb GB, Khan AA, Canner D, Hiatt JB, Shendure J, Darnell RB, Leslie CS, Rudensky AY. 2012. Transcriptome-wide miR-155 binding map reveals widespread noncanonical microRNA targeting. Mol Cell48: 760–770. Paraskevopoulou MD, Georgakilas G, Kostoulas N, Vlachos IS, Vergoulis T,
Reczko M, Filippidis C, Dalamagas T, Hatzigeorgiou AG. 2013. DIANA-microT web server v5.0: service integration into miRNA functional anal-ysis workflows. Nucleic Acids Res41(Web Server issue): W169–W173. Park CY, Choi YS, McManus MT. 2010. Analysis of microRNA knockouts in
mice. Hum Mol Genet19(R2): R169–R175.
Poliseno L, Salmena L, Zhang J, Carver B, Haveman WJ, Pandolfi PP. 2010. A coding-independent function of gene and pseudogene mRNAs regu-lates tumour biology. Nature465: 1033–1038.
Rockman MV, Wray GA. 2002. Abundant raw material for cis-regulatory evolution in humans. Mol Biol Evol19: 1991–2004.
Rosenbloom KR, Armstrong J, Barber GP, Casper J, Clawson H, Diekhans M, Dreszer TR, Fujita PA, Guruvadoo L, Haeussler M, et al. 2015. The UCSC
Genome Browser database: 2015 update. Nucleic Acids Res 43: D670–D681.
Salmena L, Poliseno L, Tay Y, Kats L, Pandolfi PP. 2011. A ceRNA hypothesis: the Rosetta Stone of a hidden RNA language? Cell146: 353–358. Seitz H. 2009. Redefining microRNA targets. Curr Biol19: 870–873. Selbach M, Schwanhäusser B, Thierfelder N, Fang Z, Khanin R, Rajewsky N.
2008. Widespread changes in protein synthesis induced by microRNAs. Nature455: 58–63.
Shaw WR, Armisen J, Lehrbach NJ, Miska EA. 2010. The conserved miR-51 microRNA family is redundantly required for embryonic development and pharynx attachment in Caenorhabditis elegans. Genetics 185: 897–905.
Shenoy A, Blelloch RH. 2014. Regulation of microRNA function in somatic stem cell proliferation and differentiation. Nat Rev Mol Cell Biol15: 565–576.
Shkumatava A, Stark A, Sive H, Bartel DP. 2009. Coherent but overlapping expression of microRNAs and their targets during vertebrate develop-ment. Genes Dev23: 466–481.
Sokol NS, Xu P, Jan YN, Ambros V. 2008. Drosophila let-7 microRNA is re-quired for remodeling of the neuromusculature during metamorphosis. Genes Dev22: 1591–1596.
Stark A, Brennecke J, Bushati N, Russell RB, Cohen SM. 2005. Animal microRNAs confer robustness to gene expression and have a significant impact on 3′UTR evolution. Cell123: 1133–1146.
Subkhankulova T, Gilchrist MJ, Livesey FJ. 2008. Modelling and measuring single cell RNA expression levels find considerable transcriptional differ-ences among phenotypically identical cells. BMC Genomics9: 268.
Sun K, Westholm JO, Tsurudome K, Hagen JW, Lu Y, Kohwi M, Betel D, Gao FB, Haghighi AP, Doe CQ, et al. 2012. Neurophysiological defects and neuronal gene deregulation in Drosophila mir-124 mutants. PLoS Genet 8: e1002515.
Sweetman D, Goljanek K, Rathjen T, Oustanina S, Braun T, Dalmay T, Münsterberg A. 2008. Specific requirements of MRFs for the expression of muscle specific microRNAs, miR-1, miR-206 and miR-133. Dev Biol 321: 491–499.
Verma P, Cohen SM. 2015. miR-965 controls cell proliferation and migra-tion during tissue morphogenesis in the Drosophila abdomen. eLife4 doi: 10.7554/eLife.07389.
Vlachos IS, Paraskevopoulou MD, Karagkouni D, Georgakilas G, Vergoulis T, Kanellos I, Anastasopoulos IL, Maniou S, Karathanou K, Kalfakakou D, et al. 2015. DIANA-TarBase v7.0: indexing more than half a million ex-perimentally supported miRNA:mRNA interactions. Nucleic Acids Res43 (Database issue): 153–159.
Wee LM, Flores-Jasso CF, Salomon WE, Zamore PD. 2012. Argonaute divides its RNA guide into domains with distinct functions and RNA-binding properties. Cell151: 1055–1067.
Xie J, Ameres SL, Friedline R, Hung JH, Zhang Y, Xie Q, Zhong L, Su Q, He R, Li M, et al. 2012. Long-term, efficient inhibition of microRNA function in mice using rAAV vectors. Nat Methods9: 403–409.