Development of Thermal Displays for Haptic Interfaces
by
Anshul Singhal
B.Tech. in Production and Industrial Engineering
Indian Institute of Technology Delhi, 2012
Submitted to the Department of Mechanical Engineering
in partial fulfillment of the requirements for the degree of
Master of Science in Mechanical Engineering
at the
MASSACHUSETTS INSTITUTE OF TECHNOLOGY
June 2016
© Massachusetts Institute of Technology 2016. All rights reserved.
Author . . .
Department of Mechanical Engineering
May 06, 2016
Certified by . . .
Lynette A. Jones
Senior Research Scientist in Mechanical Engineering
Thesis Supervisor
Accepted by . . .
Rohan Abeyaratne
Chairman, Department Committee on Graduate Students
3
Development of Thermal Displays for Haptic Interfaces
by
Anshul Singhal
Submitted to the Department of Mechanical Engineering
on May 06, 2016 in partial fulfillment of the requirements for the degree of Master of Science in Mechanical Engineering
Abstract
This thesis studied the effect of different stimulus parameters on the thermal response of the skin. A set of thermal patterns, known as thermal icons, was presented to participants using a thermal display mounted on the hand. The thermal responses of the skin were studied to understand which features of the thermal stimuli were important and could be perceived by users. The effectiveness of these patterns was evaluated for applications involving hand-held and wearable thermal devices. In the first series of experiments, a set of six thermal icons was developed and presented on the thenar eminence and the fingertips. The second experiment was conducted on the wrist with a revised set of thermal icons which had a shorter duration and were presented relative to each participant’s baseline skin temperature. The information transfer (IT) values for the thermal icons presented on the wrist-mounted thermal display demonstrated that the information processing capabilities of the thermal sensory system may rival those achieved with vibrotactile inputs. To date, thermal icon studies have only used the temporal properties of stimuli and not the spatial properties. A set of two experiments was conducted to examine how the spatial and temporal properties of thermal stimuli interact. The results showed that the temporal properties of thermal stimulation can influence the perceived location of a thermal stimulus.This space-time dependency for the thermal sensory system provides an extra dimension to use to present information in a thermal display and potentially could result in a display that functionally has a higher spatial resolution than the number of thermal elements would indicate.
Thesis Supervisor: Lynette A. Jones
5
Acknowledgments
I would like to sincerely thank my advisor Dr. Lynette Jones for giving me this opportunity, and guiding me throughout these last two years. She always provided me with direction for the project while simultaneously encouraging me to develop my own ideas. I have learnt a lot from her and she has given me an immense opportunity to improve as a researcher. She has spent countless hours correcting many drafts of our papers and this thesis, for which I am extremely grateful.
I would like to thank Prof. Ian Hunter for providing the wonderful research environment with numerous resources, and giving useful suggestions to my work. I would like to thank Dr. Cathy Hogan and Ms. Kate Melvin for making the lab a cooperative place. Thanks for all the support and for being there to help and guide me.
I would like to thank members of the BioInstrumentation lab who make working in the lab fun, friendly and intellectually stimulating. Thanks to John Liu and Ashin Modak for their support and for helping me adapt when I was new to the lab. Thanks to Seyed Mirvakili, Geehoon Park, Nick Demas, Ashley Raynal, Craig Cheney, Randall Briggs, Mike Zervas and Aoyu Zhang for all their help, ideas and discussions. Thanks for taking valuable time and participating in my user studies multiple times.
A special thanks to all my good friends - Ankur, Pranay, Puneet, Achin and Raman, for all the fun times, support, encouragement and for always being there whenever I needed them. Thanks to my current roommates for being supportive and maintaining a joyful environment at our apartment.
I would like to extend my thanks to all the teachers and mentors whom I have had the luck of having in my life. I have learnt a lot from them and without their knowledge and encouragement, reaching this point in life would not have been possible.
Lastly and most importantly, I express my very profound gratitude to my family – my parents and sister, for providing me with unfailing support and continuous encouragement throughout my years of study and through all the ups and downs in life. This accomplishment would not have been possible without their efforts.
6
This research was supported by the US National Science Foundation (NSF) under grant IIS-1318215.
7
Table of Contents
Abstract 3 Acknowledgements 5 Table of Contents 7 List of Figures 9 List of Tables 13 1. Introduction 151.1. Haptic Sensory System
. . .
151.2. Thermal Sensory System
. . .
171.3. Development of Thermal Displays
. . .
201.4. Objectives of Research
. . .
222. Thermal Pattern Identification on the Hand 25 2.1. Motivation
. . .
252.2. Thermal Icons on Thenar Eminence
. . .
282.2.1. Experimental Design
. . .
282.2.2. Results
. . . .
342.3. Thermal Icons on Fingertips
. . .
382.3.1. Experimental Design
. . .
382.3.2. Results
. . . .
402.4. Discussion
. . .
438
3. Thermal Pattern Identification with Revised Thermal Icons 49
3.1. Motivation and Concept
. . .
493.2. Experimental Design
. . . .
513.3. Results
. . . .
583.4. Discussion
. . . .
603.5. Conclusion
. . . .
624. Effect of Space-time Interactions on Thermal Perception 65 4.1. Introduction
. . . .
654.2. Experiment 1: Perceived Location of Cold Stimuli
. . .
714.2.1. Experimental Design
. . . .
714.2.2. Results
. . .
764.3. Experiment 2: Perceived Location of Warm Stimuli
. . .
814.3.1. Experimental Design
. . . .
814.3.2. Results
. . . .
834.4. Discussion
. . .
894.5. Conclusion
. . . .
915. Conclusions and Future Work 93 5.1. Summary and Conclusions
. . .
935.2. Contributions . . .
. . . .
955.3. Future Work
. . . .
969
List of Figures
1.1 Haptic Sensory System . . . 16 1.2 Three main layers of the skin: outermost layer or epidermis, middle layer or dermis
and the innermost layer, the hypodermis. Figure adapted from [6] . . . 18 1.3 (a) Thermal Interaction due to the heat transfer between the skin and the object. (b)
Heat flux at the contact interface of the skin and the object gives an interface temperature. Figure adapted from [5] . . . 19 1.4 Generation of thermal feedback by the thermoreceptors and transmission by the
brain and the spinal cord in the CNS. . . 19 1.5 Example of object recognition using perception of thermal properties by the hand
[5]. (a) Thermal interaction of the hand with different materials of the same shape and size. (b) Relative change in skin temperature due to the thermal interaction [5]. 21 1.6 Main components of a thermal display . . . 21 2.1 Concept of the thermal display with the thermoelectric module mounted on a heat
sink and the thenar eminence placed over the thermoelectric module. Thermistors 1 and 2 measure the temperature of the display and the skin respectively . . . 27 2.2 Schematic illustration of the thermal display with the Peltier module mounted on a
heat sink, and thermistors measuring the temperature of the module and of the skin at the base of the thumb . . . 29 2.3 Thermal display with thermoelectric module mounted on a heat sink and fan (left)
and with the thenar eminence over the thermoelectric module during stimulus presentation (right) . . . 30 2.4 Visual depiction of the stimulus dimensions which were used to create a set of six
10
2.5 Visual depiction of the six thermal patterns that varied with respect to the intensity and rate of change in temperature. The dashed line indicates the baseline skin temperature. In the template that participants viewed there were no numeric values on the axes . . . 32 2.6 Pilot studies data illustrating the response of the skin to different thermal stimuli . . 33 2.7 (a) Placement of thermistor on the skin for recording the skin temperature. In (b)
baking soda was used to mark the contact area of the skin on thenar eminence with the thermal display . . . 34 2.8 Temperatures measured on the skin and the display averaged across trials and
subjects for each of the six thermal stimuli. The first 20 s of data prior to each stimulus presentation are also shown . . . 36 2.9 Group mean percent of correct responses for each thermal pattern. The standard
deviations are shown . . . 37 2.10 Thermal display with thermoelectric module mounted on a heat sink and fan (left)
and with the fingertips over the thermoelectric module during stimulus presentation (right) . . . 40 2.11 Baking soda was used to mark the contact area of the skin on the fingertips with the
thermal display . . . 41 2.12 Temperatures measured on the skin and the display averaged across trials and
subjects for each of the six thermal stimuli. The first 20 s of data prior to each stimulus presentation are also shown . . . 42 2.12 Group mean percent correct responses for each thermal pattern. The standard
deviations are shown . . . 43 3.1 Concept of the thermal display mounted on a user’s wrist with a strap . . . 50 3.2 Schematic illustration of the thermal display with Peltier module mounted on a
water cooled heat sink, and thermistors measuring the temperature of the module and of the skin on the wrist . . . 52 3.3 (a) Cross-sectional view of the setup showing the thermal display mounted on the
wrist using a strap. A water cooled heat sink mounted on the thermoelectric module is also shown. (b) Magnified view of the position of three thermistors as indicated 53
11
by numbers 1, 2 and 3. Thermistor 1 has an insulation layer on one side to avoid thermal contact with the skin. Thermistor 2 measures the skin temperature at the periphery of the contact area of the skin and the display. Thermistor 3 measures the baseline skin temperature which is unaffected by the display temperature . . . 3.4 Fabrication of fixture in Viper Laser Stereolithography Forming Center . . . 53 3.5 (a) Water block mounted over the fixture and the assembly fastened onto the wrist
of the user. (b) The inner side of the display showing the Peltier module surface and thermistors 1 (under the insulation layer), 2 and 3. (c) Assembly of water cooling system showing the water tank and submersible pump. (d) The fully functional setup worn by the user on the wrist of the left hand . . . 54 3.6 Screen shot of the GUI developed in LabVIEW used to send commands to the
controller and record the temperatures from the thermistors . . . 55 3.7 Stimulus dimensions used to create the thermal icons – direction (warming or
cooling), intensity (magnitude of temperature change) and rate of temperature change . . . 56 3.8 Screen shot of the GUI presented on the computer screen in front of the
participants, and used by them to record their responses. It shows the placement of the thermal display on the wrist and visual depiction of the six thermal patterns . . . 57 3.9 Temperatures measured on the Peltier module and two locations on the wrist with
three thermistors throughout the trial, averaged across trials and subjects for each of the six thermal stimuli . . . 59 3.10 Group mean percent of correct responses for each thermal pattern. The standard
deviations are shown . . . 61 4.1 (a) Concept for presenting thermal stimuli at three different points on the forearm.
(b) The forearm placed on the thermal display which is made up of three Peltier modules mounted on a heat sink is shown . . . 70 4.2 (a) Schematic illustration of the thermal display with three Peltier modules mounted
on heat sink, and thermistors measuring the temperature of the modules and of the skin on the forearm (b) The numbering of the Peltier modules with respect to the forearm, and the position of thermistors measuring skin temperature . . . 72
12
4.3 Different parameters of the four temperature pulses used to create the patterns for cold stimuli . . . 73 4.4 (a) Thermal display assembly with three Peltier modules, heatsink and fans (b) The
placement of the forearm on the thermal display by the user . . . 75 4.5 Screen shot of the GUI presented on the computer screen in front of the
participants, and used by them to record their responses . . . 76 4.6 Temperature recordings throughout two trials from the three Peltier devices and
from the skin on the forearm not in contact with the Peltier devices . . . 77 4.7 Position measurement with respect to the wrist of the participant . . . 77 4.8 The group mean perceived position of the first pulse in each pattern. Standard
deviations are shown . . . 79 4.9 The group mean perceived position of the second pulse in each pattern. Standard
deviations are shown . . . 79 4.10 Schematic illustration of the group mean data for the physical stimuli depicted
graphically and the perceived position of those stimuli on the forearm . . . 80 4.11 Different parameters of the four temperature pulses used to create the patterns for
warm stimuli . . . 82 4.12 Temperature recordings throughout two trials from the three Peltier devices and
from the skin on the forearm not in contact with the Peltier devices. The data are averaged across five participants across all trials . . . 84 4.13 The group mean perceived position of the first and second pulse in each pattern,
when the direction of the thermal display’s activation was distal (P1-P2-P3) or proximal (P3-P2-P1). Standard deviations are shown . . . 87 4.14 Schematic illustration of the group mean data for the physical stimuli depicted
graphically and the perceived position of those stimuli on the forearm . . . 88 4.15 The group mean absolute difference in perceived location of the first and second
pulse for cold and warm stimuli at (a) a delay of 0.2 or 4 s and (b) when the direction of the thermal display’s activation was distal (P1-P2-P3) or proximal (P3-P2-P1). Standard deviations are shown . . . 89
13
List of Tables
2.1 Confusion matrix of the group responses with scores out of the total of the 80 trials presented for each stimulus on the thenar eminence. The highlighted diagonal represents correct responses . . . 37 2.2 Confusion matrix of the group responses with scores out of the total of the 64 trials
presented for each stimulus on the fingertips. The highlighted diagonal represents correct responses . . . 43 3.1 Confusion matrix of the group responses with scores out of the total of the 80 trials
presented for each stimulus on the wrist. The highlighted diagonal represents correct responses . . . 60 4.1 Thermal patterns for cold stimuli created based on varying the Peltier modules (P)
activated, the direction of activation and the delay (in seconds) between pulse B and C . . . 74 4.2 Thermal patterns for warm stimuli created based on varying the Peltier modules (P)
activated, the direction of activation and the delay (in seconds) between pulse B and C . . . 83
15
Chapter 1
Introduction
The focus of the research presented in this thesis is to understand how different thermal stimulus parameters affect the response of the skin to thermal stimulation and whether these changes in skin temperature are perceived. Pre-defined sets of thermal patterns, known as thermal icons, when presented to the skin can be used to convey information. The basis for designing these thermal icons has not been well delineated. The thermal response of the skin to stimulation has to be studied in order to understand which features of thermal stimuli can potentially be encoded by thermoreceptors and perceived by the user. The effectiveness of these patterns has to be evaluated for the proposed applications in thermal displays that are part of hand-held or wearable devices. To date, studies of thermal icons have used only the temporal properties of thermal stimuli and not the spatial properties. The spatio-temporal interactions, which have been reported for other sensory modalities have to be studied for the thermal sensory system within the innocuous range of temperatures. If space-time interactions occur for the thermal sensory system, then the scope of parameters that can be used to create effective thermal patterns in thermal displays will be enhanced.
1.1. Haptic Interfaces
The haptic sensory system is based on inputs that arise from sensory and motor activity that involves sensors in the skin, muscle and joints. As illustrated in Figure 1.1, the haptics sense is a bi-communication channel, unlike the visual sense, which means that it can both sense and act on stimuli. The tactile or cutaneous senses are responsible for the ‘sense of touch’ and inputs
16
to these arise through direct contact with the skin surface [1]. The tactile sense can detect four basic features of stimulation: mechanical, thermal, chemical and electrical. Kinesthetic or proprioceptive perception refers to sensations of position, velocity and forces that arise from receptors in muscles and tendons. Together, the tactile and kinesthetic senses play an important role in our interaction with the environment. The haptic sense gives us information essential to our daily lives, be it when pressing a button or holding a ball.
Figure 1.1 Haptic Sensory System
A device or interface that can provide haptic sensations, i.e. it is able to communicate with a user by providing tactile or/and kinesthetic perceptions, is known as a haptic interface. Haptic interfaces can provide useful feedback for perceiving physical surroundings. These interfaces have a wide range of applications, including in virtual environments and in teleoperation of robotic systems. Depending on the application, haptic interfaces can present tactile or force feedback to the user or take the user’s response to generate appropriate feedback.
Tactile displays convey detailed information about the interaction at a localized point of contact.One application of tactile displays is in sensory substitution, such as providing spatial information in the absence of visual cues. Refreshable Braille displays for people who are blind is an example of a tactile sensory substitution device [2]. Tactile displays can also be used to convey
17
the shape, texture or contour of an object. This is achieved by deforming the skin or modulating the force distribution.
Force displays provide information about the forces involved during a virtual or a physical interaction. Force displays are usually developed as a desktop device or in the form of an exoskeleton, capable of generating kinesthetic feedback. The input to force displays can come from a virtual environment or in the form of closed loop feedback control by sensing limb position and movement [3].
A complete immersive picture of an interaction, either in a physical world or in a virtual environment, can be created using a combination of these displays. Such haptic displays which provide tactile, force, position and thermal feedback, are known as multi-modal haptic interfaces. The size, cost and effectiveness of any haptic display is largely dependent on its form factor which is governed by the actuators and sensors employed in it.
1.2. Thermal Sensory System
The thermal sensory system encodes information about the thermal interaction at the interface of the skin and an object. The skin is the largest organ in the body and has three main layers, as illustrated in Figure 1.2. The cutaneous sensory receptors are located in the two outermost layers. The outermost layer or the epidermis has a thickness of 65 to 115 µm. The second layer or dermis is approximately 0.3 to 3 mm thick, and contains nerve endings which respond to touch and pressure, temperature changes, and painful stimuli [4]. The third layer or hypodermis is located below the dermis layer and contains blood vessels and nerve fibers. It also attaches the skin tissues to the underlying bones and muscles.
18
Figure 1.2 Three main layers of the skin: outermost layer or epidermis, middle layer or dermis and the innermost layer, the hypodermis. Figure adapted from [6].
The skin has numerous sensory receptors which are responsible for responding to particular types of stimuli. Mechanoreceptors sense mechanical stimulation, thermoreceptors sense increases or decreases in temperature and nociceptors sense pain. Across the body, the density of receptors varies and thus the sensitivity of the skin to stimulation also differs. The relative densities of these receptors varies at different locations, for example, the fingertips are highly sensitive to mechanical stimulation but they have lower thermal sensitivity as compared to other locations on the body such as the forearm [9].
A typical thermal interaction of the skin with an object is shown in Figure 1.3 (a). When the skin interacts with an object under normal conditions there is heat transfer due to differences in the temperatures of the skin and the object [5]. Due to heat flux at the contact interface of the skin and the object, the interface temperature changes as shown in Figure 1.3 (b). The thermoreceptors present in the epidermal and the dermal layers sense this change in the skin temperature and respond by varying their discharge rates. The encoded information of the thermal interaction is sent to the higher centers of the central nervous system (CNS), where the thermal sensation is perceived. The generation and transmission of thermal feedback is depicted in Figure 1.4.
19
(a) (b)
Figure 1.3 (a) Thermal Interaction due to the heat transfer between the skin and the object. (b) Heat flux at the contact interface of the skin and the object gives an interface temperature. Figure adapted from [5].
Figure 1.4 Generation of thermal feedback by the thermoreceptors and transmission by the brain and the spinal cord in the CNS.
The cold and warm thermoreceptors in the skin that signal changes in skin temperature vary with respect to the range of temperatures that they respond to, their innervation density across the body and the conduction velocity associated with transmitting information in the CNS.
20
Cold thermoreceptors signal decreases in skin temperature from 43 to 5 °C and respond most vigorously around 25 °C, whereas warm thermoreceptors discharge with increasing skin temperature reaching a maximum at temperatures around 45 °C [7]. As the temperature of the skin falls below 15 °C or rises above 45 °C there is an abrupt change in sensation to one of pain [8].
The sensitivity of skin to thermal stimulation is variable. Across the body there is a 100-fold variation in thermal thresholds with the face being the most sensitive region and the feet being relatively insensitive [9]. For the upper extremity, cold and warm thresholds are lower (better sensitivity) on the thenar eminence at the base of the thumb as compared to the forearm and fingertips [9]. Thermal sensitivity maps are therefore quite different from homologous maps of spatial tactile acuity in which the exquisite sensitivity of the fingertips is predominant. In addition, all body regions are more sensitive to cold than to warm stimuli [9, 10], and although the rate of temperature change influences thermal thresholds, at rates above 0.1 °C/s it has little effect on the ability to detect thermal stimuli [11]. The difference in the conduction velocity of cold (10-20 m/s) and warm (1-2 m/s) afferent fibers does however affect reaction time. Cold stimuli are responded to more rapidly than warm stimuli [12]. These fundamental properties of the thermal sensory system provide a framework for defining the optimal characteristics of stimuli presented in a thermal display.
An understanding of how changes in skin temperature are encoded in the periphery and transmitted in the CNS is essential to the development of effective thermal displays. The sensitivity properties of the thermoreceptors demarcate the range of temperatures that should be presented in thermal displays to those between 18 and 40 °C so as not to elicit painful responses.
1.3. Development of Thermal Displays
Much of the research on thermal displays has focused on their use to simulate the thermal properties of objects encountered in the environment so as to facilitate identification and discrimination [13]. These displays attempt to reproduce the thermal sensations associated with
21
making contact with a real object which vary as a function of the thermal properties of the object, such as its conductivity and heat capacity. An example is shown in Figure 1.5, where two different materials with the same shape and size can be identified from their different thermal properties. The objective of a thermal display is to assist in object recognition in situations in which visual information may be limited or absent, and to create a more realistic experience of the contact between the hand and the object in a virtual environment [14]. The three main components of a typical thermal display are shown in Figure 1.6.
(a) (b)
Figure 1.5 Example of object recognition using perception of thermal properties by the hand [5]. (a) Thermal interaction of the hand with different materials of the same shape and size. (b) Relative change in skin temperature due to the thermal interaction [5].
22
These displays typically consist of thermal stimulators such as Peltier devices, thermal sensors, and a temperature control system that monitors and controls the surface temperature of the thermal display [13, 15, 16]. For applications of thermal interfaces in object simulation and identification, it has been shown that model-based displays are able to simulate thermal cues effectively such that participants can use these cues to identify and discriminate between materials with an accuracy that is similar to that attained with real materials [15, 17-20]. The particular model selected to characterize the hand-object thermal interaction depends on the objects and the contact conditions in the virtual environment. When the simulated objects are not distinct in terms of their thermal properties and precise identification is required the thermal model needs to be more complex and incorporate factors such as thermal contact resistance and object geometry. However, the simple “two semi-infinite bodies in contact” model works well when the simulated objects span a wide range of thermal properties and only identification or discrimination is required [13].
In addition to their use to simulate thermal properties of materials, thermal interfaces can be used to enhance user interactions with objects presented on digital media [21] or to present scalar information that is mapped onto temperature [22]. For example, the proximity of an object to a user could be encoded as an increase in temperature, or the increasing pressure during an undersea dive could be represented by decreases in temperature. Very few studies have examined the feasibility of using thermal cues to encode such abstract information and most of the devices that have been built to explore this possibility have not undergone rigorous human-use studies [e.g. 22, 23].
1.4. Thesis scope and Objectives
The objectives of the research conducted for this thesis were to study the effect of different thermal stimulus parameters on the thermal responses of the skin and the human user. Thermal stimuli, when presented in a set of defined patterns to the skin, can be used to convey information. Such thermal patterns are known as thermal icons, similar to tactons in the tactile modality. The basis for designing thermal icons has not been well delineated, and so the thermal
23
responses of the skin to stimulation were measured to understand which features of a thermal stimulus can potentially be encoded by thermoreceptors and perceived by the user. Different locations on the body which varied with respect to the thermal sensitivity were used to present the thermal stimuli. Participants were required to identify the patterns presented. The thermal icons that were studied took advantage of only the temporal properties of thermal stimulation and not its spatial properties. By varying the spatio-temporal parameters of the thermal stimulation, it is possible that additional information may be conveyed. Spatio-temporal interactions have been reported for other sensory modalities, but not for the thermal sensory system within the innocuous range of temperatures. A set of experiments was therefore conducted to observe the effect of varying the temporal and spatial properties of thermal stimulation on the skin with cold and warm stimuli. Space-time interactions were found for the thermal sensory system which widens the scope of parameters that can be used to create effective thermal patterns.
This thesis is organized into the following chapters which describe the motivation, experimental design and results of the different studies. Chapter 2 details the development of a set of thermal icons which are based on the thermal sensory system’s characteristics. Absolute identification experiments were conducted for the thermal patterns presented at two locations on the hand to evaluate the effectiveness of the thermal icons in conveying information. For these studies, a grounded thermal display using a Peltier module was developed.
Chapter 3 describes an absolute identification experiment with a revised set of thermal icons which have shorter durations and are presented relative to the participant’s baseline skin temperature. In this study, the experiment was conducted using a wearable thermal display on the wrist. For the experiments presented in both Chapters 2 and 3, the effectiveness of the icons was evaluated both in terms of the percent correct responses and by calculating the Information Transfer (IT).
Chapter 4 describes the experiments which evaluated the spatio-temporal effects of thermal stimulation on the forearm. For these studies, a thermal display consisting of three Peltier modules capable of presenting short duration cold and warm thermal pulses on the
24
forearm was developed. Two experiments were conducted to determine whether the perceived location of the thermal stimuli changed as a function of the temporal parameters of the stimulation, and to find out whether there were differences in thermal space-time interactions for cold and warm stimuli.
25
Chapter 2
Thermal Pattern Identification on Hand
2.1 Motivation
The thermal sensory modality provides a novel dimension to present essential information to the users of a variety of hand- held devices provided the inputs are tailored to the properties of the sensory system. Much of the research on thermal displays has focused on their use to simulate the thermal properties of objects encountered in the environment so as to facilitate identification and discrimination [13]. Very few studies have examined the feasibility of using thermal cues to encode abstract information. One of the limitations in using thermal cues in this way is the relatively small number of sensations evoked by changes in skin temperature. Thermal stimulation results in perceptible warming or cooling and this is quantified in terms of the intensity and duration of the thermal stimulus. If changes in the magnitude of a variable are mapped onto variations in temperature, then the direction and rate of change are probably the most salient features to use.
Thermal displays can also be used to create thermal icons by analogy to tactile icons or tactons in the tactile domain or earcons in audition [24, 25]. Icons can be created using the four basic dimensions of stimuli namely quality, extension, intensity and duration. Quality refers to the various sensations evoked by different forms of stimulation, such as the warmth and cold induced by increasing and decreasing skin temperature, or the pain evoked at extreme temperatures. The attribute of extension characterizes the spatial aspects of a stimulus such as the location on the body stimulated and the size and separation between points of stimulation
26
[26]. There have been a few studies of thermal icons created by varying the direction, amplitude and rate at which the temperature of a thermal display changes [26-29]. In these studies, stimuli were created by varying the amplitude of each stimulus (±1, ±3 or ± 6 °C) and the rate of temperature change (1 °C/s or 3 °C/s). No measurements were made of the change in skin temperature in response to these thermal inputs although the thermal display was set at 32 °C so as to maintain skin temperature relatively constant between trials. The results from these experiments showed that the direction of change in temperature (i.e. warming or cooling) was the most salient feature of a thermal icon, that cooling was easier to detect than warming, and that the rates at which the thermal stimuli were presented affected the time to detect stimuli [28]. The reaction time to cold and warm stimuli are also different with cold stimuli being responded to more rapidly than warm stimuli [12]. Overall identification of small sets of thermal icons designed to convey information about the source and importance of a hypothetical text message has varied from 64% correct for four icons that differed with respect to quality and intensity [29], to 83% correct for a similar set of four icons [30]. The skin’s thermal sensitivity varies as a function of location on the body. For the upper extremity, cold and warm thresholds are lower (better sensitivity) on the thenar eminence at the base of the thumb as compared to the forearm and fingertips [9].
The development of thermal icons for use in interacting with digital media should be based on our knowledge of human thermal sensory processing and on understanding the sources of errors that occur when identifying icons. Development of a set of thermal icons which are based on the thermal sensory system’s characteristics is presented in this chapter. A set of experiments using these thermal icons was conducted with a thermal display. The development of the thermal display along with the experimental design and results are described. The experiments were designed to evaluate the effectiveness of the set of thermal icons in providing information. As a measure of the effectiveness of the icons, Information Transfer (IT) was calculated for the thermal icon set presented on the thenar eminence and the fingertips. These locations vary with respect to their thermal sensitivity and are candidates in a number of the proposed applications of thermal icons involving hand-held devices.
27
The objectives of the present experiments were (1) to determine which dimensions of thermal icons could be accurately identified and (2) to estimate the information transfer (IT) associated with these icons. IT values have often been measured for tactile icons and as they are dimensionless and independent of task conditions they can be directly compared across experiments and modalities [25]. The basis for designing thermal icons has not been well delineated, and so the thermal responses of the skin to stimulation were measured in the present experiment so as to understand which features of a thermal stimulus can potentially be encoded by thermoreceptors and perceived by the user. Preliminary experiments were conducted to evaluate how skin temperature changed in response to different types of thermal stimulation. These pilot studies were particularly focused on determining how rapidly skin temperature changed with the different thermal inputs and whether features of the thermal stimulus that may be used to create icons (e.g. a sinusoidal or square waveforms) were captured in the responses of the skin.
Figure 2.1 Concept of the thermal display with the thermoelectric module mounted on a heat sink and the thenar eminence placed over the thermoelectric module. Thermistors 1 and 2 measure the temperature of the display and the skin respectively.
28
2.2 Thermal Icons on Thenar Eminence
In the first experiment, the thenar eminence at base of the thumb was selected as the site to present stimuli as it is the most thermally sensitive region on the glabrous surface of the hand [9]. In addition to this, the base of the thumb was chosen as the site of stimulation as a number of the proposed applications of thermal icons involve the hand holding a device such as a mobile phone or computer mouse [e.g. 31, 32]. The concept of the thermal display on the thenar eminence is shown in Figure 2.1.
2.2.1 Experimental Design
The experiment was an absolute identification study in which participants had to identify which of six thermal stimuli that varied with respect to intensity and the rate and direction of change in temperature had been presented.
Participants
Ten normal healthy individuals, 8 males and 2 females, ranging in age from 20 to 28 years old (mean: 25 years) participated in the experiments. They were all right-handed. They had no known abnormalities of the skin or peripheral sensory or vascular systems. None of the participants had any significant experience in thermal stimuli pattern recognition. They all signed an informed consent form that was approved by the MIT Committee on the Use of Humans as Experimental Subjects.
Apparatus
A thermal display was developed using a thermoelectric module (Model TE-127-1.0-2.5, TE Technology, Inc.) mounted on a heat sink and fan. The thermoelectric module was a Peltier device, 30-mm in length and width, with a thickness of 4.8 mm as shown in Figure 2.3. The module’s temperature was controlled using a portable controller unit (Model TC-720, TE Technology, Inc.) run by a dual-mode power supply. Two thermistors, 457 μm in diameter and
29
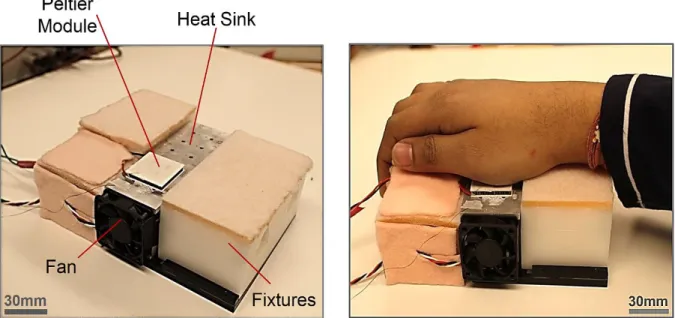
3.18 mm in length (Model 56A1002-C8, Alpha Technics), were used in the experiment. One thermistor was mounted on the surface of the thermal display for feedback control of the device’s temperature. The second thermistor measured the temperature of the skin in contact with the display. Two fixtures were fabricated using 3-D printing, one of which held the assembly of the thermoelectric module, heat sink and fan, and the other provided support for the subject’s wrist and hand (see Figure 2.3). The input to the feedback control was the temperature of the display rather than skin temperature so that the same stimulus was delivered to all participants and the temperature of the skin was essentially the same at the start of each trial.
A LabVIEW-based (National Instruments) graphical user interface (GUI) was used to send commands to the controller for the thermal display and to record skin temperature continuously at 20 Hz. A second computer was used to run a GUI in LabVIEW on which the participants’ responses were recorded.
Figure 2.2 Schematic illustration of the thermal display with the Peltier module mounted on a heat sink, and thermistors measuring the temperature of the module and of the skin at the base of the thumb
30
Figure 2.3 Thermal display with thermoelectric module mounted on a heat sink and fan (left) and with the thenar eminence over the thermoelectric module during stimulus presentation (right)
Thermal Stimuli
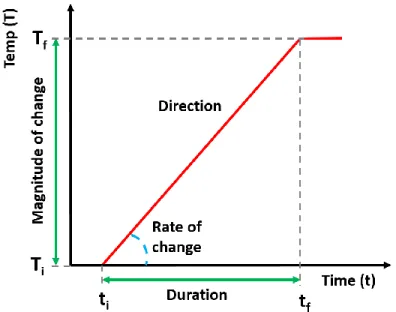
The thermal stimulus patterns were designed by varying two stimulus dimensions, the amplitude and rate of change in temperature. In terms of the stimulus dimensions described in the Introduction, the quality (i.e. warming or cooling the skin), intensity and duration (rate of change) were used to create these thermal icons (see Figure 2.4). Three basic thermal profiles (square wave, step and ramp) were used, each of which had two values to give a total of six patterns.
The duration of all six patterns was 30 seconds. Figure 2.5 provides a schematic illustration of the patterns that participants used to indicate their responses. The waveforms depicted were not intended to be precise in terms of the actual rate and intensity of the stimuli delivered but served to emphasize the differences among the patterns. The time and temperature axes did not have numeric values on them when viewed by participants. They were informed that the dotted red line represented the baseline skin temperature of 32 °C. Patterns A and F were based on a square wave input, B and D were linearly decreasing and increasing ramps, respectively, and C and E were based on a step input. The average rate of change of temperature
31
was 3 °C/s for A and F, 0.7 °C/s for B and D, and 2 °C/s for C and E. The direction and intensity of the changes in temperature differed in the above pairs to make them more distinguishable. The temperature ranged between 24 and 38 °C for A and C, and 18 and 32 °C for E and F. The direction of the 18 °C change in temperature for B and D was reversed. The rate of temperature change and intensity values were chosen based on pilot studies which revealed the time course of changes in skin temperature in response to various thermal inputs (See Figure 2.6).
Figure 2.4 Visual depiction of the stimulus dimensions which were used to create a set of six thermal stimuli.
32
Figure 2.5 Visual depiction of the six thermal patterns that varied with respect to the intensity and rate of change in temperature. The dashed line indicates the baseline skin temperature. In the template that participants viewed there were no numeric values on the axes.
33
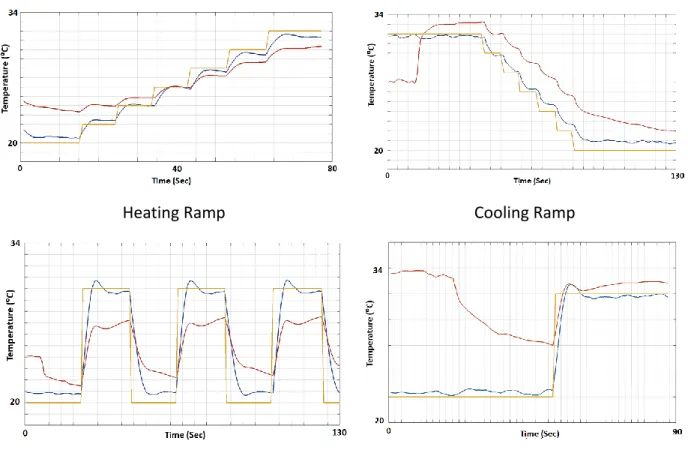
Heating Ramp Cooling Ramp
Square Waveform with ∆T=10 ⁰C Heating Step
Figure 2.6 Pilot studies’ data illustrating the response of the skin to different thermal stimuli
Procedure
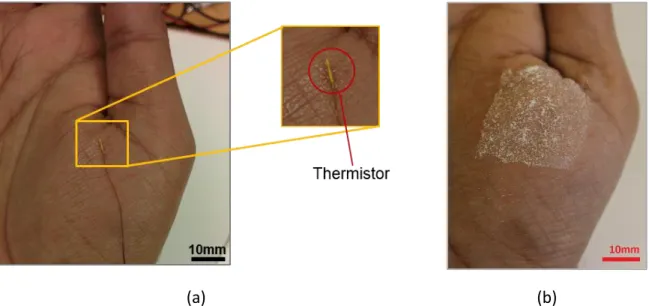
Participants washed their hands prior to starting the experiment. A thermistor was then glued to the thenar eminence (at the base of the thumb) on the right hand using biocompatible cyanoacrylate (Liquid BandageTM, Johnson & Johnson) (see Figure 2.7). The thermistor was
chosen on the basis of its small dimensions and low thermal mass. Initial skin temperatures of the participants ranged from 30 to 34 °C with a mean of 32 °C. The ambient temperature in the room was maintained at 24 °C, as measured with a thermocouple in free air. Participants placed their wrist and hand on the supporting fixture, and brought their thenar eminence in contact with the thermoelectric module’s surface as illustrated in Figure 2.3 (a). The contact area between the hand and the Peltier device ranged from 600-750 mm2 across participants (see Figure 2.7).
34
A visual depiction of the stimuli was presented on the computer screen in front of the participant (see Figure 2.5). In the familiarization period participants selected each stimulus in turn using a computer mouse and the stimulus was then presented on the hand while they looked at the visual display. After this, there was a series of practice trials in which stimuli were presented and participants had to indicate which pattern they felt. Feedback was provided after each response. After the practice session which typically lasted 5 minutes, the experiment began. To ensure that the skin temperature of the hand returned to a baseline temperature before each stimulus was presented, the thermal display was maintained at 30 °C for 20 seconds between trials.
(a) (b)
Figure 2.7 (a) Placement of thermistor on the skin for recording the skin temperature. In (b) baking soda was used to mark the contact area of the skin on thenar eminence with the thermal display
Each stimulus lasted 30 seconds and was presented eight times in a randomized order to give a total of 48 trials. Two different auditory cues were provided to signal the start and finish of each stimulus presentation. After the second auditory cue, participants indicated their responses by selecting the letter (A-F) associated with the visual pattern on the GUI on the screen. Responses had to be made within 10 seconds and on most trials participants made their responses within a couple of seconds. A rest break was provided when requested. No feedback regarding the correctness of the responses was provided during the main experiment.
35
2.2.2 Results
The group mean temperature measured on the hand and the thermal display during the experiment are shown in Figure 2.8. The initial data in each plot indicate that the display temperature remained constant at 30 °C and that the skin temperature was generally within 1 °C of the display temperature. At the onset of each stimulus the skin temperature tracks that of the display but does not reach the minimum and maximum intensities of the display temperature within the presentation time. As expected, the skin temperature changed more slowly than that of the display due to the thermal dynamics of the skin.
The participants’ responses to the thermal stimuli were analyzed initially in terms of the percentage of correct responses for each stimulus. There was some variability across participants with individual mean scores averaged across all stimuli ranging from 89% to 98% correct and an overall mean of 91% correct. Figure 2.9 shows the mean percentage of correct responses for each of the six stimuli. Pattern B, which involved a linear decrease in temperature was the easiest stimulus to identify with 100% correct responses across participants, whereas pattern C which was a step change from cold to warm had the lowest percent of correct responses at 84%. Surprisingly, pattern D which was the opposite to pattern B with a linear increase in temperature from cold to warm was also one of the more difficult patterns to identify with 85% correct. Due to the inhomogeneity of the variance in the percent correct responses for each thermal stimulus, a non-parametric ANOVA (Friedman’s test) was conducted on these data. The results indicated that there was a significant main effect of thermal stimuli (p=0.005). Post hoc analyses revealed that pattern B had a significantly higher number of correct responses than pattern C.
The confusion matrix of the participants’ responses (Table 2.1) indicates which of the six stimuli were most frequently confused and provides cues as to the dimensions of thermal patterns that may have been difficult to encode. In general, participants made very few errors, and the patterns that were confused usually had similar properties. For example, patterns A and F were both square waves with different magnitudes and C and E were both step responses that differed with respect to the final temperature of the step input.
36
Figure 2.8 Temperatures measured on the skin and the display averaged across trials and subjects for each of the six thermal stimuli. The first 20 s of data prior to each stimulus presentation are also shown.
37
Figure 2.9 Group mean percent of correct responses for each thermal pattern. The standard deviations are shown.
The information transfer (IT) was calculated from the confusion matrix from each participant using the relevant equations in Tan et al. [33]. IT values specify how many “bits” of information participants can distinguish from the set of patterns presented and indicate the maximum number of stimuli that can be identified without error. For each stimulus-response pair (𝑆𝑖, 𝑅𝑗) the IT was calculated by:
𝑰𝑻 (𝑺𝒊, 𝑹𝒋) = 𝐥𝐨𝐠𝟐(𝑷(𝑺𝒊/𝑹𝒋)
𝑷(𝑺𝒊) ) ,
where 𝑃(𝑆𝑖/𝑅𝑗) is the proportion of correct responses 𝑅𝑗 for 𝑆𝑖, and 𝑃(𝑆𝑖) is the probability of
stimulus 𝑆𝑖. The average IT value for each skin site and spacing was calculated using the equation:
Table 2.1 Confusion matrix of the group responses with scores out of the total of the 80 trials presented for each stimulus. The highlighted diagonal represents correct responses.
38 𝑰𝑻 = ∑𝒋=𝟏𝑲 ∑𝑲𝒊=𝟏𝑷(𝑺𝒊, 𝑹𝒋)𝐥𝐨𝐠𝟐(𝑷(𝑺𝒊/𝑹𝒋) 𝑷(𝑺𝒊) ) = ∑ ∑ 𝑷(𝑺𝒊, 𝑹𝒋) 𝑲 𝒊=𝟏 𝑲 𝒋=𝟏 𝐥𝐨𝐠𝟐( 𝑷(𝑺𝒊,𝑹𝒋) 𝑷(𝑺𝒊)𝑷(𝑹𝒋)) ,
where 𝑃(𝑆𝑖, 𝑅𝑗) is the probability of response 𝑅𝑗 given 𝑆𝑖, and 𝑃(𝑅𝑗) is the probability of 𝑅𝑗. The
maximum IT is called the Information in Stimulus (IS) which is the total number of bits contained in the stimuli or the IT value for 100% accuracy, and can be calculated more simply using the equation:
𝑰𝑺 = − ∑𝑲𝒊=𝟏𝑷(𝑺𝒊)𝐥𝐨𝐠𝟐𝑷(𝑺𝒊)
The IS, or maximum IT for 6 stimuli is 2.6 bits, meaning that there are 2.6 total possible bits of information to be transferred from the six stimuli that have to be identified. The calculation 2IT gives the maximum number of stimuli that can be correctly identified, although it
is not generally an integer [33]. The IT values ranged from 1.76 to 2.49 bits across participants and the group mean value was 2.11 bits. This is interpreted as indicating that for this set of six stimuli 4.3 patterns can be correctly identified.
39
2.3 Thermal Icons on Fingertips
The fingertips of our hands are not as sensitive to thermal stimuli as the base of the thumb or several other locations such as the wrist or forearm. The objective of this experiment was to present the same set of thermal icons, as that used in the first experiment, to the fingertips of the first two fingers of the right hand and compare the results with those obtained on the thenar eminence. In this experiment apart from the location of the presentation of the thermal stimuli, all other parameters were the same as those used in the first experiment.
2.3.1 Experimental Design
Participants
Eight normal healthy individuals, 6 males and 2 females, ranging in age from 20 to 27 years old (mean: 25 years) participated in the experiments. They were all right-handed. They had no known abnormalities of the skin or peripheral sensory or vascular systems. None of the participants had any significant experience in thermal stimuli pattern recognition. They all signed an informed consent form that was approved by the MIT Committee on the Use of Humans as Experimental Subjects.
Apparatus
The second experiment used the same apparatus as was used in the first experiment where the thermal icons were presented on the thenar eminence. The thermal display based on a Peltier device provided the thermal stimuli to the skin on the fingertips (see Figure 2.10).
Procedure
Participants washed their hands prior to starting the experiment. A thermistor was then glued to the edge of the index finger on the right hand using biocompatible cyanoacrylate (Liquid BandageTM, Johnson & Johnson). Initial skin temperatures of the participants ranged from 29 to
40
33 °C with a mean of 30 °C. The ambient temperature in the room was maintained at 24 °C, as measured with a thermocouple in free air. Participants placed their palm and the wrist on the supporting fixture, and brought their fingertips in contact with the thermoelectric module’s surface.
The contact area between the fingers and the Peltier device was 600-700 mm2 across
participants, which was similar in range to the first experiment (see Figure 2.11). A visual depiction of the stimuli was presented on the computer screen in front of the participant (see Figure 2.5). In the familiarization period participants selected each stimulus in turn using a computer mouse and the stimulus was then presented on the hand while they looked at the visual display. After this, there was a series of practice trials in which stimuli were presented and participants had to indicate which pattern they felt. Feedback was provided after each response. After the practice session which typically lasted 5 minutes, the experiment began. To ensure that the skin temperature of the hand returned to a baseline temperature before each stimulus was presented, the thermal display was maintained at 30 °C for 20 seconds between trials.
Each stimulus lasted 30 seconds and was presented eight times in a randomized order to give a total of 48 trials. Two different auditory cues were provided to signal the start and finish of each stimulus presentation. After the second auditory cue, participants indicated their responses by selecting the letter (A-F) associated with the visual pattern on the GUI on the screen. Responses had to be made within 10 seconds and on most trials participants made their Figure 2.10 Thermal display with thermoelectric module mounted on a heat sink and fan (left) and with the fingertips over the thermoelectric module during stimulus presentation (right)
41
responses within a couple of seconds. A rest break was provided when requested. No feedback regarding the correctness of the responses was provided during the main experiment.
2.3.2 Results
The group mean temperature measured on the hand and the thermal display during the experiment are shown in Figure 2.12. The initial data in each plot indicate that the display temperature remained constant at 30 °C and that the skin temperature was generally within 1 °C of the display temperature. It is evident from the plots that skin temperature changed more slowly than that of the display due to the thermal dynamics of the skin.
The percentage of correct responses for each stimulus among participants averaged across all stimuli ranged from 75% to 85% correct with an overall mean of 80% correct. Figure 2.13 shows the mean percentage of correct responses for each of the six stimuli. Pattern B, which involved a linear decrease in temperature was the easiest stimulus to identify with 100% correct responses across participants, whereas pattern D which was the opposite to pattern B with a linear increase in temperature from cold to warm had the lowest percent of correct responses at 64%. Pattern C which was a step change from cold to warm was also one of the more difficult patterns to identify with 75% correct. The results of a non-parametric ANOVA (Friedman’s test) indicated that there was a significant main effect of thermal stimuli (p=0.005). Post hoc analyses revealed that pattern B had a significantly higher number of correct responses than pattern D.
Figure 2.11 Baking soda was used to mark the contact area of the skin on the fingertips with the thermal display.
42
The confusion matrix of the participants’ responses (Table 2.2) indicates that participants confused patterns A and F which were both square waves with different magnitudes. Surprisingly, participants confused pattern C with pattern D, which differed in respect to the rate at which temperature changed. Pattern D was confused most often with pattern E, which can be attributed to the similarity in their ranges of temperature.
Figure 2.12 Temperatures measured on the skin and the display averaged across trials and subjects for each of the six thermal stimuli. The first 20 s of data prior to each stimulus presentation are also shown.
43
The IT values, calculated from the confusion matrix from each participant, ranged from 1.66 to 2.02 bits across participants and the group mean value was 1.83 bits. This is interpreted as indicating that for this set of six stimuli 3.6 patterns can be correctly identified.
Figure 2.13 Group mean percent correct responses for each thermal pattern. The standard deviations are shown.
Table 2.2 Confusion matrix of the group responses with scores out of the total of the 64 trials presented for each stimulus. The highlighted diagonal represents correct responses.
44
2.4 Discussion
The results from the present experiments indicate that small sets of thermal icons created by varying the direction, magnitude and rate of temperature change can be readily identified with little training. The overall performance of participants in the first experiment was 91% correct which is better than the 83% correct reported by Wilson et al. [30] for a smaller set of four thermal icons. In the second experiment in which the thermal stimuli were presented on the fingertips, the participants achieved 80% correct responses. However, in the experiment by Wilson et al. each stimulus was presented for 10 s as compared to 30 s in the present study, which no doubt contributed to the better performance reported here. It is also possible that auditory cuing of the stimulus onset and offset facilitated performance. This was implemented so that participants would attend to the stimuli and know when to make a response. In contrast to other types of stimulation involving the skin, such as vibration, the temperature of the skin is continually changing, particularly on the hands and feet, and so even when the thermal stimulus has finished, the skin continues to change temperature.
The decision to use a relatively long presentation time was based on pilot studies on the changes in skin temperature with different thermal inputs. Pilot data indicated that skin temperature changed slowly over the temperature range of interest and that for stimuli such as square-wave inputs a longer presentation time was required in order for the stimuli to be represented on the skin. These preliminary experiments also revealed that different input waveforms such as sinusoids, square waves and triangular waves would not be perceptually distinguishable as the changes in skin temperature with each of these input signals were very similar when presented over 30 s intervals. One of the objectives of the experiment was to identify stimulus features that were accurately identified that could then be used to create shorter, highly salient, thermal icons.
The present experiment also revealed the importance of recording changes in skin temperature during stimulus presentation as these measurements provide insight into the responses made by participants. Pattern B had the highest accuracy in terms of identification and
45
was the only stimulus that involved a slight increase in temperature followed by a steady decrease. In future experiments it will be important to determine whether this result reflects the uniqueness of the stimulus or the superior ability to detect cold as compared to warmth [8, 9]. The two icons that were the most difficult to identify were patterns C (a step input) and D (a ramp). The skin temperature measurements made while these were presented indicate that the change in temperature was very similar for these two icons (see Figure 2.8 and Figure 2.12). In addition, they were both most likely to be misidentified as pattern E (see Table 2.1 and Table 2.2), which also resulted in a similar temperature profile. If a larger set of thermal icons were to be created and evaluated these transient thermal responses of the skin would need to be taken into account to maximize the distinctiveness of the icons. Clearly, the presentation time for thermal icons will need to be reduced if they are to be implemented in hand-held displays. For this to occur the initial transient thermal responses on the skin will need to be made as distinct as possible. It is known that the time taken to process thermal information is slower than that for other aspects of cutaneous stimulation [34] and so it is unlikely that a high throughput rate will ever be feasible for thermal icons.
One challenge in implementing thermal icons in a display will be thermal adaptation, which refers to the decrease in neural responsiveness to stimulation with continuous exposure to the stimulus [10]. The skin adapts to both warm and cold stimulation, and the rate at which adaptation occurs is very rapid for temperatures close to that of the skin, and much slower for more extreme temperatures [35]. Much of the research on the temporal aspects of thermal stimulation such as adaptation has focused on its effect on thermal thresholds [36], rather than supra-threshold stimuli of the type used in the present study. Future research will need to address this shortcoming and determine which rates of stimulus presentation are optimal for identification and how changes in the baseline temperature of the skin influence identification. For the group of participants in the present experiment, baseline skin temperatures ranged between 30 and 34 °C. However, under normal conditions the resting temperature of the skin of the hand can vary between 25 and 36 °C across individuals [37, 38]. This means that thermal stimuli such as those used in the present experiment can evoke very different perceptual
46
responses across individuals because the same stimulus may warm or cool the skin depending on its initial temperature.
The response required of participants was to match the thermal sensation on the hand to a schematic visual representation of the thermal input (Figure 2.5). As the responses depicted in Figure 2.7 and Figure 2.11 illustrate the change in skin temperature did not precisely match these representations and there was always an initial transient response as the skin cooled or warmed. A more realistic representation of the change in skin temperature should be adopted in future work using this experimental paradigm. Alternative strategies such as training participants initially to associate each thermal stimulus with an abstract concept could also have been implemented, as this has been successfully employed previously [29].
The mean IT of 2.11 bits for the stimulus presentation on the thenar eminence was surprisingly high given previous findings on thermal icon identification [29, 30]; it is important to note that in the latter studies the participants were mobile and outdoors and so the thermal conditions were much more dynamic. With six stimuli, the IT value is interpreted as indicating that between four and five thermal patterns can be identified. For the tactile modality, IT values of around 2.4 bits have been reported for sets of nine vibrotactile tactons presented at a single site on the hand [25]. Similar to the present experiment, these studies also required that participants match the tactile pattern to a visual representation. Higher IT rates have been found when spatial signals have been used to create vibrotactile tactons [39]. Spatially distributing stimulation across the hand would probably be much less effective for the thermal modality because of the pervasive spatial summation that occurs. Yang et al. [40] found that participants were unable to discriminate between two thermal inputs presented on the fingertip and that thermal stimuli displayed on one finger influenced the perception of stimuli presented to other fingers on the same hand. One possible dimension of thermal stimulation that should be further explored in this context is creating the perception of moisture or wetness by delivering particular patterns of cold and pressure stimulation [41].
47
2.5 Conclusion
The results from this experiment indicate that small sets of thermal icons created by varying the direction, magnitude and rate of temperature change can be readily identified with little training. The temperature of the skin tracked that of the thermal display but did not reach the minimum and maximum intensities of the display within the presentation time. Preliminary experiments on the response of the skin to various types of thermal inputs indicated that waveforms such as square waves, sinusoids and triangular waves resulted in very similar changes in skin temperature and so were unlikely to be perceptually distinguishable. The three profiles selected did produce distinct changes in temperature as reflected in the participants’ performance. The individual mean scores associated with the six thermal stimuli ranged from 80% to 98% on the thenar eminence and from 81% to 88% on the index finger with overall means of 91% and 84% respectively. The information transfer values for the thenar eminence averaged 2.11 bits and for the finger 1.83 bits. These findings demonstrate that with sufficiently long presentation times, the information processing capabilities of the thermal sensory system may rival those achieved with vibrotactile inputs. Finally, the results provide support for the use of thermal displays in applications in which the device or interface is grasped in the palm of the hand.
48
49
Chapter 3
Thermal Pattern Identification with Revised
Thermal Icons
3.1 Motivation and Concept
The previous experiments on absolute identification of thermal patterns on the thenar eminence and the fingertips showed that a set of unique thermal icons can be created with effective stimulus dimensions. The thermal icons were more accurately identified on the thenar eminence as compared to the fingertips which indicated the importance of considering the variable thermal sensitivity across the human body.
The set of six thermal icons presented on the thenar eminence were identified accurately and when performance was evaluated in terms of Information Transfer (IT) the IT values were comparable to those of other tactile modalities such as vibrotactile inputs. This supports the use of thermal displays in applications in which the device or interface is grasped in the palm of the hand. However, the long duration of 30 seconds for each thermal icon limits the application of these icons in displays. The earlier studies which proposed the concept of thermal icons [29, 30] used a stimulus duration of 10 seconds followed by an adaptation period of 20 seconds.
In the earlier experiment the same absolute change in temperature was presented to all the participants. The skin temperature was recorded at the periphery of the contact area only to monitor the change in temperature of the skin in contact with the display, and was not used as an input to the thermal display. In order to present the same change in temperature to all users,
50
the thermal stimuli should be presented relative to the user’s skin temperature. Such a set of thermal icons should induce similar thermal sensations by presenting the same temperatures to all users.
Figure 3.1 Concept of the thermal display mounted on a user’s wrist with a strap.
Improvements in the design of the thermal icons are required if they are to be used effectively in a thermal display. A set of revised thermal icons were created that had a shorter duration and a profile that was determined by the user’s skin temperature. The location of the thermal display on the body is important due to large variations in thermal sensitivity. It is reported that the thenar eminence at the base of the thumb and the wrist have better sensitivity as compared to the forearm and fingertips [9]. The wrist is one of the most thermally sensitive regions in the upper extremity and a wearable thermal display on the wrist is also convenient for user-based applications. The concept of the thermal display is shown in Figure 3.1.
In this chapter the development of a wearable thermal display is described together with the results from an absolute identification experiment in which a revised set of thermal icons was presented. The objectives of the present experiment were (1) to develop a revised set of thermal icons that are presented relative to the participant’s baseline skin temperature and that have a shorter duration of 10 seconds, and (2) to estimate the information transfer (IT) associated with these thermal icons.


![Figure 1.5 Example of object recognition using perception of thermal properties by the hand [5]](https://thumb-eu.123doks.com/thumbv2/123doknet/14744541.577728/21.918.135.802.357.660/figure-example-object-recognition-using-perception-thermal-properties.webp)