HAL Id: hal-03123302
https://hal.archives-ouvertes.fr/hal-03123302
Submitted on 27 Jan 2021
HAL is a multi-disciplinary open access
archive for the deposit and dissemination of
sci-entific research documents, whether they are
pub-lished or not. The documents may come from
teaching and research institutions in France or
abroad, or from public or private research centers.
L’archive ouverte pluridisciplinaire HAL, est
destinée au dépôt et à la diffusion de documents
scientifiques de niveau recherche, publiés ou non,
émanant des établissements d’enseignement et de
recherche français ou étrangers, des laboratoires
publics ou privés.
Assessing the Health of Flexgrid Optical Networks
Hussein Chouman, Alahdab Luay, Rafael Colares, Annie Gravey, Philippe
Gravey, Hervé Kerivin, Michel Morvan, Annegret Wagler
To cite this version:
Hussein Chouman, Alahdab Luay, Rafael Colares, Annie Gravey, Philippe Gravey, et al.. Assessing
the Health of Flexgrid Optical Networks. [Research Report] LIMOS (UMR CNRS 6158), université
Clermont Auvergne, France; Institut Mines Telecom, IMT Atlantique, Brest. 2020. �hal-03123302�
Assessing the Health of Flexgrid Optical Networks
Hussein Chouman
(1), Luay Alahdab
(1), Rafael Colares
(2),
Annie Gravey
(1), Philippe Gravey
(1), Herv´e Kerivin
(2), Michel Morvan
(1), Annegret Wagler
(2)(1)Institut Mines T´el´ecom, IMT Atlantique, Brest, France (2)Laboratory LIMOS, CNRS UMR 6158, Clermont-Ferrand, France
Email: hussein.chouman@imt-atlantique.fr
Abstract—This paper focuses on quantifying the efficiency of an off-line dimensioning process for flexgrid optical networks. We assume that a network operator attempts to optimize the mapping of a set of demands on a given topology and wishes to assess the remaining capacity of its network once all demands are satisfied. Minimizing the amount of blocked traffic is not an appropriate objective function since all demands should be satisfied. Two other well-known objective functions are thus considered: one is related to path lengths and the other aims to curtail spectrum fragmentation; an alternate objective function, also focusing on spectrum fragmentation, is introduced. Several network level metrics are then proposed, some of them extending existing link or path level metrics; these new metrics either characterize the global fragmentation within the network or the network’s remaining capacity (i.e. the network’s capability to host future demands). We try to reach a better understanding of the pros and cons of the chosen objective functions in order to provide insight on how flexgrid network dimensioning should be performed. This is done by applying off-line dimensioning to some instances (flexgrid network and set of demands) and assessing the impact of the selected objective function on the network level metrics.
Index Terms—RSA, Optical network, flexgrid, optimization, fragmentation
I. INTRODUCTION
In a flexgrid based optical network, the spectrum is split into frequency slices; an optical channel is characterized by one or several contiguous slices dedicated to this specific channel on all links of the path it is routed on. On the one hand, this allows a network operator to support different rates and thus to more efficiently use the available spectrum; on the other hand, the contiguity (on each link) and continuity (over all the links of a path) constraints respectively yield the well known spectrum “horizontal” and “vertical” fragmentation issues, both implying that some spectrum slices cannot be used over some links [1].
Although a well-known phenomenon, it is neither easy to quantify spectrum fragmentation, nor is it easy to assess its impact on resource allocation efficiency in a flexgrid network. The paper thus focuses on deriving quantitative “network health” indicators and highlighting the relationship between spectrum fragmentation and these indicators. We address a network operator’s requirement: assuming that a given set of demands has to be mapped on a certain network, is it possible to assess how much spectrum resources are wasted and to gain insight on how much additional traffic could be supported once the initial set of demands is mapped? In the following, we first discuss state-of-the-art results regarding network dimensioning
and fragmentation metrics. The paper’s contributions are then highlighted.
A. Dimensioning a flexgrid network
In flexgrid optical networks, the problem of establishing lightpaths (optical paths) that compete for spectrum resources is called Routing and Spectrum Assignment (RSA). Off-line RSA considers a static set of demands, whereas on-line RSA deals with dynamic demands. The off-on-line RSA problem is formulated as an Integer Linear Programming (ILP) optimization problem. Thus, mapping demands on a certain network will depend on the selected objective function. There is no clear indications in the literature which objective function yields the “best” network state, as the latter is not specified. In [1], the total number of transponders is minimized in order to reduce the cost necessary to satisfy all demands. In [2], [3], the volume of blocked traffic is minimized. In [4], the sum of lengths of the paths carrying the demands is minimized to limit the total length of selected paths and thus reduce the global spectrum occupancy and delay. Furthermore, slices are assumed to be indexed between 1 and the total number of slices on a link. Other works aim to limit fragmentation by minimizing the max slice-index in the network [5], or the summation, over links, of the max slice-index of each link in the network [6].
B. Fragmentation Metrics
External Fragmentation (EF ) [7] is defined for each link as the ratio of the maximum number of free contiguous slices to the total number of free slices. Shannon’s Entropy (SE) [8] considers how slices are distributed on a link as follows: SE = −PN
i=1Di/D log(Di/D) where D is the total number
of frequency slices in the spectrum, Diis the number of slices
of the ith block of either contiguous free or contiguous used slices and N is the number of such blocks. Access Blocking Probability (ABP ) [9] computes the ratio between the number of possible demands that can be placed on sets of contiguous free slices on a certain link and the number that could be placed if all free slices were contiguous. As the above are ei-ther link level or path level metrics, it is not straightforward to derive from them relevant network level indicators. Moreover, as the usability of a given set of contiguous free slices depends on the “granularity” of the transponder (i.e., the number of slices n required by the transponder), a fragmentation metric should ideally be expressed as a function of n. However, this is the case neither for EF nor for SE and although ABP does take into account transponders’ granularity, it only provides an
average measure of fragmentation over available transponders granularities. Wasted-Unusable-Free Ratio (W U F R) [10] is a path level metric that also depends on transponder granularity: it is defined as the ratio of the number of wasted slices (those that are only free on some, but not all, of the links of a path) and unusable slices (those free on all links of a path but belonging to a block of free slices that is smaller than the number of slices requested by a transponder) to the number of free slices. Lastly, note that none of the above metrics are translated into network level metrics, i.e. where all paths between all origin and destination (o-d) pairs are taken into account, and therefore do not provide any quantitative insight on the network’s remaining capacity (i.e. the network’s capability to host future demands while taking into account the granularity of transponders and network’s wasted resources). C. Contributions
This work focus on the off-line RSA problem. We con-sider three different metrics to be minimized: two are well-known [4], [5], whereas the paper introduces a new one that aims to curtail spectrum fragmentation. We then introduce new network level metrics, as natural extensions of existing link/path level metrics; these new metrics aim to characterize either the global fragmentation within the network or the network’s remaining capacity. Finally, we try to reach a better understanding of the pros and cons of the chosen objective functions, following an approach applied in [11] in the context of the off-line design of IP networks. The comparison between objective functions is performed using our new proposed network level metrics.
The rest of the paper is organized as follows: Sec. II presents a recent ILP formulation used to solve the off-line RSA problem [12]. In Sec. III, several network level metrics are proposed while Sec. IV applies optimization algorithms to a practical dimensioning problem, highlighting the relationship between spectrum fragmentation and network health indica-tors. Sec. V concludes the paper.
II. OFF-LINEDIMENSIONING
Fig. 1 shows the different components of the process mod-elled in this work: the inputs (topology and set of demands), how to solve this problem (RSA algorithm) for a given objective function q, and the output which is denoted as mappingq.
A. Set of demands
A given demand to an optical transport network is expressed as a requested bit rate to be carried between an o-d pair. Since we put the emphasis in this study on the RSA problem, the modulation format used by the transponder(s) serving a given demand has to be defined prior addressing the RSA problem. Moreover, we do not allow for an intermediate regeneration of the lightpaths. Thus each lightpath is associated to a pair of transponders, selected among a set of possible ones characterized by their bit rate, the number of spectrum slices they occupy and a transmission reach. Therefore, between each o-d pair, there should exist at least one path shorter than the maximum reach allowed by the transponder set. In these
Fig. 1. RSA Optimization for objective function q
conditions, for each demand we select the smallest transponder bit rate that is able to carry it. If none of the transponders is able to carry the demand while satisfying the transmission reach limit (or if the requested capacity is higher than the highest transponder bit rate), the demand is split into smaller ones till we find suitable transponders. Once this preliminary step has been performed, the set of traffic demands addressed to the RSA module is thus expressed in terms of number of slices, submitted to a maximum distance condition.
B. Defining the RSA problem
An input of the RSA problem is composed of
• an optical-network topology represented as an undirected,
loopless, and connected graph G = (V, E), where V corresponds to the set of network nodes and E to the set of network links,
• an edge-length (in kms) vector ` ∈ RE+,
• an optical spectrum (available slices) defined by the set of slice indexes S = {1, . . . , s}, and
• a multiset K of traffic demands where each k ∈ K is specified by an origin node ok ∈ V , a destination node
dk ∈ V \ {ok}, a requested number wk ∈ N+ of slices,
and a transmission reach `k ∈ R+ (in kms).
Both wk and `k characterize a type of requested transponder.
The off-line RSA problem aims to determine for each traffic demand k ∈ K, a lightpath composed of a route (i.e., an (ok, dk)-path Pk in G) whose length does not exceed the
transmission reach `k and a channel (i.e., a subset Sk ⊆ S
of slices) such that:
• the wk slices allocated to traffic demand k (i.e., slices
in Sk) are the same all along the route Pk (spectrum
continuity),
• the channel allocated to traffic demand k is composed of wkcontiguous slices (i.e., Sk= {i, i + 1, . . . , i + wk− 1}
where 1 ≤ i ≤ ¯s − wk+ 1 (spectrum contiguity), • a same slice cannot be allocated to two different traffic
demands on the same link (non-overlapping spectrum),
• the value taken by a given metric is optimized.
C. A new ILP for solving the RSA problem
An ILP model for the above off-line RSA problem was introduced in [12]. This model has a polynomial number of variables as it is based on the so-called edge-node formulation for the route determination and a non-polynomial number of constraints that are handled in a polynomial time through the well-known cutting-plane approach [13]. This tractable model is the first ILP model for the off-line RSA problem that considers the entire set of feasible solutions and whose validity is independent of the considered objective function.
D. Objective functions
The optimization objective functions used in this paper are:
• minimizing metric 1, the sum of the demand’s maximum slice used over all the demands,
minX k∈K X s∈S szks, (Objective function 1) where zk
s is the binary variable that equals 1 if and only
if slice s is the last slice assigned to demand k,
• minimizing metric 2, the largest index of an allocated slice over all the edges [5],
min max
e∈E pe, (Objective function 2)
where for a given edge e in E, pe=Pk∈Kx k e P s∈Ssz k s
and binary variable xke equals 1 if and only if the route
Pk uses edge e, and
• minimizing metric 3, the sum of the route lengths over all the demands [4],
minX
k∈K
X
e∈E
`exke. (Objective function 3)
E. Mapping demands: optimality gap
The ILP model with either objective functions is solved through a branch-and-cut framework, that is, a cutting-plane algorithm to handle the non-polynomial numbers of constraints embedded in a branch-and-bound approach that partitions the whole problem into smaller ones [14]. The efficiency of a branch-and-cut approach significantly depends on the strength of both the lower bounds (i.e., best possible objective values that the linear relaxations provide) and the upper bounds (i.e., best found objective values given by feasible solutions encountered during the whole solution process). To improve the latter bounds, we incorporate a greedy-based heuristic that is frequently called during the course of the branching tree. Such an approach may fail to find an optimal solution within a time limit but it usually provides a feasible solution whose quality can be assessed when put in perspective with the lower bound. This is known as the (relative objective) gap, defined as:
best found objective − best possible objective best found objective , and the smaller this gap is, the better the feasible solution is proven to be.
F. Reducing the size of the ILP
To run simulations that use the above optimization model, the number s of available slices on the links needs to be specified. For example, a fiber with a 4-THz spectrum has a nominal number of slices that equals 320 (i.e., 12.5 GHz per slice). However, it would be better to decrease this number in order to decrease both the numbers of variables and constraints in the ILP model and consequently, the time necessary to obtain an optimal solution. Let an admissible link configuration be a number s of available slices on each link that accommodates all demands and such that the proportion of used slices on all links is lower than a given threshold
T (e.g., T = 80%). Before running our simulations, we first perform an initial process that aims at finding an admissible link configuration. Starting with s = 320, this initial process can be described as follows:
1) minimize the number of blocked demands Nblocked, i.e.,
minX
k∈K
(1 −X
s∈S
zsk)
2) and if Nblocked = 0 and the maximum spectrum
oc-cupation observed over all the links does not exceed T , reduce s by 40 and go back to the first step to recompute Nblocked.
At the end of the initial process we have reached a number s of available slices per link that satisfies both the non-blocking and spectrum utilization conditions.
III. NETWORKLEVELMETRICS
Selecting s as specified in Sec. II-F ensures that there always is a feasible solution (i.e., without blocking), regardless of the objective function; however, the mapping depends on the selected objective function. How can differences between obtained mappings be characterized? This section proposes network level metrics to characterize the “network health”, and classifies these metrics into “network state” and “remaining capacity” metrics.
A. Network State Metrics
1) Total number of holes: This metric is the sum of the number of holes on all the links (a spectrum hole on a link is a set of contiguous free slices).
2) Network level fragmentation metrics: For a given map-ping, having computed F Me, the value of a link
fragmenta-tion metric for each link e, the network level fragmentafragmenta-tion F Mmappingof this mapping is defined as the average over the
set of links: F Mmapping= X e∈EF Me . | E | (1) 3) Optimization relative metrics: Let us define metricp, q
as the value taken by metric p in mappingq (obtained with
objective function q). If mappingp is optimal (zero relative
gap), the best possible value for metricp, q is obtained when
p = q; this may not be the case otherwise. For each metric p, the difference percentage with reference to metricp, p is:
M etricp, q= (metricp, q− metricp, p)/metricp, p. (2)
A negative value indicates that mappingp is sub-optimal, and
that mappingq yields a smaller value for metric p. A positive
value indicates that, although mappingp may still be
sub-optimal, it nevertheless yields a smaller value for metric p than mappingq.
B. Remaining Capacity Metrics
We build remaining capacity metrics by extending an ap-proach described in [10].
1) Wasted and accessible slices: Let pm,i be the ith path
between the o-d pair m. On each link of pm,i, there are used
slices and free slices, the latter being partitioned into wasted and accessible slices as explained in Sec. I-B; let us define Wm,i(respectively Am,i) as the number of wasted (respectively
accessible) slices on path pm,i. Metric Wm,i(respectively Am,i)
is Wm,i(respectively Am,i) divided by the number of links of
the path pm,i. Dimensionless metrics are obtained by dividing
the above metrics by s.
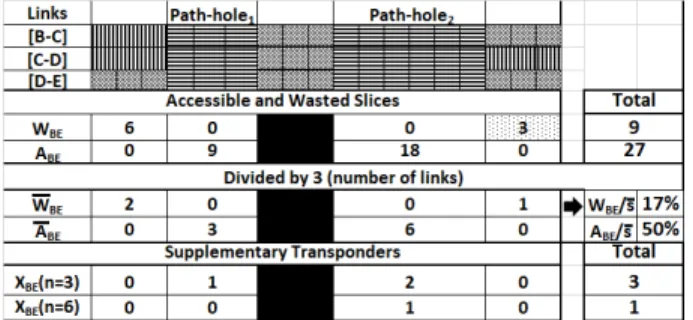
2) Number of supplementary transponders: On a given path, accessible slices are grouped into “path-holes”, that is, sets of continuous and contiguous accessible slices separated by either wasted or used slices. If pm,i satisfies transponder’s
reach and has at least one path-hole j of size larger than n, then it is defined as a n-feasible path. The number of supplementary transponders with granularity n that could be accommodated on pm,i is: Xm,i(n) = J X j=1 jAm,i,j n k (3) where bx/nc denotes the integer division of x by n and J denotes the total number of path-holes in a n-feasible path pm,i.
Fig.2 illustrates the above concepts by computing the re-maining capacity metrics WBE, ABE and XBE(n) on path
B-C-D-E between nodes B and E with 3-slice and 6-slice transponders. There are 18 used slices and 36 free slices, which are partitioned into WBE= 9 wasted slices (in blue) and
ABE = 27 accessible slices (in orange). As there are 3 links
on the path and ¯s = 18, WBE= 3 and ABE= 9. Dimensionless
metrics (respectively 16.7% and 50 %) are obtained if we divide by s= 18. The accessible slices of the path are grouped into two path-holes: path-hole1, A(BE, 1)= 3, can accommodate
one 3-slice transponder, while path-hole2,A(BE, 2)= 6, can
ac-commodate either two 3-slice transponders or a single 6-slice transponder.
Fig. 2. Remaining capacity metrics for PathBE.
3) Network remaining capacity: For o-d pair m, let Im
denote the total number of paths that can be used for m and Im(n) denote the number of n-feasible paths (Im(n) ≤ Im).
For each path i of o-d pair m and remaining capacity metric RCm,i (either Wm,i, Am,i, or Xm,i(n)), we compute network
level metrics by first averaging RC over the number of feasible paths I (which can be Im or Im(n) depending on the
considered RC metric), and then averaging over the number M of o-d pairs. A network level remaining capacity metric is thus defined as:
RC = M X m=1 PI i=1RCm,i I ! . M. (4)
IV. ASSESSING THE OFF-LINE DIMENSIONING PROCESS
We now illustrate how the choice of the objective function impacts the mappings obtained when performing off-line RSA. Due to space constraints, most of the results presented in this paper correspond to a single instance (i.e., a set of demands to be mapped on a given network); however, it has been checked that consistent results are obtained when different instances are considered.
Fig. 3 illustrates how the network level metrics are com-puted on each of the obtained mappings.
Fig. 3. Comparison block.
A. Problem Specification
The network, the set of demands to be mapped on it and how the RSA optimizer is implemented are now described.
1) Network and transponders: We have considered a small network, namely the 9-Node M-NSF, which is based on the 9-Node NSF topology with 13 links [15]. The modification on the original NSF topology consists in dividing link lengths by 2 to consider transponders with suitable transmission reach. The considered transponders require 3, 5 or 6 slices and respectively support 100 Gb/s (3000 km reach), 200 Gb/s (1500 km reach), or 400 Gb/s (600 km reach).
2) Set of demands and admissible link configuration: The total bit-rate traffic to be mapped on the M-NSF network is 6.2 Tb/s. The resulting set of demands are derived as explained in Sec. II-A and correspond to 59 demands, totalling 246 slices. Running the process described in Sec. II-F yields s = 120.
3) Running the RSA: The model is implemented using Cplex 12.10 and runs on a high performance computing cluster with a 32 Gigabytes memory. The program stops and provides either an optimal solution or a feasible solution with a positive relative gap when a time limit is reached.
B. Qualitative assessment of spectrum occupancy
Fig. 4 shows link occupancy for all 3 mappings of the demands. Links and slices are represented as a two-dimension array, where each row represents a link composed of used (black) and free (white) slices.
In mapping1 and mapping2, most of the used slices are
Fig. 4. Slice distribution in the M-NSF topology for mapping1 (left), mapping2(middle) and mapping3(right). Black: used slice, white: free slice
mapping3, used slices are distributed all over the spectrum.
This was to be expected as both objective functions 1 and 2 are used to limit link fragmentation by focusing on the largest used slice per demands, whereas objective function 3 focuses on path lengths, irrespective of the location of the used slices. Furthermore, we see that in mapping2, the max slice indexes
are similar on most of the links, whereas they significantly differ in mapping1, showing more compact sets of used slices.
Note that the achieved value of metric 2 in mapping1 is only
slightly larger than the optimum achieved in mapping2;
there-fore, compacting the used slices by using objective function 1 does not significantly increase the value of the largest used slice over all edges.
In the following, we assess how this qualitative assessment translates into quantitative network level metrics.
C. Network state metrics
With a simulation-time limit set to 28 hours, an optimal mapping3is obtained in less than 40 minutes, while an optimal
mapping2 is obtained in 27 hours. On the other hand, a
sub-optimal mapping1 (with a 23.9% relative gap) is provided
when the program stops due to the time limit.
Table I lists the network level state metrics computed for the three mappings of the M-NSF instance.
TABLE I
NETWORK STATE METRICS FORM-NSFINSTANCE.
Metric Mapping1 Mapping2 Mapping3
Total number holes 52 66 99 EF 0.070 0.080 0.204 SE 0.389 0.482 0.800 ABP 0.011 0.017 0.030 Metric1, q 0 % 38 % 116 % Metric2, q 5 % 0 % 64 % Metric3, q 11 % 22 % 0 %
1) Total number of holes: The respective numbers of holes obtained for the 3 mappings confirm the previous observa-tions. First, the numbers of holes in mapping1 and mapping2
are close; a more compact spectrum obtained in mapping1
translates in a lower achieved total number of holes. On the other hand, roughly twice more holes are present in mapping3.
2) Network level fragmentation metrics: For all 3 network level fragmentation metrics, the hierarchy of mappings, from the least fragmented to the most fragmented, is mapping1,
mapping2, mapping3. The latter, as expected, presents
re-ally larger values than the former two; also, mapping1,
al-though sub-optimal, is still significantly less fragmented than mapping2 according to EF , SE, and ABP .
3) Relative Optimization Metrics: Considering Metric1,2,
we see that mapping2 reaches a value for metric 1 which is
significantly larger than the value reached by mapping1,
al-though the latter is sub-optimal. On the other hand, as Metric2,1
equals 5%, we see that mapping1achieves a value quite close
to the optimum for metric 2. As expected, mapping3 fails to
provide values for metrics 1 and 2 close to those obtained by mapping1 and mapping2. Conversely, mapping2 and even
more mapping1, provide values for metric 3 rather close to
the optimum achieved in mapping3; this means that reducing
spectrum fragmentation (using objective functions 1 or 2) is not made at the cost of increasing significantly path lengths. D. Remaining capacity metrics
We now quantify the impact of fragmentation on network’s remaining capacity.
1) Wasted and accessible slices: Fig. 5 presents the num-bers of wasted and accessible slices of the obtained mappings as defined in Sec. III-B.
Fig. 5. Network’s average wasted and accessible slices of the M-NSF topology
The proportion of wasted slices is much larger for mapping3
than for the two other mappings; obviously, it also means that the proportion of accessible slices for mapping3is significantly
lower than the ones than for the two other mappings. The wasted and accessible numbers for mapping1 and mapping2
are quite similar, with more than 40% of accessible slices, the former providing a slightly better performance than the latter. 2) Number of supplementary transponders: For each con-sidered transponder’s granularity n in {3,5,6}, Fig. 6 plots X(n). X(n) is twice as large (for n = 3) or even three times larger (for n = 5 or 6) for mapping1and mapping2 than
for mapping3. The gain is larger for a larger n; indeed, some
Fig. 6. No. of supplementary transponders versus n for M-NSF topology
requires a set of several contiguous available slices. In the M-NSF network, we see in Fig. 6 that similar values for X(n) are obtained for mapping1and mapping2, the former providing
a slightly better performance.
We have also studied a smaller instance, namely the 5-Node Spain network with 7 links [16], s = 40, and a set of 15 demands (totalling 68 slices). Optimal mappings were obtained for the 3 objective functions. Fig. 7 shows that, for this instance, the performance in terms of X(n) is significantly better for objective function 1 than for both objective functions 2 and 3.
Fig. 7. No. of supplementary transponders versus n for Spain topology
V. CONCLUSION
This paper has highlighted the major impact of the selected objective function on both fragmentation metrics and remain-ing capacity metrics. We observed consistent results on all studied instances (only part of them were presented here).
Using the path length related objective function (objective function 3) yields a very quick optimization process but provides a mapping which presents a large global spectrum fragmentation level, and a very low remaining capacity.
Using a spectrum usage related objective function (objective functions 1 and 2) yields harder optimization task. For the M-NSF instance, the required computation time to provide an optimal solution with objective function 2 and only a sub-optimal solution for objective function 1 is 50 times larger. However, both mappings present global fragmentation indicators that are half of those obtained for mapping3 and
X(n) values that are twice or three times larger than those for mapping3. The path length indicator (metric 3) values obtained
for mapping1 and mapping2 are only slightly larger than the
optimum reached for mapping3.
At the cost of a harder optimization task, objective function 1 provides better results than objective function 2, even when a sub-optimal mapping1 compares with an optimal mapping2.
The on-going work includes improving the ILP formulation in order to tackle larger instances of off-line RSA and identify-ing how to best use some of the newly defined network health metrics to decide when the network need to be re-dimensioned in order to avoid any blocking. Indeed, network level metrics can be used in other frameworks, including off-line RAS based on heuristics and on-line RSA used for mapping new demands on an operational network.
This work was carried out within the framework of the French research project FLEXOPTIM (ANR- 17-CE25-0006).
REFERENCES
[1] D. Amar, E. Le Rouzic, N. Brochier, J. Auge, C. Lepers, N. Perrot, and S. Fazel, “How problematic is spectrum fragmentation in operator’s gridless network?” in ONDM, May 2014, pp. 67–72.
[2] M. Ruiz, M. Pi´oro, M. ˙Zotkiewicz, M. Klinkowski, and L. Velasco, “Column generation algorithm for RSA problems in flexgrid optical networks,” Photonic Network Communications, vol. 26, no. 2, Dec 2013. [3] M. Klinkowski, M. Pi´oro, M. ˙Zotkiewicz, M. Ruiz, and L. Velasco, “Valid inequalities for the routing and spectrum allocation problem in elastic optical networks,” in ICTON, July 2014, pp. 1–5.
[4] M. ˙Zotkiewicz, M. Pi´oro, M. Ruiz, M. Klinkowski, and L. Velasco, “Optimization models for flexgrid elastic optical networks,” in ICTON, June 2013, pp. 1–4.
[5] K. Walkowiak, R. Go´scie´n, M. Klinkowski, and M. Wo´zniak, “Opti-mization of multicast traffic in elastic optical networks with distance-adaptive transmission,” IEEE Communications Letters, vol. 18, no. 12, pp. 2117–2120, Dec 2014.
[6] A. Ghallaj, R. Romero Reyes, M. Ermel, and T. Bauschert, “Optimizing spectrum allocation in flex-grid optical networks,” in Photonic Networks; 18. ITG-Symposium, May 2017, pp. 1–8.
[7] D. Amar, E. Rouzic, N. Brochier, J.-L. Auge, C. Lepers, and N. Perrot, “Spectrum fragmentation issue in flexible optical networks: analysis and good practices,” Photonic Network Communications, vol. 29, 06 2015. [8] P. Wright, M. C. Parker, and A. Lord, “Simulation results of Shannon
entropy based flexgrid routing and spectrum assignment on a real network topology,” in ECOC, Sep. 2013, pp. 1–3.
[9] D. Amar, E. Le Rouzic, N. Brochier, E. Bonetto, and C. Lepers, “Traffic forecast impact on spectrum fragmentation in gridless optical networks,” in ECOC, Sep. 2014, pp. 1–3.
[10] F. Pederzolli, D. Siracusa, A. Zanardi, G. Galimberti, D. L. Fauci, and G. Martinelli, “Path-based fragmentation metric and RSA algorithms for elastic optical networks,” IEEE/OSA Journal of Optical Communications and Networking, vol. 11, no. 3, pp. 15–25, March 2019.
[11] S. Balon, F. Skiv´ee, and G. Leduc, “How well do traffic engineering objective functions meet traffic engineering requirements?” in NET-WORKING 2006. Springer, 2006, pp. 75–86.
[12] Y. Hadhbi, H. Kerivin, and A. Wagler, “A novel integer linear program-ming model for routing and spectrum assignment in optical networks,” in FEDCSIS, vol. 18, 2019, pp. 127–134.
[13] R. E. Gomory, “Outline of an algorithm for integer solutions to linear programs,” Bull. Amer. Math. Soc., vol. 64, no. 5, pp. 275–278, 09 1958. [14] L. A. Wolsey, Integer Programming. New York, NY:
Wiley-Interscience, 1998.
[15] P. Pavon-Marino, S. Azodolmolky, R. Aparicio-Pardo, B. Garcia-Manrubia, Y. Pointurier, M. Angelou, J. Sole-Pareta, J. Garcia-Haro, and I. Tomkos, “Offline impairment aware RWA algorithms for cross-layer planning of optical networks,” Journal of Lightwave Technology, vol. 27, no. 12, pp. 1763–1775, 2009.
[16] P. P. Mari˜no. (2011) Net2plan: a publicly-available open-source network planner. [Online]. Available: http://www.net2plan.com