HAL Id: hal-00296214
https://hal.archives-ouvertes.fr/hal-00296214
Submitted on 4 May 2007
HAL is a multi-disciplinary open access
archive for the deposit and dissemination of
sci-entific research documents, whether they are
pub-lished or not. The documents may come from
teaching and research institutions in France or
abroad, or from public or private research centers.
L’archive ouverte pluridisciplinaire HAL, est
destinée au dépôt et à la diffusion de documents
scientifiques de niveau recherche, publiés ou non,
émanant des établissements d’enseignement et de
recherche français ou étrangers, des laboratoires
publics ou privés.
Waterfalls as sources of small charged aerosol particles
L. Laakso, A. Hirsikko, T. Grönholm, M. Kulmala, A. Luts, T.-E. Parts
To cite this version:
L. Laakso, A. Hirsikko, T. Grönholm, M. Kulmala, A. Luts, et al.. Waterfalls as sources of small
charged aerosol particles. Atmospheric Chemistry and Physics, European Geosciences Union, 2007, 7
(9), pp.2271-2275. �hal-00296214�
www.atmos-chem-phys.net/7/2271/2007/ © Author(s) 2007. This work is licensed under a Creative Commons License.
Chemistry
and Physics
Waterfalls as sources of small charged aerosol particles
L. Laakso1, A. Hirsikko1, T. Gr¨onholm1, M. Kulmala1, A. Luts2, and T.-E. Parts2
1Department of Physical Sciences, P.O. Box 64, 00014 University of Helsinki, Finland 2Institute of Environmental Physics, University of Tartu, ¨Ulikooli 18, 50090 Tartu, Estonia
Received: 22 June 2006 – Published in Atmos. Chem. Phys. Discuss.: 26 September 2006 Revised: 28 February 2007 – Accepted: 23 April 2007 – Published: 4 May 2007
Abstract. In this study, we measured the mobility
distribu-tions of cluster and intermediate ions with an ion spectrom-eter near a waterfall. We observed that the concentration of negative 1.5–10 nm ions was one-hundred fold higher than a reference point 100 m away from the waterfall. Also, the concentration of positive intermediate ions was found to be higher than that at the reference point by a factor of ten. This difference was observed only at the smallest sizes; above 10 nm the difference was insignificant.
1 Introduction
Aerosol particle formation in the atmosphere is a significant factor affecting both climate and the ecosystem. In addition to large-scale particle formation (Kulmala et al., 2004), new particles are also observed to form on a limited spatial scale. One special case of nucleation mode particle appearance is the breakup of small water droplets (H˜orrak et al., 2005, 2006). These observations show the formation of new, es-pecially negatively-charged intermediate ions related to rain. Recent model calculations suggest that intermediate air ion formation may also take place near waterfalls (Luts et al., 2004).
The effect of waterfalls on the electrical status of the ad-jacent environment has been known for more than a cen-tury. As early as as the 1890s, Lenard (1892) showed that air becomes negatively charged near waterfalls. He also demonstrated that the effect only arises when moving liquid is sprayed at an obstacle. A simple water jet, for example, was found to generate no such effect. Different water-related electrical measurements (e.g. Wilson cloud chamber) were the frequent target of studies in the late 19th century. Flagan
Correspondence to: L. Laakso
(lauri.laakso@iki.fi)
(1998) and the references therein provide a thorough review of these early measurements.
Many have studied the formation of charged droplets, es-pecially in the context of sea spray. Blanchard (1958, 1966) studied charged droplets released from bursting bubbles. In his studies, he found that: 1) drops smaller than four µm are always positively charged, and 2) the larger drops can be ei-ther positive or negative depending on the history of the bub-ble Blanchard (1958). Later on, Gathman and Trent (1968) and Klusek et al. (2004) also studied charges related to bub-bles and sea spray.
In 1994, Reiter measured, in addition to sea spray, ions produced by waterfalls. He found that particles from sea spray smaller than 200 nm carried a net positive charge whereas similar particles from waterfalls were negatively charged. He attributes the difference in polarity to the differ-ent chemical compositions of river and sea water. Reiter also performed some tests with water containing different chem-ical impurities, and found that the polarity indeed depended on the suspended material: added sodium chloride produced positive particles whereas pure water and Mediterranean sea water produced negative ions.
Recently, several authors have discussed charge forma-tion (e.g., ion evaporaforma-tion, the Coulomb explosion, charge residue) in liquid droplets (Iribarne and Thomson, 1976; Znamenskiy et al., 2003, 2006; Vostrikov et al., 2006). Their experiments showed that in some cases small ions can sepa-rate from evaporating charged droplets.
Despite prior knowledge, however, previous studies focus on large particle sizes, and there are no number size distri-bution measurements of cluster and intermediate ions have been carried out in the vicinity of a waterfall. The case of waterfalls differs from, for example, rain, since bulk water is originally electrically neutral whereas rain droplets may be originally charged due to their formation in the clouds.
2272 L. Laakso et al.: Waterfall ions
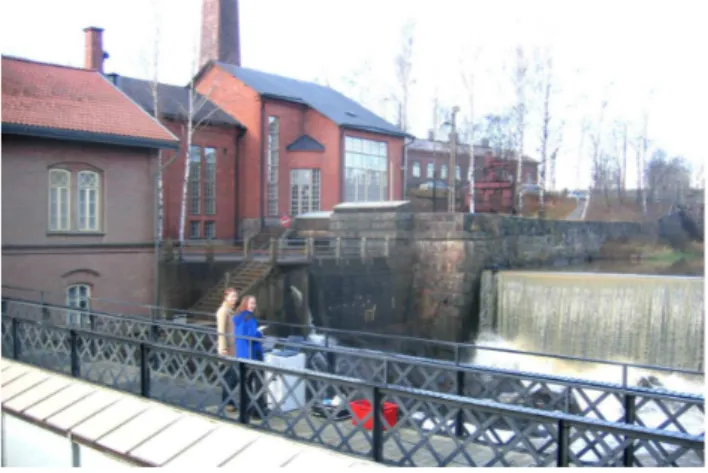
Fig. 1. The Vanhankaupunginlahti barrage with two happy mea-surers. The AIS took measurements from the bridge. The reference measurement point was about 100 m to the right (East) of the bridge. The closest road is located behind the building in the middle of the picture.
2 Instruments
We measured waterfall-produced ions with two Air Ion Spec-trometers (AIS) (Laakso et al., 2004; Airel Ltd.). AISs mea-sure the mobility distributions of air ions: naturally-charged clusters and aerosol particles. The spectrometer consists of two identical cylindrical aspiration-type differential mobility analysers: one for measuring positive ions and the other, for negative ions. Each mobility analyser has 21 collector elec-trodes provided with individual electrometrical amplifiers for measuring the electrical current carried by ions of different mobilities. The air sample containing ions is sucked into the mobility analyser through the electronically-controlled elec-trostatic filter (switched on/off). The filter removes (switched on) the ions from the sample when the offset levels of the measuring electronics are measured for data quality monitor-ing purposes. Otherwise, the filter is switched off. The time resolution of the AIS is typically five minutes, the time used in our experiments. During that time sample and offset level, mobility distributions are measured in turn.
Estimations of diffusion broadening and losses of ions and data inversion are based on a theoretical treatment by Airel Ltd (Fuchs, 1964; Tammet, 1970). Recently, the AISs and their inversion procedure have been calibrated in the labora-tory down to 2 nm and less by comparing the devices to the other type of ion spectrometer, Balanced Scanning Mobility Analyzer (BSMA, Airel Ltd), which is considered an etalon device (Tammet, 2004, 2006).
In our experiments, the mobility range of AISs was 0.00133–3.16 cm2V−1s−1. The mobility distributions of
ions are presented by 28 logarithmically uniformly dis-tributed fractions. According to Tammet’s algorithm (1995), the diameter range is 0.34 to 40 nm at normal temperature and pressure (273 K and 1 atm), which are assumed here
when converting the mobilities to diameters. We must note that conversion from mobility to diameter assumes only one charge per cluster/particle. In the atmosphere, this assump-tion is sufficient for small particles due to their low charg-ing probability (e.g. Fuchs, 1964). However, in the case of waterfalls, artefacts of size can arise if droplets are multiple charged, depending on their formation processes.
In addition to air ion spectrometers, we used a Delta OHM DO 9847 logger with Pt100 and Mk-33 sensors to mea-sure temperature, relative humidity and presmea-sure. The to-tal aerosol particle number concentration was measured with two TSI Model 3007 condensation particle counters with a cut-off size of 10 nm. The two CPCs were compared side by side with ambient particle concentrations of 2000 to 40 000 cm−3and the results were corrected by the offset
factor (equal to 0.9) obtained from the comparison, with the lower concentration as a reference.
3 Measurements
The measurements were carried out at Vantaanputous (Fig. 1), a waterfall ca five kilometre northeast of down-town Helsinki, Finland. The waterfall is located near a road located around 100 m from the measurement point. The River Vantaa is a typical river of Southern Finland with a relatively high clay content. On 15 November 2005, the total suspended mass (measured with 0.4 µm mem-brane filters 1.4 km upriver from our measurement point) was 100 mg/litre (personal communication with K. Lahti and Vahtera et al., 2005). The height of the fall is approximately 10 m which produces a maximum velocity of 14 ms−1
as-suming free gravitational fall.
We carried out our measurements on two days: 11 and 18 November 2005. Both days were relatively cold with high humidity (Table 1). On 11 November we measured for 1.5 h and on 18 November for over 4 h.
We used two air ion spectrometers: one on the bridge ap-proximately 20 m from the edge of the waterfall and a refer-ence measurement 100 m from the waterfall to the side of the mean wind. Wind direction was measured with the humid finger method, and these empirical data, together with visual estimation of the traffic density on different roads to choose the reference point. Due to technical problems (a locked gateway) during the second measurement day, the AIS on the bridge was located on the eastern end of the bridge.
Before starting the measurements, we compared the two AISs by running them side-by-side for an hour to detect any possible offset between the devices. When interpret-ing the charged particle concentrations and size distributions, the AIS data at the waterfall was multiplied by the size-dependent coefficients obtained from comparison measure-ments. The average correction factor for positive ions was 1.02 and for negative ions, 1.23. We assumed that differences between the AISs were the same during the experiments.
Table 1. Basic characteristics of the two observation days. 11 November 2005 18 November 2005 Median T [◦C] 9.8 0.8 Median RH [%] 76.5 71.0 Water flow m3s−1 10.9 22.8 Ntot(ref) [cm−3] 19 978 24 649
Ntot(water fall) [cm−3] 14 909 27 412
Difference (waterfall - reference)
Negative ions 1.5–10 nm [cm−3] 5410 1565 Positive ions 1.5–10 nm [cm−3] 562 220 0.1 1 10 100 1 10 100 1000 10000 100000 dN/dlogD p [cm −3 ] Positive 0.1 1 10 100 1 10 100 1000 10000 100000 Diameter [nm] dN/dlogD p [cm −3 ] Negative ref. 11.11. ref. 18.11. wf 11.11. wf 18.11. ref. 11.11. ref. 18.11. wf 11.11. wf 18.11.
Fig. 2. The median size distributions of positive and negative ions at the waterfall (wf) and at the reference point (ref) (11 and 18 November
2005).
4 Results and discussions
Figure 2 shows the size distributions of negative and pos-itive ions. During both days, there was a clear difference between the waterfall and the reference in the concentration of 1.5–10 nm ions. This difference was more pronounced for negative ions, but the concentration of positive ions was also enhanced. When we compared concentrations of negative and positive ions at the reference point from both days, we noticed that the concentrations were relatively equal, as they
should be without sign-dependent intermediate ions sources nearby.
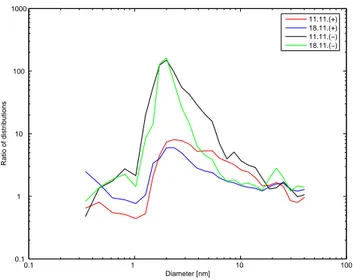
Figure 3 presents the ratios of ion concentrations at the waterfall to those at the reference point. The concentration of negative ions in the size range of 1.5 to 10 nm was up to 120-fold at the waterfall. The concentration of positive ions also increased approximately ten-fold. The effect of waterfall was visible only in ions smaller than approximately 30 nm.
2274 L. Laakso et al.: Waterfall ions 0.1 1 10 100 0.1 1 10 100 1000 Diameter [nm] Ratio of distributions 11.11.(+) 18.11.(+) 11.11.(−) 18.11.(−)
Fig. 3. The ratios of positive and negative ion concentrations at the
waterfall to the concentrations at the reference point.
Another interesting feature is the difference in the widths of the distributions between the two days, which may be due to the differences in the autoionisation rates at different tem-peratures. However, with only two days of data, the reasons for this difference remain speculative. The size of the max-imum concentration also differed. The maxmax-imum of nega-tive ions is made of up of slightly smaller sizes (2nm versus 2.5 nm for positive).
Table 1 summarises the median characteristics of our mea-surements. The upper size limit for the cluster ions is ap-proximately 1.5 nm. We used that value as a lower limit when calculating differences in the intermediate ion concen-trations between the waterfall and the reference point. The table shows a clear difference between the two days on which we performed measurements: on the first observation day, the difference is several times higher than on the second day. This contrasts with the water flow rates in the river Van-taa. We attributed this difference mainly to the differences in wind directions, since measurements of a single point (line) source such as a waterfall are sensitive to even small changes in wind directions. However, the general conclusions for both days are qualitatively similar.
As explained in Sect. 2, we aimed to avoid experimental errors by comparing the devices side-by-side and calibrating them carefully in the laboratory. However, natural sources of errors can also arise which can lead to misinterpretation of the results. One of our main concerns was the possible background contamination of the nearby road. We studied this effect with two portable CPCs and found that the con-centrations and their time behaviour were relatively equal at both the waterfall and the reference point (Table 1). How-ever, concentrations at the bridge were slightly higher, prob-ably due to larger (>10 nm) ions produced by the waterfall.
5 Conclusions
In this study, we present the ion size distribution observations in the vicinity of a waterfall. We found that waterfalls pro-duce intermediate-sized, mainly negative ions. The concen-tration of the negative ions between 1.5 and 10 nm at the wa-terfall was more than 100 times higher than at the reference point. Moreover, the concentration of positive ions increased ten-fold. The maximum concentration of waterfall-produced negative ions was at 2 nm, whereas the maximum of positive ions was at 2.5 nm. Our results are in qualitative agreement with those of a previous study by Reiter (1994), assuming that the negative charge of particles smaller than 200 nm in his study was caused mainly by ions between 1 and 20 nm. The formation of nucleation mode-sized particles from the waterfall is a significant local source of atmospheric con-densation nuclei, and may thus affect the atmospheric chem-istry. If the nucleation mode particles can grow to larger sizes (around 50–100 nm), they may also affect cloud or fog for-mation or both in the vicinity of a waterfall.
Acknowledgements. The authors wish to thank the following
people for their help: J. Yl¨onen from the Finnish Museum of Technology for his help, and especially for providing us with electricity; M. Huttunen of the Finnish Environment Institute and K. Lahti of the Vantaa River and Helsinki Region water protection society for data related to the river Vantaa; and M. Dal Maso and M. Vana for their help with transportation. A. Hienola is acknowledged for test-reading the manuscript. In addition, the Estonian Science Foundation (grants no. 6223 and 5387) and the Maj and Tor Nessling Foundation (grant no. 123) are acknowledged for their funding of this study.
Edited by: W. Conant
References
Airel Ltd, E.: http://www.airel.ee, 2007.
Blanchard, D.: Electrically charged drops from bubbles in sea water and their meteorological significance, J. Meteorol., 15, pp. 383– 395, 1958.
Blanchard, D.: Positive Space Charge from the Sea, J. Atmos. Sci., 23, 507–515, 1966.
Flagan, R.: History of Electrical Aerosol Measurements, Aerosol Sci. Technol., 28, 301–380, 1998.
Fuchs, N. A.: The mechanics of Aerosol, Pergamon, New York, 1964.
Gathman, S. and Trent, E.-M.: Space charge over the open ocean, J. Atmos. Sci., 25, 1075–1079, 1968.
H˜orrak, U., Tammet, H., Aalto, P., Vana, M., Hirsikko, A., Laakso, L., and Kulmala, M.: Formation of charged nanometer aerosol particles associated with rainfall, in: Proceedings of Europian Aerosol Conference 2005, Ghent, Belgium, edited by: Maenhaut, W., p. 606, 2005.
H˜orrak, U., Tammet, H., Aalto, P., Vana, M., Hirsikko, A., Laakso, L., and Kulmala, M.: Formation of charged nanometer aerosol particles associeted with rainfall: atmospheric measurements and
lab experiments, in: Proceedings of BACCI, NECC and FCoE activities 2005, edited by: Kulmala, M., Lindroth, A., and Ru-uskanen, T., vol. 81B of Report Series in Aerosol Science, pp. 180–185, 2006.
Iribarne, J. and Thomson, B.: On the evaporation of small ions from charged droplets, J. Chem. Phys., 64, 2287–2294, 1976. Klusek, Z., Wisznievski, A., and Jakacki, J: Relatioships between
atmospheric positive electric charge densities and gas bubble concentrations in the Baltic Sea, Oceanologia, 46, 459–476, 2004.
Kulmala, M., Vehkam¨aki, H., Pet¨aj¨a, T., Dal Maso, M., Lauri, A., Kerminen, V.-M., Birmili, W., and McMurry, P.: Formation and growth rates of ultrafine atmospheric particles: a review of ob-servations, J. Aerosol Sci., 35, 143–176, 2004.
Laakso, L., Anttila, T., Lehtinen, K., Aalto, P., Kulmala, M., H˜orrak, U., Paatero, J., Hanke, M., and Arnold, F.: Kinetic nucle-ation and ions in boreal particle formnucle-ation events, Atmos. Chem. Phys., 4, 2353–2366, 2004,
http://www.atmos-chem-phys.net/4/2353/2004/.
Lenard, P.: U¨ber die Elektrizit¨at der Wasserf¨alle, Ann. Phys., 46, 584–636, 1892.
Luts, A., Noppel, M., and Vehkam¨aki, H.: Effect of sulfuric acid on the composition of negative small air ions: a numerical simula-tion, in: J. Aerosol Sci., EAC 2004 abstract book, 2004. Reiter, R.: Charges on particles of different size from bubbles
of Mediterrian Sea surf and from waterfalls, J. Geophys. Res., 99(D5), 10 807–10 812, 1994.
Tammet, H.: The aspiration method for the determination of atmo-spheric ion-spectra, IPST for NSF, p. 208, 1970.
Tammet, H.: Size and mobility of nanometer particles, clusters and ions, J. Aerosol Sci., 26, 459–475, 1995.
Tammet, H.: Balanced Scanning Mobility Analyser, BSMA, in: Nucleation and Atmospheric Aerosols 2004: 16th International Conference, edited by: Kasahara, M. and Kulmala, M., pp. 294– 297, 2004.
Tammet, H.: Continuous scanning of the mobility and size distribution of charged clusters and nanometer parti-cles in atmospheric air and the Balanced Scanning Mo-bility Analyzer BSMA, Atmos. Res., 82(3–4), 523–535, doi:10.1016/j.atmosres.2006.02.009, 2006.
Vahtera, H., Muukkonen, P., M¨annynsalo, J., and Lahti, K.: Van-taanjoen yhteistarkkailu: Vedenlaatu vuosina 2000–2004, 56, Vantaanjoen ja Helsingin seudun vesiensuojeluyhdistys ry, 2005. Vostrikov, A. A., Drozdov, S. V., Rudnev, V. S., and Kurkina, L. I.: Molecular dynamics study of neutral and charged wa-ter cluswa-ters, Computational Mawa-terials Science, 35(3), 254–260, doi:10.1016/j.commatsci.2004.12.073, 2006.
Znamenskiy, V., Marginean, I., and Vertes, A.: Solvated ion evap-oration from charged water nanodroplets, J. Phys. Chem., 107, 7406–7412, 2003.
Znamenskiy, V., Marginean, I., and Vertes, A.: Molecular dynam-ics study of neutral and charged water clusters, Computational Materials Science, 35, 254–260, 2006.
![Table 1. Basic characteristics of the two observation days. 11 November 2005 18 November 2005 Median T [ ◦ C] 9.8 0.8 Median RH [%] 76.5 71.0 Water flow m 3 s − 1 10.9 22.8 N tot (ref) [cm − 3 ] 19 978 24 649](https://thumb-eu.123doks.com/thumbv2/123doknet/14544187.535946/4.892.146.748.122.819/table-basic-characteristics-observation-november-november-median-median.webp)