HAL Id: hal-01276842
https://hal.univ-lorraine.fr/hal-01276842
Submitted on 5 Aug 2016
HAL is a multi-disciplinary open access archive for the deposit and dissemination of sci-entific research documents, whether they are pub-lished or not. The documents may come from teaching and research institutions in France or
L’archive ouverte pluridisciplinaire HAL, est destinée au dépôt et à la diffusion de documents scientifiques de niveau recherche, publiés ou non, émanant des établissements d’enseignement et de recherche français ou étrangers, des laboratoires
3D geomodelling combining implicit surfaces and
Voronoi-based remeshing: A case study in the Lorraine
Coal Basin (France)
Pauline Collon, Wendy Steckiewicz-Laurent, Jeanne Pellerin, Gautier Laurent,
Guillaume Caumon, Guillaume Reichart, Laurent Vaute
To cite this version:
Pauline Collon, Wendy Steckiewicz-Laurent, Jeanne Pellerin, Gautier Laurent, Guillaume Caumon, et al.. 3D geomodelling combining implicit surfaces and Voronoi-based remeshing: A case study in the Lorraine Coal Basin (France). Computers & Geosciences, Elsevier, 2015, 77, pp.29-43. �10.1016/j.cageo.2015.01.009�. �hal-01276842�
To cite this work :
Collon P., Steckiewicz-laurent W., Pellerin J., Gautier L., Caumon G., Reichart G., Vaute L. (2015). 3D geomodelling combining implicit surfaces and Voronoi-based remeshing : A case study in the Lorraine Coal Basin (France). Computers & Geosciences, 77(0), 29−43.
DOI: 10.1016/ j.cageo.2015.01.009
3D geomodelling combining implicit surfaces and Voronoi-based
remeshing: A case study in the Lorraine Coal Basin (France).
Pauline Collona, Wendy Steckiewicz-Laurenta,b, Jeanne Pellerina, Gautier Laurenta,c, Guillaume Caumona, Guillaume Reicharta,b, Laurent Vauteb
a
GeoRessources UMR7359, Universit´e de Lorraine, CNRS, CREGU,
ENSG, 2 rue du doyen Marcel Roubault, TSA 70605, 54518 Vandœuvre-l`es-Nancy Cedex, France
b
BRGM, 1 avenue du Parc de Brabois, 54500 Vandoeuvre-l`es-Nancy, France
cnow at: School of Earth, Atmosphere and Environment, Monash University, PO Box 28E, Victoria,
Australia
Abstract
In this paper we demonstrate how recent geomodelling techniques can be combined and used to build a 3D geological model on a real case study: the former coal mine of Merlebach (France), that is targeted to be exploited for low-temperature geothermal energy production. From geological maps, cross-sections, borehole and mine exploitation data, we build a 3D model in which are identified the rocks and infrastructures having significantly different permeabilities. First, a structural model of the main geological interfaces in our area of interest (2 horizons and 13 faults) is built with classical geomodelling techniques. Then, we propose to model by surfaces the 71 irregularly stacked, very close and very thin, sub-vertical coal beds. To ease their construction, we use an implicit method which represents 3D surfaces as isovalues of a scalar field defined in a 3D tetrahedral grid of the area. The corresponding triangulated surfaces are remeshed with a recently proposed method based on Voronoi diagrams so that the exploited parts of the coal beds, now filled by sand, can be computed. The 3D surface-based geological model, in which infrastructures can be inserted as piecewise lines, can be volumetrically meshed. It is available for download as supplemental material, as well as a volumetric grid.
Keywords: Geomodelling, 3D surface-based model, Implicit modelling, Surface remeshing, Post-mining, Geothermics.
1. Introduction
Lorraine has been one of the most important regions of coal extraction in France until the closure of the last coal mine, La Houve, in 2004. Unlike the neighbouring Lorraine Iron Basin where the impact of mine flooding on water quality is studied for water supply concerns (e.g.Collon et al.,2005,2006;Hamm et al.,2008), the great depth (up to 1.5km) and the favourable local geothermal gradient (around 3.5◦C/100m) in the Lorraine Coal Basin make it a potential resource of low-temperature geothermal energy. Preliminary in-vestigations were carried out byHamm and Bazargan Sabet(2010), who identified the area of the Merlebach mine, centred around the Vouters 2 mineshaft (Figure 1), as the most suitable place for a future full-scale demonstration facility. As suggested by Renz et al.
(2009), Hamm and Bazargan Sabet (2010) realised a simplified model of the Merlebach
mine to investigate the geothermal potential of the site. Their encouraging results have demonstrated that the heat production capacity would not only depend on the well loca-tions and production rates, but also highly on the rock permeabilities and on the geometry of the underground structures. Thus, modelling the hydraulic and thermal behaviour of the targeted geothermal site is crucial for a reliable evaluation of different exploitation scenarios.
For this purpose, we built a volumetric 3D model of the Merlebach mine. 3D geomod-elling of formerly mined areas is a challenging task as data are often scattered, in various formats and the objects to represent are numerous and variable in shape and size (e.g.
Li et al., 2013; Kaufmann and Martin, 2008). Our model should distinguish the different
types of rock encountered in the former mine so that the permeability field, that drives groundwater flow, can be correctly modelled. So it must take account for the main mine infrastructures (galleries, mineshafts and ramps), for the surrounding formations and the
[email protected] (Gautier Laurent), [email protected] (Guillaume Caumon), [email protected] (Guillaume Reichart), [email protected] (Laurent Vaute)
GERMANY FRANCE Studiedgarea N Forbach Merlebach Saarbrücken Deep mineshafts (>800gm) Exploited areas Fault border 2 km Saint-Nicolasgfaul t Hombo urggfault Hombo urggfault Wendel Concession Houve Concession
Sarre and Moselle Concession
Figure 1: Location of the Lorraine Coal Basin and map of the exploited areas. The studied zone of the Merlebach mine is surrounded by several faults, among which the Saint-Nicolas fault in the north and the Hombourg fault in the west. This map was realised with data provided by Charbonnage de France.
faults. The modelling of the coal beds is particularly challenging as they are sub-vertical, very thin (around 5m thick), and irregularly stacked on a thickness of 1.8km. Classical geomodelling methods (Caumon et al.,2009) would imply to explicitly build each of these surfaces individually while ensuring that they do not intersect. To overcome this particu-larly difficult task, we used recent geomodelling techniques: an implicit modelling approach (Frank et al.,2007;Caumon et al.,2013) and a geological surface remeshing (Pellerin et al.,
2014).
The available data were first processed and imported into the software (Section 3.1). The adopted strategy to model the different objects is presented in Section 3.2. First, we
built a model of the interfaces between the different rock lithologies in our zone of interest (faults, horizons, topography) (Section3.3). Second, the surfaces corresponding to the 71 coal beds referenced in the mine and the digitised infrastructures were added to this struc-tural model (Section3.4). Third, the resulting surface-based model was finally rasterised to obtain a 3D regular Cartesian grid in which exploited coal, unexploited coal, infrastruc-tures, and surrounding formations are identified. This grid has less than 135 million cells, the maximum number allowed by the groundwater modelling software (MARTHE1) chosen to simulate flows in the continuity of the work ofHamm and Bazargan Sabet (2010). We discuss the workflow in Section4.
2. Settings
2.1. Geological Settings
The Lorraine Coal Basin (LCB), 140km by 70-80km, is located in the Moselle depart-ment, in the east of France, on the edge of the Paris basin (Figure1). It starts 30 km north of Metz and extends toward the north across the Franco-German border. The exploitation, that concerned the shallowest north-eastern part of the basin, has been subdivided into three sectors : i) the Wendel concession, ii) the Houve concession, and iii) the Sarre and Moselle concession. The Merlebach mine is part of the Sarre and Moselle concession. The studied area has an extension of about 7.5km by 2.2km (Figure1).
The LCB is an intra-mountain coal depression formed during the Hercynian Orogeny between Carboniferous and Permian (Donsimoni, 1981) and interpreted as a strike-slip basin (Korsch and Sch¨afer, 1995; Izart et al., 2005). This context has favoured organic matter-rich clastic deposits. The anaerobic decomposition of organic matter in water has produced the coal bearing deposits of the Westphalian and Stephanian age (Carboniferous - equivalent of the Pennsylvanian age in ICS-stage) (e.g. Izart et al.,2005). They consist
Figure 2: West-East general cross-section of the Lorraine Coal Basin. The coal exploitations of Merlebach are east of the Hombourg fault, just above the Reumaux well (modified fromCartannaz(2008)).
of intercalated beds in a complex sequence of claystones, sandstones, and conglomerates that show lateral variations both in term of nature and thickness. Coal beds generally have a thickness between a few centimetres and 5m, reaching exceptionally 15m. The late Hercynian compression (Saalian phase) has affected all deposits inducing the formation of a North-East/South-West, asymmetrical, and overturned anticline and of numerous faults
(Donsimoni, 1981; Fleck et al., 2001; Barchi et al., 2008; Cartannaz, 2008). The most
important faults bind mining zones, as the NE/SW Hombourg fault and the W-NW/E-SE Saint-Nicolas fault (Figure1). In this basin, folds can be interpreted as fault-propagation folds characterised by the progressive tightening of the fold hinge and a steepening of the front limb (Averbuch, pers. com.). Upper Permio-Triassic conglomerates unconformably cover these units (Figure2) (Donsimoni,1981;Barchi et al.,2008;Cartannaz,2008).
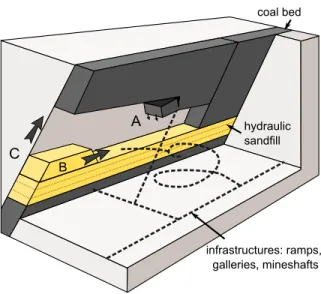
infrastructures: ramps, galleries, mineshafts coal bed hydraulic sandfill A B C
Figure 3: Cut-and-fill mining technique (modified fromHamrin (1997)). Extraction starts at the lowest level and goes up while hydraulically filling the exploited volumes with sand. A: coal blocks are extracted at the roof; B: voids are filled with sand; C: exploitation goes up.
2.2. Mining exploitation
The studied area corresponds to a small part of the eastern limb of the regional Mer-lebach anticline. Coal beds are globally striking 38◦N and are sub-vertical, their dips varying between 60◦SE and 90◦. Coal was exploited at depths ranging from 150m to 1250m with a cut-and-fill technique where extraction starts at the lowest level and goes up while hydraulically filling the exploited volumes with sand (Figure 3). The consequence is that these exploited volumes have a high hydraulic conductivity that should strongly influence the underground water flows and must be distinguished in our model from the unexploited parts of the coal beds that have a lower permeability.
The infrastructures developed for this exploitation consist of a network of intercon-nected sub-horizontal galleries linked by vertical pipes (Hamm and Bazargan Sabet,2010). Fifty-eight mineshafts were bored, of which three are still accessible: Vouters 2, Marienau, and Simon 5 (Figure1). These infrastructures were left as they were and are now under-ground voids that drain fluid flows and must be integrated in our model of the area.
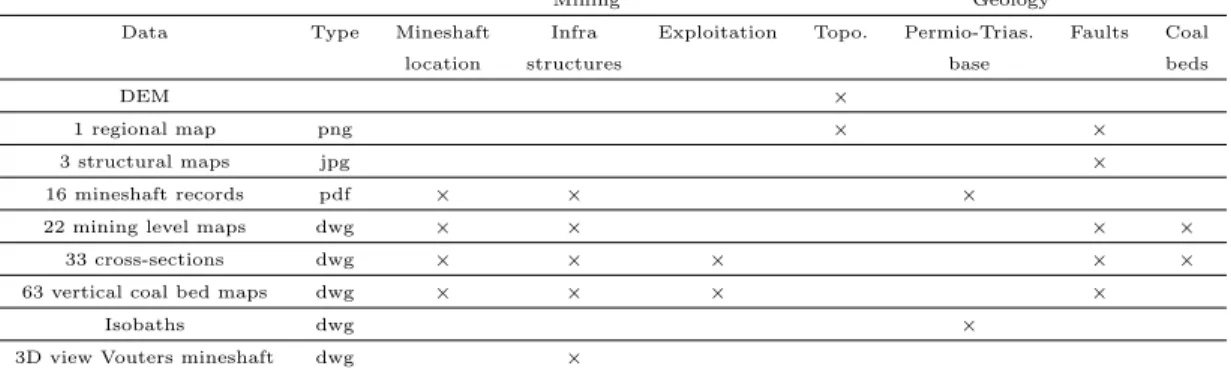
Mining Geology
Data Type Mineshaft Infra Exploitation Topo. Permio-Trias. Faults Coal
location structures base beds
DEM ×
1 regional map png × ×
3 structural maps jpg ×
16 mineshaft records pdf × × ×
22 mining level maps dwg × × × ×
33 cross-sections dwg × × × × ×
63 vertical coal bed maps dwg × × × ×
Isobaths dwg ×
3D view Vouters mineshaft dwg ×
Table 1: Information provided by the various data sources.
2.3. Geological and infrastructure data
Charbonnage de France has managed the mines until 2004 and part of its employees are now working for the BRGM in UTAM-Est (Post-Mining Territorial Unit) at Freyming-Merlebach. They provided us with a large amount of data collected through the mine lifetime (Table1), most of it being provided as DraWinG (DWG) documents generated by AutoCAD2. Their preparation and processing represent a significant part of this work.
Digital Elevation Model. Provided by IGN, the French National Institute of Geographical Information, the Digital Elevation Model (DEM) has a 50m horizontal resolution and around a one meter vertical precision. In the zone of interest, elevation ranges between 148 and 343m FOD (French Original Datum).
Regional geological map. The regional geological map gives very little information on the studied zone below the Permio-Triassic unit. It provides essentially data on the fault network.
Three structural maps. Three interpretative maps, that represent the structures at the surface, at 400m and 1500m depth, have been used for 3D fault network construction.
2
One map of the isobaths of the Permio-Triassic sandstone base horizon. Provided by Char-bonnage de France, this map was the result of a geological study lead byDonsimoni(1981). It gives interpretative contour lines of the Permio-Triassic base horizon which is the top horizon of the coal-bearing formation. It gathers various data collected during the exploita-tion, but only covers the southwestern part of our zone of interest.
Sixteen mineshaft records. They refer to the well locations, the geological logs, the inter-sected gallery depths, the initial external water level (with its year of measure), technical well information, and the current state of the structure (closed, opened, etc.). Globally, well logs are very succinct and only three geological layers are identified: lower Triassic sandstones, Permian sandstones and the Carboniferous coal-bearing formation.
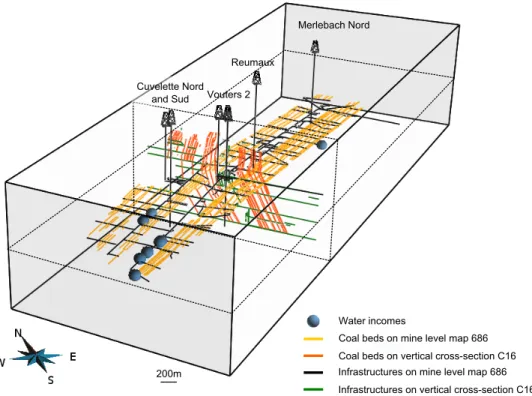
Twenty two mining level maps and thirty three NW-SE cross-sections. The horizontal min-ing level maps give the exact location of the galleries, the mineshafts and the faults. They are indexed by their depth value. The vertical cross-sections are perpendicular to the coal beds. They give information on the traces of coal beds, intersected infrastructures and faults in a vertical section and are thus complementary to the mining level maps (Fig-ure4). They are located on horizontal mining level map #686 (686m depth).
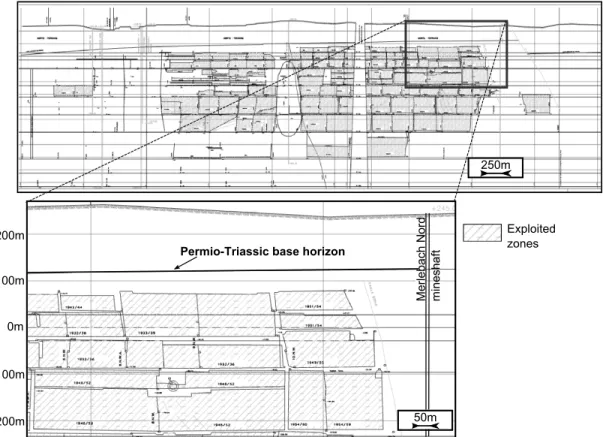
Sixty three exploited vertical coal bed maps. They result from the projection of the exploited zones of the non-planar coal beds on vertical planar surfaces (Figure5). They map zones that have been exploited and filled by sand. They need to be clearly identified in our model for they may act as drains. Because of gaps in these maps, the contours of the exploited zones were hand picked.
3D view of the infrastructures around the Vouters mineshaft. This image gives information on the infrastructures connecting the different mining levels (Figure6).
Coalhbedshonhminehlevelhmaph686 Coalhbedshonhverticalhcross-sectionhC16 Infrastructureshonhminehlevelhmaph686 Infrastructureshonhverticalhcross-sectionhC16 CuvelettehNordh andhSud Voutersh2 Reumaux MerlebachhNord 200m Waterhincomes
Figure 4: 3D view of the information provided by the reference mining level map #686 (686m depth) and the C16 cross-section (data from Charbonnage de France).
Merl ebach Nor d minesh aft 50m 250m Exploited zones 0m 100m 200m -100m -200m
Permio-Triassic base horizon
Figure 5: One of the 63 exploited vertical coal bed maps from which sand filled exploited areas are deter-mined.
3. Geological model building
The global workflow consists of three main steps (Figure 7). After data preparation, a surface-based model is built. It calls for various techniques to manage the modelling of the topographic surface, the faults, the Permio-Triassic base horizon, the coal beds (exploited or not), and the infrastructures. The third and final step is the rasterisation of the surface-based model into a 3D grid adequate for the flow simulator chosen for future investigations.
Cuvelette Nord mineshaft Vouters 2 mineshaft 686m 1038m 1250m
Figure 6: 3D view of the infrastructures around Vouters mineshaft (data from Charbonnage de France, modified fromHamm and Bazargan Sabet(2010)).
DATAUPREPARATION Topography Faults CoalUbeds Direct2triangulation RASTERISATION Triangulated2surfaces2 extraction2y2remeshing 20 10 GEOLOGICALUMODELUBUILDING Permio-Trias Sandstones Coal2bed s Faults Geological2model2+2digitised2infrastructures22 2 Volumetric2grid22 12 13.1 13.6 Perm. Sandst. Void Fault Coal Triangulated2surface2fitting2 Triangulated2surface2fitting2 Permio-Triassic baseUhorizon Implicit2property2fitting Minesh aft
3.1. Data Preparation
After converting the DWG files in DXF format, all data were imported into the Gocad geomodelling software. To ensure their spatial consistency, they first had to be georefer-enced. The chosen coordinate system is the Lambert 1 (NTF) in the French coordinate sys-tem datum. To consistently georeference X-Y mining level maps whose depth is known, the mineshafts coordinates were used as points of reference. Mining level map #686 localises the thirty three cross-sections. It permits to accurately georeference each cross-section by combining them with the information about the infrastructures and coal beds on the other level maps (Figure4). From the 3D view, oblique ramps and infrastructures are digi-tised by hand into piecewise linear curves. Combined with the galleries extracted from the mining level maps, they constitute a complete network of infrastructures (Figure 8). The exploited vertical coal bed maps are georeferenced on the vertical planes passing through the corresponding traces on mining level map #686. It was necessary to hand pick contours of exploited parts because of gaps in the input data.
Resulting from a long exploitation history, 107 different coal bed names are used on cross-sections and mining level maps. These names are either simple numbers (e.g. “27”, “10A”) or first names (e.g. “Irma”, “Henriette”). However, a careful quality check of data consistency in 3D shows that some of these names obviously refer to the same coal bed (or to two beds closer than 2m that could be confused). As a result, we identified only 71 different coal beds that will have to be represented in the final model. Correspondence with input data is given inAppendix A.
3.2. Modelling choices
The different volumes to distinguish in the model are: the sandstones surrounding the coal beds, the Permio-Triassic cover, the non-exploited parts of the coal beds, the exploited parts of the coal beds, and the mining infrastructures. Infrastructures are modelled by the lines obtained from digitising available data and are not further modified. Coal beds are
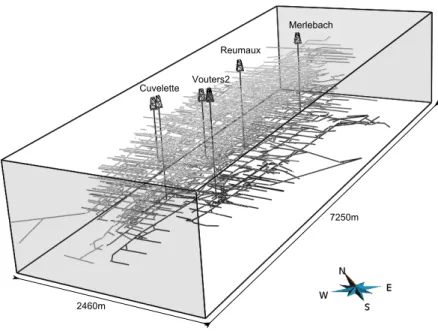
7250m 2460m Merlebach Reumaux Vouters2 Cuvelette
Figure 8: 3D view of the complete infrastructure network determined from the processing of the 22 mining level maps, 33 cross-sections, 16 mineshaft records, and the 3D view around Vouters 2. Infrastructures are represented by 3586 piecewise linear curves.
very thin and could be modelled as surfaces. Sandstones and Permio-Triassic layers are thick layers present throughout the area of interest, hence should be represented as volumes. To model volumetric layers, it is particularly convenient to represent them by their boundary surfaces, i.e. the horizons and faults delimiting them, which are generally trian-gulated. This kind of representation is called a surface-based structural model. Caumon
et al. (2009) give a review of ways to manage its building. Around the Merlebach mine,
several faults cut the layers, the Permio-Triassic formation is delimited by the topography and by the unconformity underlying the Permio-Triassic units. After building the struc-tural model of the area from these surfaces (Section3.3), we built the coal beds surfaces, then the identified exploited parts (Section 3.4).
3.3. Structural model
To better constrain the construction of the structural model and ensure its consistency with data around the exact zone of interest, that is the Merlebach mine, we build it for a larger area comprising 13 faults. This model of the main subsurface discontinuities is built with classical geomodelling approaches, also called explicit approaches, that consist in building surfaces that fit available data. Surfaces are built one by one in an order that has to be carefully thought, and their consistency must be carefully checked, both points requiring time and expertise in complex cases (Caumon et al.,2009).
Two main approaches can be used to build explicitly surfaces, the direct triangulation of data points and the indirect surface construction. The first is particularly adapted to regularly distributed points like a DEM, and is used here to build the topographic surface (Figure 7). The indirect approach is more robust to deal with irregular, scarce, noisy data, such as those available for the thirteen faults or the Permio-Triassic base horizon. It consists in deforming a surface so as to minimise the distance between the surface and the data points. Several interpolation methods can be used (e.g., Haecker, 1992; Kaven
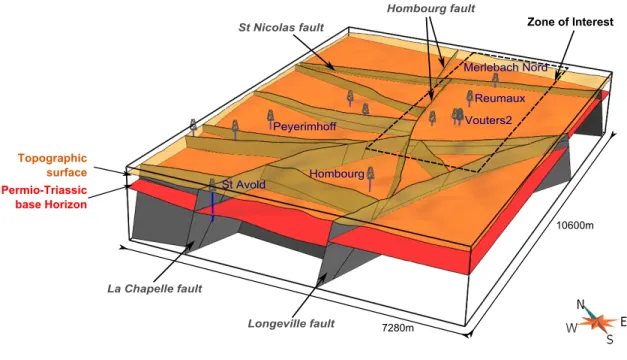
Hombourg fault St Nicolas fault La Chapelle fault Longeville fault Merlebach6Nord Reumaux Vouters2 Hombourg Peyerimhoff St6Avold 10600m 7280m Topographic surface Permio-Triassic base Horizon Zone of Interest
Figure 9: Surface-based structural model of the extended zone of interest.
data misfit in the least squares sense (Mallet, 1992, 2002). Some of the data are exactly respected by inserting the data points into the mesh (e.g. well markers), while less reliable data are only honoured to a degree chosen by the user (e.g. isobath curves, interpretative cross-sections) (Figure7).
The faults were built one after another from their traces on the geological map, on the three structural maps and on the cross-sections. Following the methodology presented in the teacher’s aide of Caumon et al.(2009), the fault network consistency was ensured by a complete check of all fault branch lines, older faults being cut by younger ones. Then, well markers provided on mineshaft indexes, isobath curves (southwestern part) and cross-sections were used as data point constraint to built the Permio-Triassic bottom surface. This surface was cut by the faults before interpolation in order to disconnect fault blocks. The obtained surface structural model is shown in Figure9.
3.4. Coal bed surfaces
The construction of the 71 coal bed surfaces was particularly challenging because they are sub-vertical, are generally distant from 5 to 10m, have an extension of 10.2km by 1.3km, and are irregularly stacked on a width of 1.8km. We used recently developed techniques to achieve this goal.
3.4.1. Implicit coal bed construction
Implicit approaches consider geological interfaces as isovalues of a 3D scalar field f (x, y, z). This scalar field is interpolated from the data with either continuous interpolation schemes, such as radial basis function or dual kriging (Carr et al.,2001;Chil`es et al.,2004), or discrete interpolation schemes (Moyen et al.,2004;Frank et al.,2007;Caumon et al.,2013). With the discrete approach, the scalar field is defined by a piece-wise linear interpolation of the values stored at the vertices of a volumetric mesh. In the implementation used here (
Cau-mon et al.,2007,2013), the values at the vertices are obtained by an optimisation method
that consists in minimising a weighted sum of various constraints including the data misfit. This method has the advantage to ease interactive editing. Moreover, dual kriging and radial basis function methods seem limited by the amount of information points. In both approaches, once the scalar field is calculated, any surface can be explicitly constructed by extracting the corresponding isovalue surface (Figure 7). The two crucial advantages of implicit modelling as compared to explicit approaches are that implicit methods provide some built-in model consistency rules preventing the occurrence of overlapping or leaking layers and that they do not rely on data-to-surface projections, making them particularly suitable to generate stack of surfaces, like the coal beds discussed in this paper.
We use the implicit method implemented in the Gocad research plugin StructuralLab
(Caumon et al., 2007, 2013) which requires a tetrahedral mesh of the volume of interest
conformable to the triangulated fault surfaces. Conformable means that tetrahedron facets that are located on one fault are the same triangles than the ones meshing the fault
considered. We generated a tetrahedral isotropic mesh with the Delaunay-based tessellation package provided in the Gocad-Skua software. The mesh is made of 673,916 tetrahedra corresponding to a 72m average tetrahedra edge length. This length was chosen to be consistent with the fault surface mesh size (around 85m). Eight fault blocks are defined in our zone of interest (Figure10-a). The Permio-Triassic base horizon, eroding the coal bearing formation and thus constituting a top boundary, is not accounted for in the mesh because it is sufficient to cut the coal beds by that surface afterwards. This facilitates the mesh generation step and further updates of the Permio-Triassic base horizon since otherwise the whole model would have to be rebuilt.
To compute the scalar field, two constraints are used: i) a value of the scalar field that is attached to each set of lines corresponding to the same coal bed ii) constraints on the gradient of the scalar field so that it is orthogonal to the coal bed lines and has a constant norm, to be consistent with the more or less parallel coal beds. This last constraint is particularly useful to interpolate the scalar field where there are few data (in the northern and southern parts). Values assigned to the coal beds have to be consistent with this constant norm, i.e. they must evolve proportionally to the inter-bed distances. For that purpose, appropriate values have been computed for each coal bed, started with the value of 2 for the first one. The value of the scalar field associated to each of the other coal beds was computed by adding its average distance to the reference coal bed. In that way, the last modelled coal bed was assigned a value of 1335 (Figure10-b andAppendix A). The 3D scalar field is then interpolated in each fault block with DSI (Mallet,2002) giving more weight to the line point constraint (1) than to the gradient constraint (0.5), thus giving priority to data while preserving global consistency far from them. In this process, the modelling process does not make any hypothesis on cylindricity of the regional fold and thicknesses vary when data indicate so. The resulting scalar field is shown on Figure10-c.
1 1335 ScalarhFieldhValue Merlebach Nord Reumaux Cuvelette Vouters 7250m 2460m Merlebach Nord Reumaux Cuvelette Vouters b) Input data: Lineshpickedhonhcross-sections 31,245hnodesharehusedhashconstraintsh forhthehscalarhfieldhcomputation c)hContinuoushscalarhfieldh modelhofhcoalhbedhstratigraphy Merlebach Nord Reumaux Cuvelette Vouters d) Result: 71hsurfaceshmodellinghthehcoalhbedsh )ignoringhaboveherosionalhunconformityT a) Input: Tetrahedralhmeshhconformablehtohtheh7hfaults. Eachhcolorhindicateshahfaulthblock. Merlebach Nord Reumaux Cuvelette Vouters
3.4.2. Coal bed surface remeshing
The isosurfaces of the computed volumetric property represent the coal beds (Figure10 -c). However, it is difficult to visualise or compute geometrical properties for such surfaces, and in our case, to determine the exploited and unexploited zones of the coal beds. So, we need to convert these implicitly represented surfaces into explicit surfaces (e.g. tri-angulated surfaces) which we can use for further geometrical computations. The desired triangular mesh should correctly approximate the implicit surfaces with a minimal number of elements, in particular there should be no intersection between two coal bed surfaces. This is a particularly challenging task given the very narrow space between the surfaces. To ensure the robustness of further geometrical computations, this mesh should also have a good quality, i.e. to have triangles close to equilateral. Triangle quality can be measured as Q = 6 A/(√3 hmaxp) where A is the triangle area, hmax the length of its longest edge,
and p its half-perimeter (Frey and Borouchaki,1999). The maximal value of Q is 1 and is obtained for equilateral triangles.
Triangulated surfaces are first generated from the implicit model with a marching-tetrahedra algorithm (Gueziec and Hummel, 1995). These surfaces do not intersect but the quality of their mesh is very poor (Figure11), with an average of 0.549 (see Table2for additional statistics). Moreover, they have around 2 million triangles, slowing down any computation done on these surfaces. To remesh the surfaces, i.e. adapt the resolution of the triangles and improve their quality, we used a recent surface remeshing method that is adapted to geological models (Pellerin et al.,2014).
The key ideas of this method are to use a centroidal restricted Voronoi diagram opti-misation (Du et al., 1999) to place the vertices of the output mesh, and to consider the different parts of the model to locally build the triangles of the output mesh. The main advantages of this remeshing method are that (1) it is fully automatic, (2) all surfaces are remeshed simultaneously, (3) the number of triangles in the output mesh is globally (as opposed to locally) controlled, (4) the quality of the triangles in the output mesh is very
Figure 11: Remeshing of the 71 coal bed triangulated surfaces with triangles as equilateral as possible. The input surfaces have more than 2 million triangles of very poor quality, the output surfaces have around 180,000 triangles of much better quality.
good, even if the input mesh quality is very poor.
This method is implemented in a plugin of the research modelling software Graphite 3,
which is interfaced in the geomodeller Gocad through the plugin Tweedle (Pellerin et al.,
2010). The automatic remeshing of the 71 vein surfaces was performed on a consumer PC in less than 5 minutes. The total number of triangles was divided by ten. An additional manual quality control was necessary to ensure the complete validity of the remeshed sur-faces, and remove approximately ten remaining intersections between sursur-faces, as discussed
byPellerin et al. (2014). The average output quality is 0.84686 (Figure 11 and Table2).
Finally, to identify the exploited parts of the coal beds, the boundaries of the exploited
3
Initial Remeshed # Vertices 1,084,218 100,171 # Triangles 2,097,489 179,835 Angles (deg.) Min 0.0059 2.07 Max 179.8 175.8 < 30 or > 150 (%) 21.98 1.295 Quality Min 0.00018 0.032 Average 0.55 0.85 Table 2: Evaluation of the triangulated coal bed surface remeshing
areas were horizontally projected from the exploitation vertical coal bed maps onto the corresponding coal bed surfaces. Each coal bed surface was then cut with these curves and new surfaces corresponding to the exploited coal bed parts were extracted (Figure12).
Cutting the coal beds with the Permio-Triassic horizons and combining them with the faults surfaces, we obtained a complete 3D surface geological model of the Merlebach mine (Figure13). This 3D model is available for download as additional material to this paper in Gocad text file format, which can also be loaded by the open-source Graphite software4.
3.5. Volumetric model generation
One of the prospects of this model is to perform flow simulations to characterise the fluid behaviour in the context of a potential geothermal exploitation of the abandoned mine. In the continuity of the pre-study performed byHamm and Bazargan Sabet(2010), two different strategies are currently being tested using the groundwater modelling software (MARTHE5): the classical continuum approach, in which all the voids are considered as
porous material; and the coupled approach, in which the remaining open mining structures are modelled as discrete conduits and can exchange flow with the surrounding porous material. To this purpose, a 3D regular volumetric grid has to be generated from the 3D
4
alice.loria.fr/software/graphite/
1 127
Coal bed Number Merlebach Nord
Reumaux
Cuvelette Vouters
Figure 12: Exploited parts of the 71 coal beds.
surface-based model, with a property defining the ground type on each cell. One of the main interest of representing a model by surfaces is that it can be used to generate various volumetric meshes with various mesh sizes.
The maximum number of cells that the groundwater modelling software can handle has to be considered when building this grid. Here, the MARTHE software imposes to build a grid with less than 135 million cells. We define a structured regular grid of 1275×410×240 cells. It produces a final grid that contains 125.46 millions cells of approximately 6m side. This cell size allows representing the various small structures that are present in the particular context of mine workings while keeping a reasonable number of cells considering that the zone of interest is 2.46km large for 7.25km long. Indeed, coal beds are generally distant from 5 to 10 meters and their average thickness, as well as the diameter of the underground galleries, is around 5 meters, which is of the same size order than cells.
A discrete property defines the ground type with the following values: 1 for the the Permio-Triassic formations, 2 for the sandstones, 3 for the unexploited coal beds, 4 for the exploited coal beds now filled with sand, 5 for the infrastructures (i.e. voids) and 6 for
Merlebach Nord Reumaux Cuvelette Vouters Hombourg fault St Nicolas fault Topographical surface Permio-Triassic base Horizon 7250m 2460m
Volume (in 107m3)
Permio-Triassic 416.56 Sandstones 1,625.81 Coal beds (unexploited) 286.71 Sand filled exploited coal 36.48 Voids (infrastructures) 2.06
Faults 8.02
Table 3: Volumes computed on a Cartesian volumetric grid of 125 million cells of 6m side.
the faults (Figure 14). Regions have been defined for each discrete property allowing to compute the corresponding volumes (Table3). The resulting grid is available for download as additional material to this paper in Gocad text file format.
4. Discussion
The resulting volumetric grid fits the specification of the flow simulator: a Cartesian grid with less than 135 millions cells containing the required information to later impose appropriate permeability values for flow simulations. Of course these specifications have drawbacks. Cell dimension could have been reduced to 5m (the average infrastructure diameter) but there would have been about 216.8 millions of cells (1530 × 492 × 288). This number of cells can be handled by other flow simulators like GMS-Modflow6 which
authorises up to 300 millions of cells (1 millions per layer and 300 layers7). Like MARTHE, it uses Cartesian grids that may involve aliasing problems when the modelled objects are not aligned with the grid, e.g. stair steps geometries or inappropriately corner-connected cells. One solution would be to take this into account when assigning permeability properties as done in classical upscaling process (e.g. Karim and Krabbenhoft, 2010). Another solution would be to use a different flow simulation software that is based on the more flexible
6
http://www.aquaveo.com/software/gms-groundwater-modelling-system-introduction 7
14-4Permio-Triassic4barren Merlebach4Nord Reumaux Cuvelette Vouters 7250m 2460m 04-4Above4ground 34-4Coal4beds 44-4Sand4filled4exploited4coal 54-4Voids4(infrastructures) 64-4Faults 24-4Sandstones Cuvelette Vouters42
Figure 14: Slices in the 3D regular Cartesian volumetric grid of the Vouters 2 mining area. The grid contains about 125 million cubic cells of 6m side.
unstructured meshes. The crucial advantage of the workflow presented in this paper is that we did not directly build the final grid but produced an intermediate 3D-surface-based model that does not depend on this grid. Various volumetric meshes can be generated from this surface model (similar to the boundary represented or B-Rep model used in CAD) like stratigraphic or tartan grids (Cartesian grids with an adaptive mesh resolution).
Naturally, the precision/accuracy of the model is strongly linked to the quality of the data. In the used data set, uncertainties due to positioning and resolution are considered as not really significant. However, 2D maps propose fault traces which are not always consistent when placed in three dimensions (i.e., fault lines corresponding to the same surface may induce unrealistic curvature, or may simply be missing on some 2D sections). The least-squares interpolation and the rasterisation of objects in the grid tends to mitigate these inconsistencies when the discrepancy is of the same order of magnitude as the grid resolution. Locally, larger differences exist between input fault traces but they are always outside of the target area for geothermal exploitation, hence should not have much impact on the simulation results. Nevertheless, more rigorous uncertainty assessment still remains a possible way to improve this work.
In this paper, we showed how a geomodelling software can be used to integrate various data into a unique and consistent geological three dimensional model. The proposed com-bination of methods is the key point to achieve such a task since a conventional explicit approach would not have allowed us to create the 71 sub-vertical coal beds so easily while honouring data and geological consistency. In such context where surfaces have a kilomet-ric extent but have a metkilomet-ric inter-distance, frequent cross-overs occur unless the mesh is refined and the complete process requires an important manual quality control. This study demonstrates the potential of the implicit modelling package we have usedCaumon et al.
(2007, 2013) in a real case study with a relatively dense data set. The efficient surface remeshing method proposed by Pellerin et al. (2014) was a very complementary tool to improve the quality and adapt the number of triangles of the triangulated surfaces obtained
with the implicit approach. During this work, hundreds of surfaces and thousands of curves have been created and manipulated. Efficiency in the repetitive tasks was possible thanks to a recently developed Gocad plugin, Gopy (Antoine and Caumon, 2008), that permits to script Gocad commands in Python. It was used for simple operations such as global renaming of surfaces or curves, but also for more complex tasks: (i) to create and initialise new properties given an existing one, e.g. for the scalar field value given the coal bed ID; (ii) to extract the 71 surfaces given the corresponding list of isovalues; (iii) to project and extract the exploited parts from the 63 exploited coal bed surfaces; (iv) to control the quality of initial data by creating groups of curves depending on their names or property values.
Conclusion
To conclude, this paper presents an efficient workflow to build a volumetric geomodel in a post-mining context using recent geomodelling tools. The modelling of the coal beds represents the principal challenge of this paper due to their proximity and intimately-related geometry. This paper demonstrates that this hurdle is overturned when using appropriate tools: (1) discrete implicit modelling for the interpolation of geological data
(Caumon et al., 2007,2013), coupled with (2) a variational remeshing tool for geological
surfaces (Pellerin et al.,2014), and (3) serial processing with scripts (Antoine and Caumon,
2008). This paper also illustrates how implicit and explicit approaches are complementary. We take full advantage of the strength of both methods: using implicit surfaces while building the vein surfaces and going back to the explicit scheme when accurate geometry processing is required. As a result of this study, two 3D models are proposed for download as supplemental material: the 3D surface-based model and a volumetric grid.
Perspectives of these work reside on the flow simulation aspects that will focus on the geothermal potential of the site. These simulations, planned for the next years, would also benefit from the in-situ monitoring of temperature and conductivity that is currently
performed in the accessible mineshaft of Vouters 2.
Acknowledgements
We thank the BRGM (French Geological Survey) and Charbonnage de France for pro-viding us initial data and authorising us to publish them. We also thank the industrial and academic members of the Gocad Consortium managed by the ASGA (Association Sci-entifique pour la G´eologie et ses Applications), INRIA- Alice team for providing some of the algorithms used in the surface remeshing and Paradigm for providing the Gocad Soft-ware and API. Both reviewers, Olivier Kaufmann and Andrea Zanchi are thanked for their constructive remarks that helped improve this manuscript. Wendy Steckiewicz-Laurent built a first version of the model during her final year project at the Nancy School of Ge-ology (ENSG) based on a preliminary regional model built by Marie Sallilas-Sorrosal and Adeline Moignard during short internships. This work was performed in the frame of the “Investissements d’avenir” Labex RESSOURCES21 (ANR-10-LABX-21).
References
References
Antoine, C., Caumon, G., 2008. Rapid algorithm prototyping in Gocad using Python plugin. In: Proc. 28th Gocad Meeting, Nancy. p. 4.
Barchi, P., Cartannaz, C., Fourniguet, G., 2008. Projet Minewater - G´eologie du bassin houiller lorrain et potentialit´e g´eothermique BRGM/RP-56096-FR. Tech. rep., BRGM.
Carr, J. C., Beatson, R. K., Cherrie, J. B., Mitchell, T. J., Fright, W. R., McCallum, B. C., Evans, T. R., 2001. Reconstruction and representation of 3D objects with radial basis functions. In: SIGGRAPH ’01: Proceedings of the 28th annual conference on Computer graphics and interactive techniques. ACM, New York, NY, USA, pp. 67–76.
Cartannaz, C., 2008. “MINEWATER” PROJECT. Geology of the mine reservoir of the Lorraine Coal Basin Vouters 2 and Simon 5 shafts (Scale Analysis). BRGM/RP-56257-GB. Tech. rep., BRGM.
Caumon, G., Antoine, C., Tertois, A.-L., 2007. Building 3D geological surfaces from field data using implicit surfaces. In: Proc. 27th Gocad Meeting, Nancy. p. 6.
Caumon, G., Collon-Drouaillet, P., Le Carlier de Veslud, C., Viseur, S., Sausse, J., Sep. 2009. Surface-Based 3D Modeling of Geological Structures. Mathematical Geosciences 41 (8), 927–945.
Caumon, G., Gray, G., Antoine, C., Titeux, M.-O., Mar. 2013. Three-Dimensional Im-plicit Stratigraphic Model Building From Remote Sensing Data on Tetrahedral Meshes: Theory and Application to a Regional Model of La Popa Basin, NE Mexico. IEEE Trans-actions on Geoscience and Remote Sensing 51 (3), 1613–1621.
Chil`es, J.-P., Aug, C., Guillen, A., Lees, T., 2004. Modelling the Geometry of Geological Units and its Uncertainty in 3D From Structural Data: The Potential-Field Method. In: Proc. Orebody Modelling and Strategic Mine Planning. pp. 313–320.
Collon, P., Fabriol, R., Bu`es, M., 2005. Evolution of water quality in the abandoned iron mines of Lorraine: towards a semi-distributed modelling approach. Comptes Rendus Geosciences 337 (16), 1492–1499.
Collon, P., Fabriol, R., Bu`es, M., 2006. Modelling the evolution of water quality in aban-doned mines of the Lorraine Iron Basin. Journal of Hydrology 328 (3-4), 620–634.
Donsimoni, M., 1981. Le Bassin houiller Lorrain. Synth`ese g´eologique. Tech. rep., M´em. BRGM, 117.
Du, Q., Faber, V., Gunzburger, M., 1999. Centroidal Voronoi Tessellations: Applications and algorithms. SIAM Review 41 (4), 637–676.
Fleck, S., Michels, R., Izart, A., Elie, M., Landais, P., Dec. 2001. Palaeoenvironmental assessment of Westphalian fluvio-lacustrine deposits of Lorraine (France) using a combi-nation of organic geochemistry and sedimentology. Intercombi-national Journal of Coal Geology 48 (1-2), 65–88.
Frank, T., Tertois, A.-L., Mallet, J.-L., 2007. 3D-reconstruction of complex geological interfaces from irregularly distributed and noisy point data. Computers and Geosciences 33 (7), 932–943.
Frey, P. J., Borouchaki, H., 1999. Surface mesh quality evaluation. International Journal for Numerical Methods in Engineering 45 (1), 101–118.
Gueziec, A., Hummel, R., 1995. Exploiting triangulated surface extraction using tetrahe-dral decomposition. IEEE Transactions on Visualization and Computer Graphics 1 (4), 328–342.
Haecker, M. A., 1992. Convergent gridding: a new approach to surface reconstruction. Geobyte 7 (3), 48–53.
Hamm, V., Bazargan Sabet, B., Jun. 2010. Modelling of fluid flow and heat transfer to assess the geothermal potential of a flooded coal mine in Lorraine, France. Geothermics 39 (2), 177–186.
Hamm, V., Collon-Drouaillet, P., Fabriol, R., 2008. Two modelling approaches to water-quality simulation in a flooded iron-ore mine (Saizerais, Lorraine, France): A semi-distributed chemical reactor model and a physically based semi-distributed reactive transport pipe network model. Journal of Contaminant Hydrology 96 (1-4), 97–112.
Hamrin, H., 1997. Guide to underground Mining Methods and Applications. AB Atlas Copco.
Izart, A., Palain, C., Malartre, F., Fleck, S., Michels, R., May 2005. Paleoenvironments, paleoclimates and sequences of Westphalian deposits of Lorraine coal basin (Upper Car-boniferous, NE France). Bulletin de la Soci´et´e G´eologique de France 176 (3), 301–315.
Karim, M. R., Krabbenhoft, K., Apr. 2010. New Renormalization Schemes for Conductivity Upscaling in Heterogeneous Media. Transport in Porous Media 85 (3), 677–690.
Kaufmann, O., Martin, T., Mar. 2008. 3D geological modelling from boreholes, cross-sections and geological maps, application over former natural gas storages in coal mines. Computers & Geosciences 34 (3), 278–290.
Kaven, J., Mazzeo, R., Pollard, D., 2009. Constraining surface interpolations using elastic plate bending solutions with applications to geologic folding. Mathematical Geosciences 41 (1), 1–14.
Korsch, R., Sch¨afer, A., Jun. 1995. The Permo-Carboniferous Saar-Nahe Basin, south-west Germany and north-east France: basin formation and deformation in a strike-slip regime. Geologische Rundschau 84 (2).
Li, X., Li, P., Zhu, H., Sep. 2013. Coal seam surface modeling and updating with multi-source data integration using Bayesian Geostatistics. Engineering Geology 164, 208–221.
Mallet, J.-L., 1992. Discrete Smooth Interpolation. Computer-Aided Design 24 (4), 263– 270.
Mallet, J.-L., 2002. Geomodeling. Applied Geostatistics. Oxford University Press, New York, NY.
Moyen, R., Mallet, J.-L., Frank, T., Leflon, B., Royer, J.-J., 2004. 3D-Parameterization of the 3D geological space - The GeoChron model. In: Proc. European Conference on the Mathematics of Oil Recovery (ECMOR IX). p. 8.
Pellerin, J., L´evy, B., Caumon, G., 2010. Advanced geometry processing in Gocad using Graphite. In: Proc. 30th Gocad Meeting, Nancy. p. 8.
Pellerin, J., L´evy, B., Caumon, G., Botella, A., Jan. 2014. Automatic surface remeshing of 3D structural models at specified resolution: A method based on Voronoi diagrams. Computers & Geosciences 62, 103–116.
Renz, A., R¨uhaak, W., Sch¨atzl, P., Diersch, H.-J. G. J., Jan. 2009. Numerical Modeling of Geothermal Use of Mine Water: Challenges and Examples. Mine Water and the Environment 28 (1), 2–14.
Appendix A. List of modelled coal beds.
List of modelled coal beds: their initial names on mining maps, their number, their ID after quality control and the corresponding scalar value used for the implicit modelling.
Coal bed names on mining maps Automatic number ID Scalar field values
27 1 1 2 26 2 2 17 25A 3 3 30 25 4 4 37 24BO 5 6 43 24BE 6 24W 7 7 49 24O 8 24E 9 24 10 10 53 23 11 11 66 22 12 12 76 21A 13 13 82 21 14 14 85 20BO 15 17 99 20BE 16 20W 17 20E 18 18 102 20A 19 20 20 20 105 19A 21 22 125 19 22 18 23 23 137 17A 24 24 141 17 25 25 158 16C 26 26 168 16B 27 27 175 16A 28 28 193 16 29 29 208
Coal bed names on mining maps Automatic number ID Scalar field values 15A 30 31 245 15 31 14A 32 33 265 14 33 13A 34 35 285 13 35 12 36 36 295 11A 37 37 323 11 38 38 333 10BE 39 42 370 10W 40 10E 41 10 42 9 3 43 43 392 9 44 44 430 8 1 45 45 490 8A 46 8 47 7 3 48 47 500 7 1 49 7 50 50 510 6 1 51 52 520 6 52 5 7 53 56 535 5 2 54 5 1 55 5 56 4 2 57 59 552 4 1 58 4 59 3 4 60 62 558 3 1 61 3 62 2A 63 63 561 2O 64 2W 65 65 572 2ME 66 66 575
Coal bed names on mining maps Automatic number ID Scalar field values 1 4 69 71 605 1 2 70 1 71 0 72 72 610 0A 73 0B 74 Y 75 75 615 X 76 76 648 ANNA1 77 92 855 ANNA2 78 93 861 ANNA3 79 94 880 BERTA1 80 95 895 BERTA2 81 96 905 BERTA3 82 98 910 BERTA4 83 CECILE 84 99 918 CECILE2 85 100 920 DORA 86 101 925 ERNA1 87 102 950 ERNA2 88 103 955 ERNA3 89 104 958 ERNA4 90 FRIEDA1 91 106 1010 FRIEDA1E 92 107 1019 FRIEDA2 93 108 1025 FRIEDA3 94 109 1030 FRIEDA4 95 110 1036 FRIEDA5 96 111 1048 FRIEDAE 97 FRIEDAW 98 GABRIELLE 99 114 1077 GEORGETTE 100 115 1083 HENRIETTE 101 116 1130 IRMA 102 117 1146 J 103 120 1160 J 2 104 JACQUELINE 105 K L 106 126 1265