HAL Id: tel-01660120
https://tel.archives-ouvertes.fr/tel-01660120
Submitted on 10 Dec 2017HAL is a multi-disciplinary open access
archive for the deposit and dissemination of sci-entific research documents, whether they are pub-lished or not. The documents may come from teaching and research institutions in France or abroad, or from public or private research centers.
L’archive ouverte pluridisciplinaire HAL, est destinée au dépôt et à la diffusion de documents scientifiques de niveau recherche, publiés ou non, émanant des établissements d’enseignement et de recherche français ou étrangers, des laboratoires publics ou privés.
Neuroimaging markers in clinical trials for pre-dementia
stages of Alzheimer’s disease
Enrica Cavedo
To cite this version:
Enrica Cavedo. Neuroimaging markers in clinical trials for pre-dementia stages of Alzheimer’s disease. Neurobiology. Université Pierre et Marie Curie - Paris VI; Istituto di Ricovero e Cura a Carattere Scientifico. Fondazione Casimiro Mondino, 2015. English. �NNT : 2015PA066703�. �tel-01660120�
THESE DE DOCTORAT DE L’UNIVERSITE PIERRE ET MARIE CURIE
Spécialité Neurosciences
Ecole doctorale Cerveau Cognition Comportement présentée par
ENRICA CAVEDO
pour obtenir le grade de
DOCTEUR DE L’UNIVERSITE PIERRE ET MARIE CURIE
Soutenue publiquement le 8 Decembre 2015 devant le jury composé de :
Pr. Bruno Dubois Université Pierre et Marie Curie-‐Paris 6 Directeur de thèse Pr. Giovanni B Frisoni Hôpitaux universitaires de Genève and
Université de Genève, IRCCS Centro San Giovanni di Dio Fatebenefratelli
Co-‐Directeur de thèse
Pr. Harald Hampel Université Pierre et Marie Curie-‐Paris 6 Co-‐Directeur de thèse Pr. Alexandre Krainik Centre Hospitalier Universitaire de Grenoble Rapporteur
Pr. Thomas Leyhe Hôpital Psychiatrique Universitaire, Basel Rapporteur
Pr. Kelly Del Tredici Université de Ulm Examinatrice
Pr Jean-‐Christophe Corvol Université Pierre et Marie Curie-‐Paris 6 Examinateur Pr. Jean Mariani Université Pierre et Marie Curie-‐Paris 6 Examinateur
NEUROIMAGING MARKERS IN CLINICAL TRIALS FOR PRE-‐DEMENTIA
STAGES OF ALZHEIMER’S DISEASE
“A person who never made a mistake never tried anything new”
Acknowledgements/Remerciements/ Ringraziamenti
First of all, I would like to thank the members of the Commette that have reviewed my thesis, especially Pr Leyhe and Pr Krainik for agreeing to be rapporteurs. I am really honoured to have had them as members of the Commette.
I would like to thank Pr Leyhe and Pr Del Tredici for agreeing to cross Europe in order to come to my thesis dissertation.
A special thanks to all the Professors that supervised me along these three years (and more):
Pr Frisoni, vorrei ringraziarla per aver creduto in me, per avermi trasmesso la sua passione per la ricerca e l’interesse per la Malattia di Alzheimer. Grazie per avermi insegnato che con passione e dedizione si possono ottenere importanti risultati.
Pr Dubois, je voudrais vous remercier pour vos conseils, votre soutien, confiance et nos échanges scientifiques pendant ces annèes.
Pr Hampel, thank you for your tutelage, advice, and guidance during my first year at IM2A. This was the power to allow me to do my best and to obtain valuable results. Thank you for your constant positive approach from which I have learned how tackling issues.
I would like to thank all the colleagues that I met during these years; from each of them I always learn something. Thanks to my Italian colleagues: Samantha, Donata, Moira, Martina, Michela, Marina, Elena. Thanks to my colleagues in Paris: Simone, Hova, Elodie, Stèphane, Remy.
Un grazie speciale alla mia famiglia, perchè mi ha sempre dato la possibilità di scegliere liberamente e di sbagliare, grazie perchè mi siete sempre stati vicini !
Grazie a Rossana, perchè in tutti questi anni siamo sempre state capaci di non perderci. Grazie perchè in ogni momento di bisogno ho la certezza che tu sei pronta ad ascoltarmi. Grazie per tutti i momenti di gioia e spensieratezza trascorsi insieme durante questi anni.
Ed infine grazie a Gianluca, perchè ha avuto la forza di stravolgere la sua vita per me e per permettermi di inseguire i miei sogni. Grazie perchè mi sei sempre accanto sostenendomi e dandomi la forza e sicurezza per andare avanti. Grazie per tutti i bei momenti trascorsi insieme, e grazie per averli impressi in scatti unici ed indimenticabili nella mia mente. Grazie per la tua sensibilità e delicatezza. Grazie perchè mi hai insegnato cosa vuol dire amare.
TABLE OF CONTENTS
ACKNOWLEDGEMENTS/REMERCIEMENTS/ RINGRAZIAMENTI 3
SUMMARY 6
RESUME 7
LIST OF ABBREVIATIONS 8
I. INTRODUCTION 10
1. WHAT IS ALZHEIMER’S DISEASE? A HISTORICAL OVERVIEW 10
2. THE GLOBAL IMPACT OF ALZHEIMER’S DISEASE 13
3. DEVELOPMENT OF DIAGNOSTIC CRITERIA FOR ALZHEIMER’S DISEASE 16 4. STRUCTURAL AND FUNCTIONAL NEUROIMAGING MARKERS OF ALZHEIMER’S DISEASE 24
4.1 STRUCTURAL NEUROIMAGING MARKERS OF AD 24
4.2 FUNCTIONAL NEUROIMAGING MARKERS OF AD 32
5. BIOMARKERS IN ALZHEIMER’S DISEASE DRUG DEVELOPMENT 37 6. STRUCTURAL AND FUNCTIONAL NEUROIMAGING MARKERS AS SURROGATE OUTCOMES IN
ALZHEIMER’S DISEASE CLINICAL TRIALS 42
6.1 STRUCTURAL NEUROIMAGING MARKERS IN CLINICAL TRIALS FOR AD 42 6.2 FUNCTIONAL IMAGING MARKERS IN CLINICAL TRIALS FOR AD 48
II. MAIN OBJECTIVES 52
III. EXPERIMENTAL STUDIES 54
SECTION 1: STANDARD OPERATING PROCEDURES FOR STRUCTURAL IMAGING MARKERS IN
DEMENTIA 54
STUDY 1: THE ITALIAN ALZHEIMER'S DISEASE NEUROIMAGING INITIATIVE (I-‐ADNI): VALIDATION OF
STRUCTURAL MR IMAGING 55
SECTION 2: STRUCTURAL AND FUNCTIONAL IMAGING CORRELATES OF CHOLINESTERASE
INHIBITORS USE 68
STUDY 2: DONEPEZIL DECREASES ANNUAL RATE OF HIPPOCAMPAL ATROPHY IN SUSPECTED
STUDY 3: REDUCED REGIONAL CORTICAL THICKNESS RATE OF CHANGE IN DONEPEZIL TREATED SUBJECTS WITH SUSPECTED PRODROMAL ALZHEIMER'S DISEASE -‐ A LONGITUDINAL MULTI-‐CENTRIC
DOUBLE-‐BLIND, RANDOMIZED, PLACEBO-‐CONTROLLED TRIAL 79
STUDY 4: HIPPOCAMPUS AND BASAL FOREBRAIN AS PREDICTORS OF COGNITIVE DECLINE AND TREATMENT RESPONSE IN SUSPECTED PRODROMAL ALZHEIMER’S DISEASE 107 STUDY 5: EFFECTS OF RIVASTIGMINE ON VISUAL ATTENTION IN SUBJECTS WITH AMNESTIC MILD COGNITIVE IMPAIRMENT: A SERIAL FUNCTIONAL MRI ACTIVATION PILOT-‐STUDY 134
IV. GENERAL DISCUSSION 164
IMPLEMENTATION OF STANDARD OPERATING PROCEDURES IN A MULTICENTRE SETTING 164
IMPLEMENTATION OF NEUROIMAGING MARKERS IN PRE-‐DEMENTIA PREVENTION TRIALS FOR
ALZHEIMER’S DISEASE 166
CONCLUSIONS AND FUTURE PERSPECTIVES 170
ANNEX 1: SUPPLEMENTARY MATERIAL STUDY 1 175
ANNEX 2: SUPPLEMENTARY MATERIAL STUDY 5 180
LIST OF PUBLICATIONS RELATED TO THE THESIS 182
GENERAL REFERENCES 184
Summary
The development of new drugs and the validation and standardization of neuroimaging and biological markers for Alzheimer’s Disease (AD) clinical treatment trials is expected to be one of the major goals of AD research in the upcoming years. The present thesis aims to address these critical issues. The first part of the thesis is focused on the proper application of Standard Operating Procedures (SOPs) for the structural neuroimaging protocols of acquisition and the implementation of neuroimaging markers in 10 Italian Memory Clinics. The second part of the thesis deals with the application of several structural and functional neuroimaging markers in the context of clinical trials investigation in mild cognitive impairment individuals. Results revealed that the implementation of SOPs at multicentre level reduces the variance of neuroimaging markers measurement detected by different scanners. Moreover, results from the employment of neuroimaging markers in pre-‐dementia trials in mild cognitive impairment individuals showed a significant impact of anticholinesterase therapies in reducing the hippocampal rate of atrophy, the cortical thinning as well as in increasing the activation of brain areas related to functional Magnetic Resonance Imaging (fMRI) face and location matching tasks. These promising results support the hypothesis that structural and functional neuroimaging markers applied in a standardized manner might be utilized as candidate surrogate outcomes in future pre-‐ dementia trials for AD.
Keywords : Alzheimer’s Disease, mild cognitive impairment, neuroimaging markers, MRI, hippocampus, cortical thickness, basal forebrain, fMRI, face and location matching tasks, standard operating procedures, clinical trials, surrogate outcomes.
Résumé
Dans les années à venir, les principaux objectifs de la recherche pour maladie d'Alzheimer (MA) sont le développement de nouveaux médicaments ainsi que la validation et la standardisation des marqueurs de neuroimagerie et de biochimie. La présente thèse vise à aborder ces questions cruciales. La première partie de la thèse fait le point sur l’application correcte des Procédures Opérationnelles Standards (SOPs) pour l'acquisition de protocoles de neuroimagerie structurelle et l’application des marqueurs de neuroimagerie cérébrale dans 10 cliniques italiennes spécialisées dans les troubles de la mémoire. La deuxième partie traite de l'application de plusieurs marqueurs de neuroimagerie structurelle et fonctionnelle dans le cadre des études cliniques sur des patients ayant des troubles précoces de la MA. Les résultats ont révélé que la mise en œuvre des SOPs pour l’acquisition des séquences d’imagerie par résonance magnétique (IRM), au niveau multicentrique, réduit la variance des mesures des marqueurs de neuroimagerie détectées par différents scanners. En outre, les résultats de la deuxième partie de la thèse ont montré que les thérapies anticholinestérasiques ont un impact significatif : réduction de l'atrophie de l'hippocampe, de l'amincissement cortical ainsi que l'augmentation de l'activation de la voie dorsale visuelle des patients ayant des troubles précoces de la MA. Ces résultats prometteurs confirment l'hypothèse que les marqueurs de neuroimagerie structurelle et fonctionnelle appliqués avec SOPs pourraient être utilisés comme critère d'évaluation substitutif dans les études cliniques pour les patients ayant des troubles précoces de la MA.
Mots clés : Maladie d’Alzheimer, IRM, marqueurs de neuroimagerie, IRM fonctionnelle, hippocampe, épaisseur corticale, cerveau antérieur basal, études cliniques, Procédures Opérationnelles Standards.
List of Abbreviations
18F-‐FDG-‐PET 18F-‐fluorodeoxyglucose-‐PET
AD Alzheimer’s Disease
ADNI Alzheimer’s Disease Neuroimaging Initiative
AIBL Australian Imaging, Biomarker, and Lifestyle Flagship Study of Ageing
APC Annualized Percent Change
APOE Apolipoprotein E
APP amyloid precursor protein
Aβ1-‐42 42 amino acid-‐long form of the amyloid beta peptide
BF Basal Forebrain
CSF Cerebrospinal fluid
DIAN Dominantly Inherited Alzheimer’s Network
E-‐ADNI European-‐ADNI
EADC European Alzheimer’s Disease Consortium
EMA European Medicines Agency
FCSRT Free and Cued Selective Reminding Test
FDA Food and Drug Administration
fMRI functional Magnetic Resonance Imaging
IWG International Working Group
MCI Mild Cognitive Impairment
MPRAGE Magnetization-‐Prepared Rapid Gradient-‐Echo
MRI Magnetic Resonance Imaging
MTL Medial Temporal Lobe
NbM Nucleus basalis of Meynert
NIA-‐AA National Institute on Aging-‐Alzheimer’s Association
NINCDS-‐ADRDA National Institute of Neurological and Communicative Disorders and
Stroke and the Alzheimer's Disease and Related Disorders Association
PET Positron Emission Tomography
PSEN1 Presenilin-‐1
sMRI Structural Magnetic Resonance Imaging
SNR Signal-‐to-‐Noise Ratio
SOPs Standard Operating Procedures
I. INTRODUCTION
1. WHAT IS ALZHEIMER’S DISEASE? A HISTORICAL OVERVIEW
Since 4,000 years ago Egyptians recognized the loss of cognitive abilities in elderly individuals (Boller and Forbes, 1998). However, the clinical description of what we now consider dementia was not established until the 19th century. The French physician Philippe Pinel, considered the father of modern psychiatry, is generally credited for introducing the term dementia (démence), although the term may have been in use prior to that time. However, it was Pinel’s student, Jean Etienne Esquirol, in his book Des Maladies Mentales (1838), who described the distinction between amentia and dementia, the former was the term used to denote an individual who developed deficits in mental functioning early in life (amentia meant someone who was born with mental deficiencies), the latter referring to loss of mental faculties leading to the concept of senile dementia (individuals who develop mental deficiencies as adults) (Berchtold and Cotman, 1998). In the 1860s, clinical-‐pathologic studies of senile dementia demonstrated a reduction of brain weight and atrophy. The late 19th century witnessed revolutionary progress in neuropathological methods including brain tissue fixation, staining, and improved microscope optics. This permitted the characterization of individual neurons in their entirety by Golgi (Pannese, 1999) in 1873. These technological developments set the stage for the identification of the lesions that now characterize Alzheimer’s disease. Blocq and Marinesco using a carmine stain on brain tissue from patients with chronic epilepsy described for the first time senile plaques in 1892 (Buda, et al., 2009) without recognize any link to dementia.
The term Alzheimer’s Disease (AD) derives from the name of the German neurologist who first described this disorder, in 1906 (Goedert and Ghetti, 2007). He followed a patient in her early 50s who had suffered from memory loss and difficulty both speaking and understanding what was said. After her death, Dr. Alzheimer performed a detailed investigation of her brain, noting dramatic brain atrophy as well as unusual protein deposits called amyloid plaques and neurofibrillary tangles. That same year, Oskar Fischer separately reported a link between dementia and plaques in 12 cases of senile dementia (Goedert, 2009). In his textbook of psychiatry published in 1910, Emil Kraepelin used the term Alzheimer’s Disease to refer to the early onset dementia and distinguished it from the later onset senile dementia (Amaducci, et al., 1986). More than a century later, these neuropathological characteristics are still recognized as the hallmarks of AD. In order to address the issues related to diagnose patients with AD at its earliest stages, the National Institute of Neurological and Communicative Disorders and Stroke and the Alzheimer's Disease and Related Disorders Association (NINCDS-‐ADRDA), and the National Institute of Mental Health published a consensus recommendations for the clinical diagnosis of AD in 1984 (Khachaturian, 1985,McKhann, et al., 1984). These recommendations and the two following iterations (Mirra, et al., 1991) provided protocols aimed to harmonize the definition of AD using terms as "definite Alzheimer's disease" (AD), "probable AD," "possible AD," and "normal brain" in order to indicate levels of diagnostic certainty. These consensus recommendations have reduced subjective interpretation, and assured common language in the diagnosis of AD. In addition, findings on the relationship between cholinergic deficits in persons with AD leading to neuronal loss in the basal forebrain, measures of AD pathologic changes, and cognitive function were found (Perry, et al., 1977, Perry, et al., 1978, Whitehouse, et al., 1981, Whitehouse, et al., 1982, Wilcock, et al., 1982). These findings
motivated, in part, the conduction of clinical trials with cholinesterase inhibitors (Davis, et al., 1992, Rogers and Friedhoff, 1996) that have been subsequently approved by the Food
2. THE GLOBAL IMPACT OF ALZHEIMER’S DISEASE
To date, the Alzheimer’s Disease (AD) is the most common cause of dementia. Dementia was estimated to affect 35.6 million people worldwide in 2010, and without any preventive plans aimed to slow the disease onset, the prevalence of dementia is expected to increase to 65.7 million by 2030 and 115.4 million by 2050 (Alzheimer’s Disease International: World Alzheimer’s Report, 2009) (Figure 1). The astronomical numbers of people with dementia will put a huge stress on governments and public health systems around the world. In 2010, total estimated worldwide costs of dementia were USD 604 billion, about 1% of the world’s gross domestic product.
Figure 1. The worldwide dementia epidemic.
If it were a country in and of itself, dementia care would rank 18th in the size of its economy, nearly the same as the economy of Turkey (Alzheimer’s Disease International: World Alzheimer Report, 2010). Brookmeyer and colleagues (Brookmeyer, et al., 1998) estimated that a delay of 5 years in the onset of AD could decrease the prevalence of the disease by almost 50%. Even delaying onset by as little as 1 year would have enormous public health implications, reducing the worldwide prevalence by nearly 9.2 million cases by 2050, with most of the decline among those who need the highest level of care (Brookmeyer, et al., 2007).
Figure 2. Prevalence of aging of population among countries (Hampel H, Lista S. Silent Alarm – The Quiet Epidemic of Alzheimer’s Disease. Karger Gazette. The Aging Issue. 2012;72:8-‐10).
Sources: Population, Ageing and Development Wallchart. UN Population Division, 2009. Older Americans 2010: Key Indicators of Well-‐Being. Federal Interagency Forum on Aging Related Statistics, 2010. Global Age-‐Friendly Cities: A Guide. World Health Organization. 2007. World Agriculture: Towards 2030/2050. Food and Agriculture Organization of the UN, 2006. Bryant J, Sonerson A: Gauging the cost of aging. Finance & Development 2006, vol. 43, No. 3. Australia to 2050: Future Challenges. Australian Government:, 2010. World Population and Ageing: 1950–2050. UN Population Division, 2001. Falls factsheet. World Health Organization, 2010.
The main reason for this worldwide explosion of dementia prevalence is the aging of the population. Indeed, people around the world are living longer and healthier owing to the medical advances that have reduced the incidence of communicable diseases (Figure 2).
It is clear that AD represents a worldwide public health crisis of unimaginable proportions, demanding a massive, integrated, multidisciplinary, and sustained worldwide response. Over the past decades, there has been significant progress in understanding the molecular and biochemical basis of the disease and in applying that knowledge to the development of new technologies and treatments. In spite of these progresses in the tentative of slowing the prevalence of the disease more attention from governments, academic institutions, and the private sector, combined with a broadened perspective, is needed. Only through such collaboration better treatments – and eventually a cure – will be found.
3. DEVELOPMENT OF DIAGNOSTIC CRITERIA FOR ALZHEIMER’S DISEASE
The first criteria for diagnosing AD were established in 1984 (McKhann, et al., 1984) when little was known about the genetic and molecular events that result in disease, and before the availability of imaging technologies revealing the dysfunction or death of brain cells. Developed by the National Institute of Neurological and Communicative Disorders and Stroke (NINCDS, now NINDS) and the Alzheimer’s Disease and Related Disorders Association (ADRDA, now the Alzheimer’s Association), these criteria required a physical evaluation as well as neuropsychological testing to classify patients as having probable or possible AD. Although, according to these criteria, a definite diagnosis was made only after confirmation by a detailed study of the brain tissue at autopsy, the clinical diagnosis of probable AD could be made when a progressive impairment in at least two cognitive domains was present. Memory was considered the most common cognitive domain affected during AD; others cognitive domains affected are: concentration, problem-‐solving and language. In the next 20 years, these criteria have evolved in parallel to the development and discover of biological and imaging markers for AD thanks to several worldwide initiatives such as the Alzheimer’s Disease Neuroimaging Initiative (ADNI), the Australian Imaging, Biomarker, and Lifestyle Flagship Study of Ageing (AIBL) and global efforts known as World Wide ADNI. On account of these initiatives, in the recent years, biomarkers for making not only an earlier diagnosis but also for providing more precise information about the pathological basis of AD have been identified. As a result of this improved understanding of the disease, six sets of research criteria reflecting the full range of the disease, from its earliest effects to its eventual impact on mental and physical function, have been proposed. The International Working Group (IWG) criteria in 2007 and the National Institute on Aging-‐Alzheimer’s Association (NIA-‐AA)
workgroups in 2011 developed two independent set of criteria for AD. The proposed criteria and guidelines identify three main different phases of the disease: (1) the asymptomatic at risk, pre-‐symptomatic, or preclinical phase occurring many years before symptoms become evident (Sperling, et al., 2011); (2) the symptomatic phase characterized by mild problems in cognition, learning, and memory, enough to be noticed and measured but not enough to impair the ability to live independently or carry out everyday activities (Albert, et al., 2011a, Dubois, et al., 2010, Dubois, et al., 2007, Dubois, et al., 2014); (3) the probable and possible Alzheimer’s dementia, characterized by a marked impairment of memory and cognition and functional dependence.
The criteria for the asymptomatic at risk, pre-‐symptomatic or preclinical phase identify cognitive intact people who might develop AD in their future. According to the update version of the IWG criteria (IWG-‐2) there are two type of preclinical phase: (i) asymptomatic at risk and (ii) presymptomatic individuals. The asymptomatic at risk individuals are cognitive intact persons with evidence of in vivo pathological biomarkers, while the presymptomatic individuals are persons without cognitive impairment or evidence of in vivo pathophysiological biomarkers but mutation carriers (Dubois, et al., 2014) (Table 1). According to the NIA-‐AA criteria, the pathologic process of AD is not always clinically expressed and AD is recognized as a continuum in which the initially asymptomatic AD pathophysiological cascade results in symptoms. Therefore, the NIA-‐AA criteria consider as Preclinical AD the pathophysiological stage when in vivo molecular biomarkers of AD are presents in absent of symptoms. In particular, according to these criteria, the entity of preclinical AD can be divided into three different stages. Stage 1 represents asymptomatic individuals with in vivo markers of brain amyloidosis such as high Positron Emission Tomography (PET) amyloid tracer retention, low cerebrospinal fluid (CSF) of the 42 amino
acid-‐long form of the amyloid beta peptide (Aβ1-‐42); Stage 2 is characterised by the
presence of both in vivo markers of amyloidosis and neurodegeneration such as neuronal dysfunction on 18F-‐fluorodeoxyglucose (18F-‐FDG)-‐PET/fMRI, High CSF tau/p-‐tau, cortical thinning and hippocampal atrophy on structural MRI; Stage 3 is represented by both the above in vivo markers of amyloidosis and neurodegeneration plus subtle cognitive decline such as subtle cognitive changes such as poor performances on more challenging cognitive tests. These individuals do not meet yet the criteria for MCI (Sperling, et al., 2011) (Table1).
Regarding the symptomatic phase of AD, three sets of criteria have been established to characterize mild problems in cognition. In particular, they include biomarkers of Alzheimer’s disease pathology to increase the confidence that subjects with Mild Cognitive Impairment (MCI) have Alzheimer’s disease as underlying cause. However, they differ in the definition of MCI and biomarker abnormality (Visser, et al., 2012) (Table 1). The IWG-‐1 criteria have introduced the term prodromal AD for the pre-‐dementia diagnosis of AD and were designed to serve as research criteria. These criteria require episodic memory impairment and at least one abnormal AD biomarker. The biomarker can be a topographical marker, for instance the medial temporal lobe atrophy on MRI or the parieto-‐temporal hypoperfusion on 18F-‐FDG-‐
PET, or it can be a pathophysiological marker such as the decreased CSF Aβ1-‐42, or the
increased CSF tau, or the increased amyloid PET uptake (Dubois, et al., 2007). In 2010, the IWG-‐1 criteria and the lexicon used to define different stages of AD were further elucidated by the group (Dubois, et al., 2010). The major advantage of the IWG-‐1 criteria has been to integrate the use of biomarkers into diagnosis to allow a biologically based approach to diagnosis independent of disease severity. Recently, the updated IWG criteria (IWG2) distinguish between the pathophysiological markers (diagnostic markers) and the topographical markers (markers of progressions) that are necessary for an early diagnosis of
AD. They described the type of cognitive impairment in different cognitive domains and which biomarker can be considered for the diagnosis or for the progression. The pathological biomarkers are: decreased CSF Aβ1-‐42 and increased tau, or increased amyloid PET uptake
(Dubois, et al., 2014) (Table 1). These criteria specify two subtypes: typical prodromal AD if the impairment on a memory test is present; and atypical prodromal AD if only impairment on a non-‐memory test is present. Along similar lines, one more set of diagnostic criteria has been proposed recently by NIA-‐AA criteria (Aisen, et al., 2011a,Albert, et al., 2011a,Sperling, et al., 2011).
The NIA-‐AA criteria have used the term ‘mild cognitive impairment due to AD’ and were designed for both clinical and research purposes. They require cognitive impairment in any cognitive domain and abnormal amyloid markers (i.e. decreased CSF Aβ1-‐42 or increased amyloid PET uptake) or neuronal injury markers (i.e. medial temporal lobe atrophy on MRI, increased CSF tau, or parietotemporal hypoperfusion on 18F-‐FDG-‐PET. They associated the number of abnormal biomarkers to the likelihood that MCI condition is due to AD (Albert, et al., 2011a) (Table 1).
Both criteria (IWG-‐1 and NIA-‐AA) have showed a good predictivity to detect the progression to Alzheimer’s disease-‐type dementia in subjects with MCI (Bouwman, et al., 2010,Oksengard, et al., 2010,Petersen, et al., 2013,Prestia, et al., 2013). A recent study compared the sensibility and specificity of IWG-‐1, IWG-‐2 and NIA-‐AA criteria in detecting the prevalence and incidence of AD at the MCI stage by means of a large multicentre study. The results supported the use of all proposed research criteria to identify AD at the mild cognitive impairment stage. In clinical setting the use of both amyloid and neuronal injury markers, as proposed by the NIA-‐AA criteria, offers the most accurate diagnosis. For clinical
trial selection, the MCI high likelihood due to AD, as defined by the NIA-‐AA criteria, or the prodromal AD group, according to the IWG-‐2 criteria, could be considered (Vos, et al., 2015).
Both approaches showed important similarities and differences and clearly need further validation and standardization before being considered for pivotal studies in AD. However, as Vos and colleagues affirmed, from a regulatory point of view, the Dubois/IWG criteria seem to be less complicated and as such more readily applicable in clinical practice and more easily generalizable to everyday clinical practice (Vos, et al., 2015).
Referring to the diagnosis of full-‐blown AD, the criteria proposed by Mckhan on 1984 were updated by himself in 2011 (McKhann, et al., 2011). These criteria commonly referred to as the NINCDS-‐ADRDA criteria, have been quite successful, surviving for over 27 years. These criteria have been reliable for the diagnosis of probable AD, and across more than a dozen clinical pathological studies have had a sensitivity of 81% and specificity of 70% (Knopman, et al., 2001). They have been widely used in clinical trials and clinical research. Knowledge of the clinical manifestations and biology of AD has increased vastly. In the update criteria they proposed the following terminology for classifying individuals with dementia caused by AD: (1) Probable AD dementia, (2) Possible AD dementia, and (3) Probable or possible AD dementia with evidence of the AD pathophysiological process. The first two were intended for use in all clinical settings. The third was intended for research purposes. The updated criteria for probable dementia did not change from the 1984 NINCDS–ADRD.
Tab le &1 .&C la ss ifi ca tio n& of &a sy m pt om at ic &p ha se &o f&AD ,&c og ni tiv e& im pa irm en t&p ha se &a cc or di ng &to &th e& IW G ?I,& IW G ?2,&NIA ?AA& cr ite ria .& & ! ! Cl in ica l&p ro fil e& Bi om ar ke rs & As ym ptom atic & NIA ?AA & Stag e! 1! Co gn iti ve ly !In tac t! 1Hi gh !P ET !am yl oi d! Tr ac er !Re te nti on ! 1Low !CSF! Aβ11 42 ! ! Stag e! 2! Co gn iti ve ly !In tac t! 1Hi gh !P ET !am yl oi d! Tr ac er !Re te nti on ! 1Low !CSF! Aβ11 42 ! 1C or tic al !T hi nn in g/ Hi pp oc am pal !A tr op hy !o n! sMRI ! 1N eu ro nal !d ys fu nc tio n! on ! 18 F1 FDG 1PE T/ fMRI ! 1Hi gh !C SF !tau /p 1tau ! ! Stag e! 3! Su btl e! Co gn iti ve ! D ec lin e/ ! Po or ! pe rf or m an ce ! on ! m or e! ch al le ng in g! co gn iti ve !te st ! 1Hi gh !P ET !am yl oi d! Tr ac er !Re te nti on ! 1Low !CSF! Aβ11 42 ! 1C or tic al !T hi nn in g/ Hi pp oc am pal !A tr op hy !o n! sMRI ! 1N eu ro nal !d ys fu nc tio n! on ! 18 F1 FDG 1PE T/ fMRI ! 1Hi gh !C SF !tau /p 1tau ! IW G ?2 & As ymp to m ati c! at! ris k! ! Ab se nc e! of ! am ne sti c! sy nd ro m e! of ! th e! hi pp oc am pal ! ty pe /A bs en ce !o f!an y! cl in ic al !p he no ty pe !o f!aty pi cal !A D ! 1Low !CSF! Aβ11 42 ! an d! Hi gh !C SF !tau /p 1tau ! 1Hi gh !P ET !am yl oi d! Tr ac er !Re te nti on ! ! Pre 1s ym pto m ati c! Ab se nc e! of ! am ne sti c! sy nd ro m e! of ! th e! hi pp oc am pal ! ty pe /A bs en ce !o f!an y! cl in ic al !p he no ty pe !o f!aty pi cal !A D ! 1A D !au to so m al !d om in an t! m utati on !p re se nt! (in ! PS EN1,! PS EN2,! or! APP) ! ! ! ! !
Tab le &1 .&C la ss ifi ca tio n& of &a sy m pt om at ic &p ha se &o f&AD ,&c og ni tiv e& im pa irm en t&p ha se &a cc or di ng &to &th e& IW G ?I,& IW G ?2,&NIA ?AA& cr ite ria .& Cl in ica l&p ro fil e& & &&&&&&&&&&&&&&&&&&&&&&&&&&&&&&&&&&&&& &Bi om ar ke rs & & Co gn iti ve&Decl in e& IW G ?I& Pr od ro m al (A D ( O bj ec tiv e( ev id en ce ( of ( an ( am ne sti c( sy nd ro m e( of ( th e( hi pp oc am pal (ty pe ( 9Hi gh (P ET (am yl oi d( Tr ac er (Re te nti on ( 9Low (CSF( Aβ19 42 ( 9C or tic al (T hi nn in g/ Hi pp oc am pal (A tr op hy (o n( sMRI ( 9N eu ro nal (d ys fu nc tio n( on ( 18 F9 FDG 9PE T/ fMRI ( 9Hi gh (C SF (tau /p 9tau ( & ( ( ( IW G ?2 & Pr od ro m al (A D ( 9( G rad ual (an d( pr og re ss iv e( ch an ge (i n( m em or y( fu nc tio n( re po rte d( by ( pati en t( or ( in fo rm an t( ov er ( m or e( th an ( 6( m on th s( 9( Ob je cti ve (e vi de nc e( of (an (am ne sti c( sy nd ro m e( of (th e( hi pp oc am pal (ty pe ( 9Low (CSF( Aβ19 42 ( an d( Hi gh (C SF (tau /p 9tau ( 9Hi gh (P ET (am yl oi d( Tr ac er (Re te nti on ( 9A D (au to so m al (d om in an t( m utati on (p re se nt( (in ( PS EN1,( PS EN2,( or( APP) ( NIA ?AA & MC I(d ue (to (A D ( hig h(lik elihood ( Mi ld (C og ni tiv e( Im pai rm en t( 9Low (CSF( Aβ19 42 ( an d( Hi gh (P ET (am yl oi d( Tr ac er (((( Re te nti on ( 9Hi gh (C SF (tau /p 9tau ( 9C or tic al (T hi nn in g/ Hi pp oc am pal (A tr op hy (o n( sMRI ( 9N eu ro nal (d ys fu nc tio n( on ( 18 F9 FDG 9PE T/ fMRI ( ( MC I( un lik el y( du e( to (A D ( Mi ld (C og ni tiv e( Im pai rm en t( 9Hi gh (C SF ( Aβ19 42 ( an d( Lo w (P ET (am yl oi d( Tr ac er ( Re te nti on ( 9L ow (C SF (tau /p 9tau ( 9N o( Co rti cal (T hi nn in g/ Hi pp oc am pal (A tr op hy (o n( sMRI ( 9(N o( N eu ro nal (d ys fu nc tio n( on ( 18 F9 FDG 9PE T/ fMRI ( (
The diagnosis of possible AD dementia is currently made whether the following circumstances are present (McKhann, et al., 2011):
Atypical course with cognitive deficits for AD dementia, but either has a sudden onset of cognitive impairment or demonstrates insufficient historical detail or objective cognitive documentation of progressive decline; aetiologically mixed presentation including: (a) concomitant cerebrovascular disease, history of stroke or presence of multiple or extensive infarcts or severe white matter hyperintensity burden; or (b) features of Dementia with Lewy bodies other than the dementia itself; or (c) evidence for another neurological disease or a non-‐neurological medical comorbidity or medication use that could have a substantial effect on cognition;
In persons who meet the core clinical Criteria for probable AD dementia in vivo biomarkers evidence of brain amyloidosis as well as brain injury, may increase the certainty that the basis of the clinical dementia syndrome is the AD pathophysiological process.
4. STRUCTURAL AND FUNCTIONAL NEUROIMAGING MARKERS OF ALZHEIMER’S DISEASE
4.1 Structural Neuroimaging Markers of AD
The non-‐invasive, non-‐radioactive, quantitative nature of magnetic resonance techniques has propelled them to the forefront of neuroscience and neuropsychiatric research. In particular, recent advances have confirmed their enormous potential in patients with Alzheimer disease (AD). Structural and functional magnetic resonance imaging (MRI) have demonstrated significant correlation with clinical outcomes and underlying pathology that allow their implementation in the clinic of AD (Anderson, et al., 2005).
Progressive cerebral atrophy is a characteristic feature of neurodegeneration that can be visualized in vivo with MRI (best with T1-‐weighted volumetric sequences). The major contributors to atrophy are thought to be dendritic and neuronal losses. Studies of regional MRI volumes (e.g., hippocampus) have shown the association of these volumes with neuronal counts at autopsy (Bobinski, et al., 2000, Gosche, et al., 2002, Jack, et al., 2002).
Structural MRI (sMRI) is the modality most used for the diagnosis of AD. In AD, cerebral atrophy – detected by sMRI – occurs in a characteristic topographic distribution (Baron, et al., 2001) which mirrors the Braak (Braak and Braak, 1991) and Delacourte (Delacourte, et al., 1999, Thompson, et al., 2003) neurofibrillary tangles (NFT) staging. The earliest sites of tau deposition and MRI-‐based atrophic changes typically lie along the perforant (polysynaptic) hippocampal pathway (entorhinal cortex, hippocampus and posterior cingulate cortex), consistent with early memory deficits (Thompson, et al., 2003) (Scahill, et al., 2002). Later, atrophy in temporal, parietal and frontal neocortices is associated with
neuronal loss, as well as language, praxic, visuospatial and behavioural impairments (Frisoni, et al., 2008, McDonald, et al., 2009). Although the process of atrophy in AD correlates with the primary proteinopathies such as tau (Josephs, et al., 2008b, Whitwell, et al., 2008a, Whitwell, et al., 2007), the atrophy, however, does not follow the topography of beta-‐ amyloid deposition nor it is particularly well correlated with plaque counts or immunostaining in imaging-‐autopsy (Jack, et al., 2008b, Josephs, et al., 2008a). Thus, sMRI is correctly viewed as a direct measure of neurodegeneration. The location and severity of atrophy can be extracted from grey scale images by qualitative visual grading (Scheltens, et al., 1992), by quantification of the volume of specific structures, or by measuring volume/thickness from multiple regions of interest to form AD-‐signature composite measures (Sapolsky, et al., 2010, Vemuri, et al., 2008). The most common sMRI measures employed in AD are at subcortical level the atrophy of the hippocampus, entorhinal cortex, temporal lobe, basal forebrain, and at cortical level the thinning of cortex. In addition, ventricle enlargements and whole brain volume represent more indirect markers of brain atrophy. Rates of change in the whole brain (Fox, et al., 1999, Josephs, et al., 2008a, Schott, et al., 2008, Sluimer, et al., 2008), the entorhinal cortex (Cardenas, et al., 2011), the hippocampus (Jack, et al., 2004, Morra, et al., 2009, Ridha, et al., 2008, Thompson, et al., 2004) and the temporal lobe volumes (Ho, et al., 2010, Hua, et al., 2009), as well as ventricular enlargement (Jack, et al., 2004, Jack, et al., 2003, Ridha, et al., 2008, Thompson, et al., 2004), closely correlate with changes in cognitive performances. These results support the validity of these markers as indexes of disease progression. In order to implement the use of marker of atrophy in the clinic it is necessary that its dynamics is known at each different stages of the disease. In addition, it is important that also the association of the marker of atrophy with the dynamics of other imaging and biological markers is understood
(Frisoni, et al., 2010). Progression of atrophy in the whole brain and in areas targeted by AD (medial temporal lobe, temporoparietal, and restrosplenial cortex) represents a reliable marker of the neurodegenerative process underlying clinical symptoms, and it seems more robust than markers of amyloidosis alone. From MCI to moderate dementia stage of AD, structural markers are more sensitive to change than markers of beta-‐amyloid deposition (as assessed through brain imaging or CSF analysis)(Jack, et al., 2009). In asymptomatic to MCI stages, however, indirect evidence indicates that amyloid markers show more substantial abnormalities than structural markers (Engler, et al., 2006, Fox, et al., 2001, Josephs, et al., 2008a, Minoshima, et al., 1997, Pike, et al., 2007, Ridha, et al., 2006) (Jack, et al., 2010).
Among all available MRI markers of AD, the hippocampal atrophy, assessed on high-‐ resolution T1-‐weighted MRI images, is the best established and validated (Figure 3). The simplest way to assess atrophy of the medial temporal lobes is by visual inspection of coronal T1-‐weighted MRI. Several rating scales to quantify the degree of atrophy have been developed and are widely used (Scheltens, et al., 1992). Visual rating scales provide ≈80–85% of sensitivity and specificity to distinguish patients with AD from those with no cognitive impairment, and only slightly lower sensitivity and specificity levels for diagnosing amnestic MCI and for anticipating their decline (DeCarli, et al., 2007, Duara, et al., 2008, Korf, et al., 2004). These scales also have good predictive power to anticipate decline in MCI (DeCarli, et al., 2007, Duara, et al., 2008, Korf, et al., 2004, Scheltens, et al., 1992). Visual rating also correlates well with underlying pathology and has high diagnostic accuracy against a pathologically verified diagnosis of AD (Burton, et al., 2009). Despite its convoluted structure, the boundaries of the hippocampus (and adjacent CSF spaces) are easier to be recognized from human operators or automated algorithms than other structures such as the amygdala, the entorhinal cortex or the parahippocampal gyrus. This is because the
anatomical boundaries of the hippocampus are distinct on high-‐resolution T1-‐weighted MRI scans around most of the surface of this structure. Hippocampal volume measured in vivo by MRI correlates with Braak stage and neuronal counts (Bobinski, et al., 2000, Jack, et al., 2002) (Gosche, et al., 2002).
Figure 3. 3D-‐reconstraction of cytoarchitectonic hippocampal subregions. At the top, cytoarchitectonic subregions mapped on blank MR based models at 3Tesla of the hippocampal formation of a healthy subject (Frisoni, et al., 2006). At the bottom, effect of AD on local hippocampal volume: maps of the difference of regional volume between 19 AD patients and 19 healthy elderly controls (Frisoni, et al., 2008).
At the mild dementia stage of AD, hippocampal volume is already reduced by 15–30% relative to controls (van der Flier, et al., 2005), and in the amnestic variant of MCI the volume is reduced by 10–15% (Shi, et al., 2009) (a meta-‐analysis of hippocampal MRI studies is provided elsewhere (Barnes, et al., 2008)). A meta-‐analysis estimated that medial temporal atrophy has ≈73% sensitivity and ≈81% specificity for predicting whether patients with amnestic MCI will convert to dementia (Yuan, et al., 2009). When the medial temporal lobe atrophy is measured with a continuous metric such as hippocampal volume, specificity might be increased, but at the cost of reduced sensitivity. Recently, this marker was recommended by the revised criteria for AD as one of core biomarkers for AD (Albert, et al., 2011b, Dubois, et al., 2010, Dubois, et al., 2007, C.R. Jack, Jr., et al., 2011a, McKhann, et al., 2011). Thanks to its reliability as diagnostic marker for AD, international efforts to harmonize the definition of the hippocampus were carried out (Frisoni and Jack, 2011, Frisoni, et al., 2014, C.R. Jack, Jr., et al., 2011b). Fully automated MR-‐based hippocampal volumetry seems to fulfil the requirements for a relevant core feasible biomarker for detection of AD associated neurodegeneration in everyday patient care, such as in a secondary care memory clinic for outpatients.
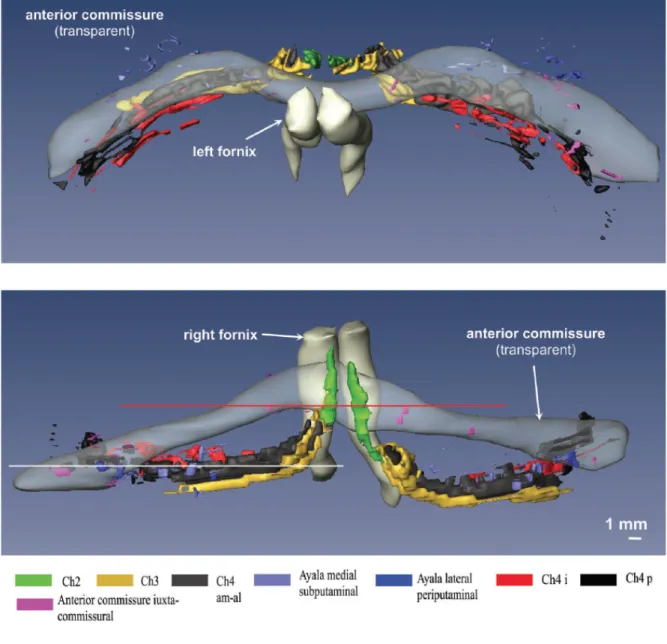
Recently growing in vivo evidences have also confirmed the presence of the basal forebrain (BF) atrophy in AD patients and in clinical prodromal stages of AD (Grothe, et al., 2013, Grothe, et al., 2012, Teipel, et al., 2011). The BF could be considered as uninterrupted band connected to basotemporal areas such as the entorhinal cortex, hippocampal formation (Mesulam, 2013) (Figure 4). Degeneration of BF cholinergic nuclei is associated with cognitive decline, and this effect it might be mediated by neuronal dysfunction in the denervated cortical areas. MRI-‐based measurements of BF atrophy are increasingly being used as in vivo surrogate markers for cholinergic degeneration.
Figure 4. Computer-‐assisted 3D reconstruction of the human BF complex, seen from the dorsal view (at top) and from the fronto-‐occipital perspective (at the bottom) (Grinberg, 2007).
Unlike hippocampal volumes, BF volume has shown to be correlated to brain amyloid status suggesting that the atrophy in the former is closely related to cortical amyloid burden (Kerbler, et al., 2015, Teipel, et al., 2014). A recent study conducted by Kilimann and colleagues revealed significant volume reductions of all subregions of the BF in AD, in particular in the posterior nucleus basalis of Meynert (NbM). In this study, the mild cognitive
impairment group who converted to AD showed pronounced volume reductions in the Ch4p and in the nucleus subputaminalis, but preserved volumes of anterior-‐medial regions (Ch4am). The diagnostic accuracy of posterior NbM volume was superior to hippocampus volume in both groups, despite higher multicentre variability of the BF measurements. The data of this study suggested that the morphometry of BF may provide an emerging biomarker in AD (Kilimann, et al., 2014). Moreover, the BF atrophy was also associated with widespread cortical hypometabolism, and path analytic models indicated that hypometabolism in domain-‐specific cortical networks mediated the association between BF volume and cognitive dysfunction (Grothe, et al., 2015).
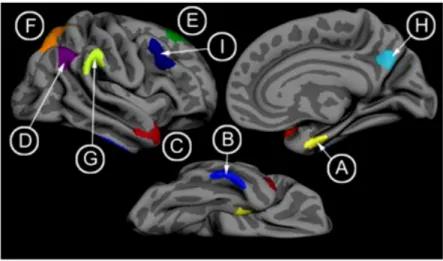
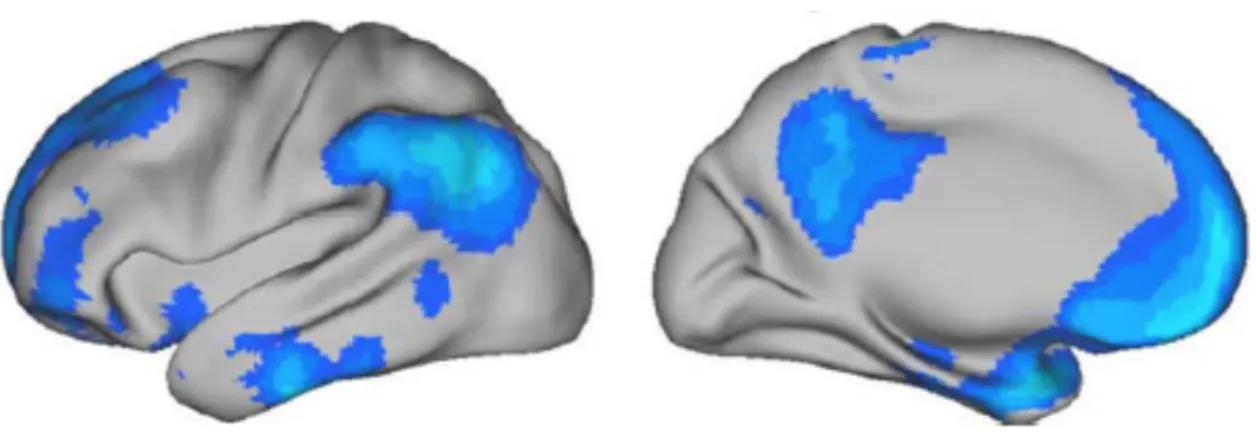
Cortical atrophy is reflected in a loss of grey matter that resulted in a reduction of cortical thickness. Cortical thickness measurement across the entire cerebrum was recognised as a marker for AD (Dickerson, et al., 2009). Normative data describing the cross-‐ sectional and longitudinal brain volume decline in aging and AD showed an acceleration of whole brain volume atrophy rates associated to AD (Cardenas, et al., 2003, Fotenos, et al., 2005, Fox, et al., 1999) confirming that extensive regional changes are taking place in AD, not only in the medial temporal lobe regions. Cortical thinning in AD was first found in distributed association areas pointing out that regional atrophy can be detected across widespread cortical areas (Du, et al., 2007, Lerch, et al., 2008). Cortical thickness measurements in comparison to other biomarkers provide quantitative values describing physical property of the brain detectable at single individual level (Rosas, et al., 2002). Dickerson and colleagues identified a spatial topography of regional cortical thinning in AD patients (Dickerson, et al., 2009) (Figure 5). The cortical AD signature identified by Dickerson and colleagues was consistent with previous findings with voxel-‐based morphometry in mild AD (Baron, et al., 2001, Bozzali, et al., 2006, Karas, et al., 2004, Whitwell, et al., 2008b) and