XII. COMMUNICATIONS BIOPHYSICS
D. Braida
K. Burns
S. Frishkopf
L. Goldsteint
J. Guinan, Jr
W. Henry$
G. Katona
G. Mark**'
Baer E. Berliner Cintron S. Colburn Demko, Jr. HasanAcademic and Research Staff Prof. W. T. Peakel Prof. W. A. Rosenblithft Prof. W. M. Siebert Prof. T. F. Weisst ft Prof. M. L. Wiederholdt Dr. J. S. Barlow*** Mr. N. I. Durlach Dr. R. D. Hall Dr. P. L. Hill Graduate Students L. Hicks J. M. Houtsma H. Johnson W. Kress, Jr. F. Krummenoehl Y-S. Li C. Moxon
Dr. N. Y. S. Kiangt
Dr. R. W. Lansingttf
D. W. Altmannt
R. M. Brownt
F. H. Byerst
A. H. Cristt
W. F. Kelley
L. H. Seifel
W. M. RabinowitzA. V. Reed
D. O. Stahl II
R. S. Stephenson
A. P. Tripp, Jr.
D. R. Wolfe
*This work was supported principally by the National Institutes of Health (Grant 5 P01 GM14940-03), and in part by the National Institutes of Health (Grant 5 TOl GM01555-03), and the National Aeronautics and Space Administration (Grant NGL 22-009-304).
tAlso
at the Eaton-Peabody Laboratory, Massachusetts Eye and Ear Infirmary,Boston, Massachusetts.
tVisiting Associate Professor from the Department of Physics, Union College, Schenectady, New York.
Instructor in Medicine, Harvard Medical School, Boston, Massachusetts.
? Professor Rosenblith has assumed the duties of Associate Provost of M.I.T. and during the period of this assignment his activities with the Communications Bio-physics Group will be suspended.
tInstructor in Preventive Medicine, Harvard Medical School, Boston, Massa-chusetts.
Research Affiliate in Communication Sciences from the Neurophysiological Laboratory of the Neurology Service of the Massachusetts General Hospital, Boston, Massachusetts.
tttPostdoctoral Fellow from the Department of Psychology, University of Arizona, Tucson, Arizona. Prof. Prof. Prof. Prof. Prof. Prof. Prof. Prof.
A. CURRENT NOISE IN NERVE MEMBRANE: SOME COMMENTS ON MEASUREMENT TECHNIQUES
Excitability studies have long suggested that the electrical characteristics of nerve 1-3
membrane include randomly fluctuating components. The first direct observations of such components were reported by Derksen and Verveen, who successfully recorded fluctuations in the resting potential of a frog node of Ranvier.4 - 7 These fluctuations had a power density spectrum inversely proportional to frequency over a range extending from a few Hz to a few kHz. The data of Derksen and Verveen strongly suggest that the fluctuations are due to the transport of potassium ions through the membrane.
Interest in membrane fluctuations has until recently focused primarily on the coding of signals by neurons, and many models of the input-output characteristics of neurons have included ad hoc noisy components (for a review of these models, see Moore, Perkel and Segundo8). It now appears that the transport of ions across nerve membrane is a random process whose mean characteristics only have been determined through the usual voltage-clamp and radioactive tracer experiments. Accordingly, it has been
suggested9 that the detailed study of membrane fluctuations per se might eventually contribute to a better understanding of the nature of nerve-membrane phenomena.
Measuring the electrical noise of nerve membrane presents unusual technical prob-lems. The absolute intensity of the fluctuations is small, perhaps only 10-1000 times larger than the Johnson noise of an equivalent resistance. Low-noise instrumentation is therefore required. Moreover, because of the small size of neural structures, the fluctuations can only be recorded through relatively high-resistance, hence noisy, elec-trodes. For instance, in the preparation used by Derksen and Verveen, the resistance
of the "electrodes," which consisted in the internodal lengths of axoplasm extending under the myelin sheath on either side of a node of Ranvier, was typically 50 M~. These authors, however, have successfully demonstrated that the undesirable noise contributed by these "electrodes" could be substantially reduced by means of crosscorrelation
tech-4 niques.
We have sought to extend the results of Derksen and Verveen by recording the cur-rent noise of the lobster giant axon under voltage-clamp conditions.10, 11 Because of the large (80-120 [i) diameter of this preparation, a typical node produced by the sucrose-gap method presents a relatively low source impedance (e.g., 200 k2 to 1 M2) which makes the design of amplifiers with low noise figure feasible. The sucrose-gap method also yields "electrodes" (the lengths of axoplasm extending under the sucrose gaps) of low (150 kQ-500 kQ) resistance.
The electronic instrumentation designed for conventional voltage-clamp measure-ments, whose desirable characteristics are well known,12 is not suitable for observing the minute current noise of nerve membrane. This comment stems from the properties
(XII. COMMUNICATIONS BIOPHYSICS)
of the transresistance amplifier (voltage-to-current transducer) which the voltage-clamp method necessarily utilizes, and which we shall examine briefly.
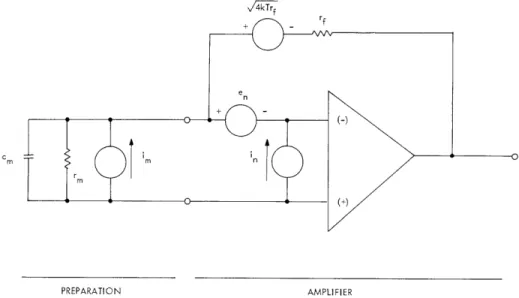
A simplified incremental model of the experimental configuration used to
voltage-clamp a patch of membrane is shown in Fig. XII-1. The "nodal" membrane is repre-sented as a parallel combination of a capacitance, cm, a resistance, rm, and a current noise source, im , whose statistics we wish to study as a function of a number of experi-mental variables. An operational amplifier with equivalent input voltage and current noises en and in (assumed to be uncorrelated) is coupled to the "node" through a feed-back resistance rf (with series Johnson noise source). In this incremental model the resistances of the two axoplasmic "electrodes" in contact with the node are not included. The current electrode can be viewed, however, as lumped with rf, while the voltage electrode contributes an additional Johnson voltage noise which may be lumped with en.
n
PREPARATION AMPLIFIER
Fig. XII-1. Simplified incremental representation of preparation and transresistance amplifier used for recording the fluctuations of membrane current, im , under voltage-clamp conditions.
In order to achieve fast rise times for conventional pulse-clamp experiments, the nodal membrane must be driven by a source of low impedance. This
imped-ance (the input impedimped-ance of the transresistimped-ance amplifier) is proportional to rf and optimum performance is obtained when rf is a minimum. Its value is limited by the series resistance of the current electrode. Fast rise time and wide bandwidth are obtained, however, at the expense of noise performance. It can be shown that the signal-to-noise ratio of the output of the amplifier is given by
.2-S/N=
m
,
(1)
=e Ze 2 1 + 4 1 f r cn
1
n
2
m
2
(4 kT+
+
+ +
-
e
2
rf
r
n2
n
rf
f
m
r
m
where f is the frequency in Hz, k is Boltzmann's constant, and T is the absolute
tem-perature.
Note that S/N improves monotonically with increasing values of rf.
Thus for
instance, if the fluctuations of membrane current were a pure Johnson noise; that is,
if
m = 4kT/r , (2)
m
m
an ideal, noiseless amplifier (e=i
= 0 would yield
S/N = rf/rm. (3)
It is apparent, therefore, that optimum rise time and optimum noise performances lead
to conflicting requirements on the value of rf. In a conventional voltage-clamp system,
where rf is solely the axoplasmic resistance, expression (3) predicts a typical S/N of
1/5.
It is apparent that the possibility of detecting the fluctuations of membrane
cur-rent im with such a system, even if noiseless, is low.
As the feedback resistance rf is increased, the contribution of its Johnson noise
becomes negligible and Eq. 1 tends to
.2
1S/N
m
(4)
1
+ 42f2r2 c
.2
+
m m
en
2
1+
e
n 2 n rIt is important to note that the presence of a membrane capacity c
mbrings about an
effective increase in the undesirable contribution of the voltage noise, e
n, of the
amplifier and of the voltage electrode.
This increase occurs at the rate of 6 dB per
octave of frequency above the natural frequency of the nodal membrane, which is of the
order of 200 Hz in the lobster axon. It is to be expected, therefore, that measurements
of membrane fluctuations may become increasingly difficult in the upper audio-frequency
range.
Field-effect transistors are among the lowest noise devices available for
amplifica-tion over audio frequencies.
Noise figures of a fraction of a decibel and equivalent rms
voltage and current noises as low as 0.02 .V/NrHz and 0.01 pA/NHtz, respectively, can
I I
FREQUENCY (Hz)
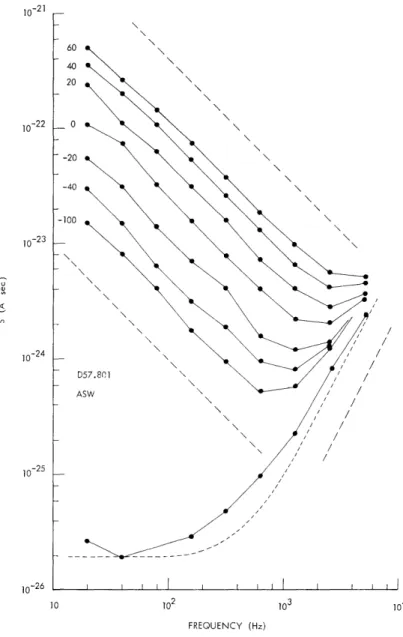
Fig. XII-2. Upper family of curves: Absolute power density spectra, plotted in log-log coordinates, of fluctuations of steady-state membrane current recorded in a node bathed in artificial seawater for clamped membrane potentials ranging from -100 mV to +60 mV. The straight dotted lines have slopes -1 and +2 and indicate the general trends of the data.
Lower dotted and solid curves: Theoretical spectrum for a noiseless amplifier and measurements, respectively, of the current noise recorded on a passive electrical equivalent circuit of a typical preparation with membrane resistance rm of 1 MQ, membrane capacity cm of 910 pF, and axoplasm electrodes of 150 kQ.
10-21 i0-22 60 40 20 -20 -40 -100 057.801 ASW I / / / / I I I I I I I I I
be achieved. The lowest resistance of the axoplasm voltage electrode which can be achieved with the lobster axon in a sucrose gap is of the order of 150 kQ, with corre-sponding Johnson noise of 0.05 [iV/N[ Hz. The contribution of a low-noise FET to the
2
term e in expression (4) is therefore considerably smaller than that of the voltage elec-n
trode. Furthermore, it can be shown that the contribution of the equivalent current .2
noise, in , of such a FET is relatively minor. Thus, for practical purposes, a recording system can be designed whose noise performance is essentially limited by the geometry of the preparation.
The transresistance amplifier that has been developed comprises a low-noise FET headstage (selected 2N4360, Fairchild Corporation) driving a transistorized operational amplifier (P45, Philbrick Researches). The value selected for rf (10 M2) yields a negligible Johnson noise while allowing the amplifier to supply enough direct current for
clamping the nodal membrane over the entire physiological range of membrane potential. The amplifier is coupled to an experimental chamber designed for short sucrose gaps (and hence for minimum electrode resistance). A separate, conventional, fast rise-time voltage-clamp system can also be connected to the preparation in order to per-form pulse-clamp measurements..
Figure XII-2 shows a family of power density spectra S(f) of the current noise of a typical node bathed in a solution of artificial seawater. The data correspond to values
of the clamped membrane potential V m ranging from -100 mV to +60 mV.
For frequencies ranging from 20 Hz to approximately 600 Hz for a negative Vm and to approximately 2 kHz for a large positive Vm , S(f) decreases with increasing
fre-quency. The family of relatively straight lines on these log-log coordinates suggests a -a
relationship of the form S(f) = Nf , where N is a quantity that varies with V , and m a is a constant, whose value is close to i. Beyond this frequency range, S(f) appears to increase. The measurements seem to have little physiological significance in this
region. Control measurements were performed with the preparation replaced by an electric network with comparable resistance and capacitance. The results are shown as the solid curve in the lower part of Fig. XII-2. The dashed curve is a theoretical estimate of the value of the current noise of the system, under the assumption that the amplifier is noiseless. Both curves are in reasonable agreement and show the effect of the membrane capacity discussed above. The spectra recorded from the preparation at high frequencies approaches the spectrum of the control measurements, both in abso-lute intensity and in dependence upon frequency. (Note that the parameters of the pas-sive model are only average estimates and that the incremental membrane resistance rm depends strongly upon V .) At high frequencies S(f) can therefore be plausibly ascribed to an artefact: the noise arising from the nonzero resistance of the voltage-electrode of the preparation and the residual noise of the amplifier compounded by cm This artefact, however, is negligible in the low-frequency region of S(f) where the
(XII. COMMUNICATIONS BIOPHYSICS)
measurements appear to represent the spontaneous fluctuations of membrane current.
Use of the voltage-clamp method has enabled us to measure fluctuations in membrane
current as a function of several experimental variables: membrane potential, mean
membrane current, presence of pharmacological agents such as tetrodotoxin, changes
in the external concentration of potassium, and substitution of lanthanum for external
calcium. These variables produce known effects on the mean membrane current.
The resulting data (described in full in the author's thesis10 and briefly elsewherell)
have supported the conclusion of Derksen and Verveen that the steady-state fluctuations
of membrane current appear to be due to the transport of potassium ions.
D. J. M. Poussart
References
1.
C.
Pecher,
"La fluctuation d'excitabilit6 de la fibre nerveuse," Arch.
Int,
Physiol. 49,
129
(1939).
2.
D. J-M. Poussart, "The Fluctuation of Excitability of a Node of Ranvier,"
Quarterly Progress Report No. 81, Research Laboratory of Electronics, M. I. T.,
April 15, 1966, pp. 213-217.
3. A.
A.
Verveen, Fluctuations in Excitability (Netherlands Institute for Brain
Research, 1961).
4.
H. E. Derksen, "Axon Membrane Voltage Fluctuations," Acta Physiol. Pharmacol.
Neerl. 13, 373 (1965).
5.
H. E. Derksen and A. A. Verveen, "Fluctuations of Resting Neuron Membrane
Potential," Science 151, 1388 (1966).
6. A. A. Verveen, "Fluctuations in Membrane Potentials of Axons and the Problem
of Coding," Kybernetik 2, 152 (1965).
7.
A. A. Verveen, H. E. Derksen, and K. L. Schick, "Voltage Fluctuations of Neural
Membrane," Nature 216, 586 (1967).
8.
G.
P.
Moore,
D. H. Perkel, and J. P.
Segundo,
"Statistical Analysis and
Functional Interpretation of Neuronal Spike Data," Ann.
Rev.
Physiol.
28,
493 (1966).
9.
K. S. Cole, "Membrane Watching," J. Gen. Physiol. 51, 1 (1966).
10.
D. J. M. Poussart, "Current-Noise in the Nerve Membrane: Measurements under
Voltage-Clamp," Ph.D. Thesis, M.I.T., 1968.
11.
D. J. M. Poussart, "Nerve Membrane Current Noise: Direct Measurements under
Voltage Clamp" (to appear in Proc. Nat. Acad. Sci. (U.S.)).
12.
J. W. Moore and K. S. Cole, "Voltage-Clamp Techniques," in: Physical
Tech-niques in Biological Research, W. L. Nastuk (ed.) (Academic Press, New York,
1963).
B. COMPARISON OF TWO MODELS RELATING THE RESTING MEMBRANE POTENTIAL OF SQUID AXON TO ION CONCENTRATIONS
Although the Hodgkin-Huxley modell has been shown to fit a large variety of data concerning the excitation and the conduction of the action potential along a nerve fiber, to our knowledge, there has been no report of an attempt to fit data relating the resting membrane potential to ion concentrations by a direct application of the Hodgkin-Huxley equations. Recently, one of us2 reported results using the Hodgkin-Huxley equations for squid axon membrane, to calculate the dependence of the resting membrane potential on ion concentrations. The results were compared briefly with the experimental data of Baker, Hodgkin, and Shaw3 and also with their calculations. We have repeated4 and extended our calculations, and these are reported here.
Two sets of calculations were performed:
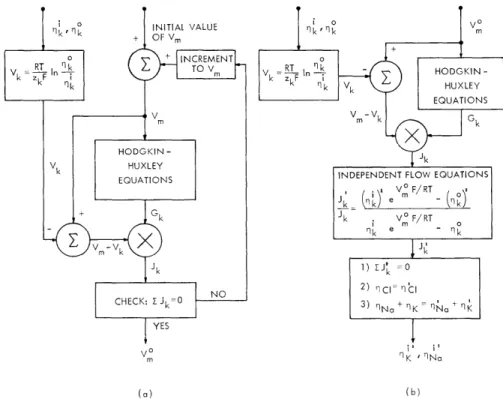
1. The steady-state Hodgkin-Huxley equations alone were used to calculate the rela-tion between the resting membrane potential and changes in the concentrarela-tions of sodium
and potassium ions according to the algorithm shown in Fig. XII-3a. Changes in the
0 k, INITIAL VALUE qk 0 r + OF Vm RT + INCREMENT HDGKIN-Vk = in Vk F In HODGKIN -k q-k z k Vk HUXLEY EQUATIONS m V - Vk Gk HODGKIN- k Vk k EQUATIONS HUXLEY
INDEPENDENT FLOW EQUATIONS k (1i Vm F/RT o) JGk k Vm F/RT I e m k a itk e k J k 1) ZJ'k = 0 CHECK: I Jk=0 NO3) q +rn YES Vm 9K ' Na (a) (b)
Fig. XII-3. Algorithms for calculating the relation between resting poten-tial, V , and ion concentrations: (a) based on Hodgkin-Huxley
m
equations alone, and (b) based on Hodgkin-Huxley equations and independent-flow equations.
(XII.
COMMUNICATIONS BIOPHYSICS)
concentrations of ion species k were assumed to affect the Nernst potential for ion k,
Vk only.
The conductances, Gk, were assumed to be independent of ion concentrations.
The following equations and constants were used:
- 4 3
J
m=G n (V -V
KC)+G .mhNa
3h(V -V)
+ G(Vm-V)
m K Na oC W m Na m2
For resting conditions, J
= 0 and V
= Vo
m
m
m
GK 36 mmho/cm2 , GNa = 120 mmho/cm2 , 0.3 mmho/cm
V
k
FIn
, k = K
,Na,
Cl,
k
zkF
(
k
where
i o
k
and k are the molar concentrations of ion species k on the inside and outside
of the membrane (mM).
R, universal gas constant
=
8. 317 J/Kc
-mol
T, absolute temperature
=
279.
3
0K.
F, Faraday's constant
=
96, 5000 C/mol
zk, valence of the k
t hion
a
n
n n n a m m= m m ah OC =h + 1h'with
-0.01(Vm +50)
an =n -(V
+50)/10
e -1-(V m+60)/80
Pn
=0. 125 e
-0.1(V m+35)
-(V
+35)/10
m
-(V m+60)/20
a = 0.07 e
h
-(V +60)/18 =4.0 e -(V_ +30)/102.
The steady-state Hodgkin-Huxley equations (shown above) relating ionic currents,
Jk to membrane potential, Vm,
k
m
were used for normal ion concentration, 1k'
a
was assumed that for any membrane potential the ionic current Jk, arising from species k at concentration k' can be calculated from the following formula, which is
derivable from the independence principle :
Vo F/RT
,
i'm
o Jk e - kk k k Vo F/RT i m o 7k e - qkThe algorithm used in the calculations is shown in Fig. XII-3b.
The second set of calculations were intended to repeat those reported by Baker, Hodgkin, and Shaw,3 and their published theoretical curves are very close to our cal-culations using the formula for independent flow of ions. All of our calcal-culations were
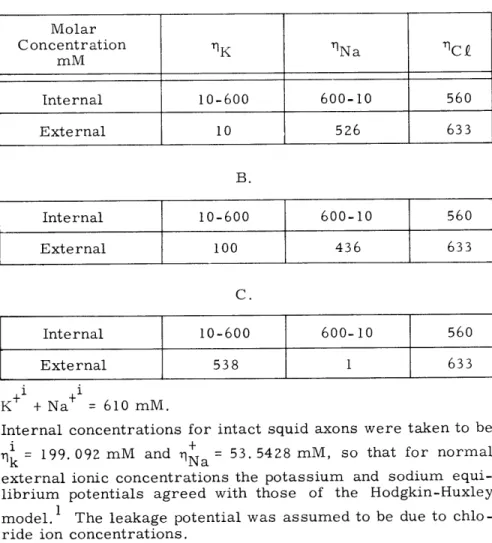
Table XII-1. Ion concentrations used in our calculations.
A.
Molar
Concentration
11
K'INa
"C f
mM
Internal
10-600
600-10
560
External
10
526
633
B.
Internal
10-600
600-10
560
External
100
436
633
C.
Internal
10-600
600-10
560
External
538
1
633
i
i
K+ + Na
= 610
mM.
Internal concentrations for intact squid axons were taken to be
S= 199. 092 mM and
=Na
53. 5428
mM,
so that for normal
external ionic concentrations the potassium and sodium
equi-librium potentials agreed with those of the Hodgkin-Huxley
model. 1 The leakage potential was assumed to be due to
chlo-ride ion concentrations.
INTERNAL CONCENTRATION OF POTASSIUM (mM)
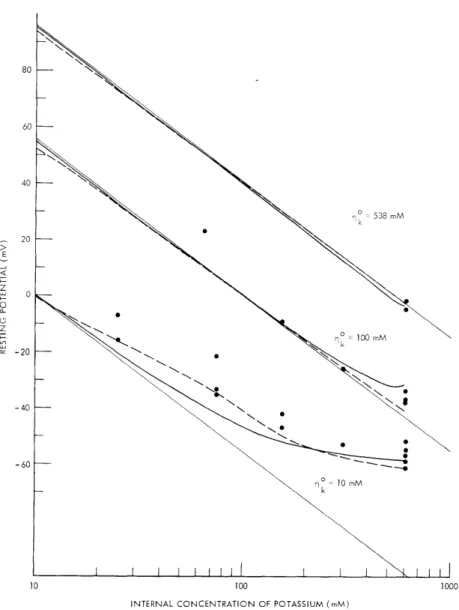
Fig. XII-4. Dependence of resting potential on internal concentration of potassium for three external concentrations of potas-sium. Data points are taken from Baker, Hodgkin, and Shaw.3 Thin straight lines represent the Nernst equilib-rium potentials for potassium ions. Solid curves repre-sent results of calculations based on the Hodgkin-Huxley equations alone. Dashed curves represent results of cal-culations based on the Hodgkin-Huxley equations plus the independent-flow equations.
intended to fit the experimental data of Baker, Hodgkin, and Shaw.3 In these experiments, which used internally perfused squid axons, three solutions with different external
con-centrations of sodium and potassium ions were used, and for each of these solutions the resting potential was measured as a function of the internal concentration of potassium. Table XII-1 lists the ionic composition of the solutions that was assumed for our calcu-lations. They were intended to be identical to the solutions used by Baker, Hodgkin, and Shaw (for almost the entire range of ion concentrations6).
The results of both sets of calculations are shown in Fig. XII-4. It can be seen that both theoretical curves are rather close to each other. Although the calculations based upon the formula for independent flow of ions are closer to the data points, the dif-ferences between the two theoretical curves are smaller than the range of the data points.
Thus we conclude that the Hodgkin-Huxley equations alone appear to be sufficient to fit data on the dependence of resting potential on changes in the concentration of sodium and potassium ions for these experiments. These equations appear to fit the resting-potential data about as well as calculations based upon the equations for independent flow of ions. Under these circumstances, there may be reason to prefer the Hodgkin-Huxley equations as a description of the data. First, there is some question of whether the equations of independent flow fit all of the experimental data. The independent-flow equa-tions have been used to fit changes in both sodium5 and potassium currents resulting from changes in the respective ion concentrations across voltage-clamped nerve mem-brane. Radioactive tracer experiments 8 appear to show, however, that labelled potas-sium ions do not flow independently through the membrane. Second, the Hodgkin-Huxley equations already account for many of the electrical properties of nerve membrane. Therefore it is more efficient simply to add one more item to the catalog of nerve-membrane phenomena fit by the Hodgkin-Huxley equations than it is to maintain a separate model for the resting-potential data. Finally, it is not clear that the equation of independent flow is consistent with the Hodgkin-Huxley equations. Since in theory the Hodgkin-Huxley equations are a complete set which can be solved for the resting poten-tial for various ion concentrations (through appropriate modifications of the Nernst potentials and assuming that ionic conductances are independent of concentration), the addition of the equation of independent flow may lead to an inconsistency. 9
P. Demko, Jr., T. F. Weiss
References
1. A. L. Hodgkin and A. F. Huxley, "A Quantitative Description of Membrane Current and Its Application to Conduction and Excitation in Nerve," J. Physiol. 117, 500-544 (1952).
2. P. Demko, "Hybrid Simulation of Hodgkin-Huxley Model for Nerve Membrane," Quarterly Progress Report No. 89, Research Laboratory of Electronics, M. I. T., April 15, 1968, pp. 258-266.
(XII. COMMUNICATIONS BIOPHYSICS)
3. P. F. Baker, A. L. Hodgkin, and T. I. Shaw, "The Effects of Changes in Internal Ionic Concentrations on the Electrical Properties of Perfused Giant Axon," J. Physiol. 164, 355-370 (1962).
4. The previous results were obtained from a hybrid computer simulation of the dynamic Hodgkin-Huxley equations. It was found that for certain limited ranges of ion concentrations the simulation of the Hodgkin-Huxley equations oscillated. We believe these oscillations are not an artefact of the simulation. Nevertheless, the calculations of the dependence of resting potential on ion concentration have been repeated on a PDP 8/L digital computer. This time the steady-state Hodgkin-Huxley equations were used. The two sets of calculations agreed for ranges of con-centrations for which the hybrid simulation showed no oscillations.
5. A. L. Hodgkin and A. F. Huxley, "Currents Carried by Sodium and Potassium Ions through the Membrane of the Giant Axon of Loligo, " J. Physiol. 116, 449-472 (1952). 6. Baker, Hodgkin and Shaw used internal perfusion solutions whose sodium and
potas-sium ion concentrations were in the range from "0" to 610 mM and included external solutions whose sodium concentration was "zero." Their calculations also covered this range of ion concentrations. The lower limit of internal concentration of ions for our calculations was 10 mM and the lowest value for the external concentration of sodium was 1 mM. We feel that an ion concentration of "zero" is impossible to achieve experimentally and leads to theoretical difficulties. For "zero" ion con-centrations the Nernst potential is undefined. Although the calculations using the Hodgkin-Huxley equation plus the equations for independent flow can be performed for an ion concentration which is zero, the calculations based upon the Hodgkin-Huxley model alone cannot be performed.
7. B. Frankenhaeuser, "Delayed Currents in Myelinated Fibers of Xenopus Laevis Investigated with Voltage Clamp Technique," J. Physiol. 160, 40-45 (1962). 8. A. L. Hodgkin and R. D. Keynes, "The Potassium Permeability of a Giant Nerve
Fibre," J. Physiol. 128, 61-88 (1955).
9. This theoretical inconsistancy can be checked in the following manner: For a given membrane potential, Vm , and normal concentrations, rk, the Hodgkin-Huxley equa-tions can be used to calculate the ionic conductances, Gk , and ionic currents, Jk"
The independent flow equations can be used to calculate the ionic currents, J', for
k
a new set of ion concentrations, k. Given the formula, Jk = G'(Vm-V') one can calculate either the value of: (1) Vk assuming Gk = Gk , or (2) Gk assuming VkR
.=
k
i
kgYIn
(k/k
. In all of these calculations we have assumed that resting condi-tions hold, Z Jk = 0 and Z Jk = 0. Preliminary calculations indicate that if condi-tion (1) is assumed then Vk # Innk/n
and if condition (2) is assumed thenGk # Gk and the ionic conductances depend upon the ion concentrations. The results of experiments may enable us to decide which if any of these calculations have validity.
C. ALTERNATE ROUTE FOR ACOUSTIC STIMULATION OF A LIZARD INNER EAR
The receptor organ in the inner ear of a species of lizard (Gerrhonotus multi-carinatus) has some anatomical features that make it an interesting subject for electro-physiological measurements. 1 For purposes of advancing a microelectrode into the
sensory papilla it may be desirable to remove the middle-ear structures and direct the electrode through the oval window. In this case the sound stimulus can be delivered to the round window. Measurements were designed to determine the effectiveness of acous-tic stimuli delivered by this route relative to stimuli delivered to the external ear in the normal way.
Our method was to measure cochlear potential responses recorded from a wire elec-trode placed on the surface of the otic capsule over the cochlear duct. Stimuli were first applied to the external ear, and then to the round window after removal of the middle ear.
Preliminary results indicate that equivalent cochlear responses are obtained when the sound pressure applied to the round window is approximately 35 dB higher than that applied outside the tympanic membrane. This figure represents an average based on measurements in a few animals with both sinusoidal and impulsive stimuli.
R. R. Zimmerman, M. J. Mulroy (Michael J. Mulroy is an NIH Postdoctoral Fellow in Otolaryngology at Eaton-Peabody
Laboratory, Massachusetts Eye and Ear Infirmary.)
References
1. M. J. Mulroy, "Ultrastructure of the Basila Papilla of Reptiles," Doctoral disserta-tion in Department of Anatomy, University of California, San Francisco, 1968.
D. AUTOMATED SYSTEM TO CONTROL STIMULUS AND MEASURE RESPONSE VARIABLES IN EXPERIMENTS ON THE AUDITORY SYSTEM
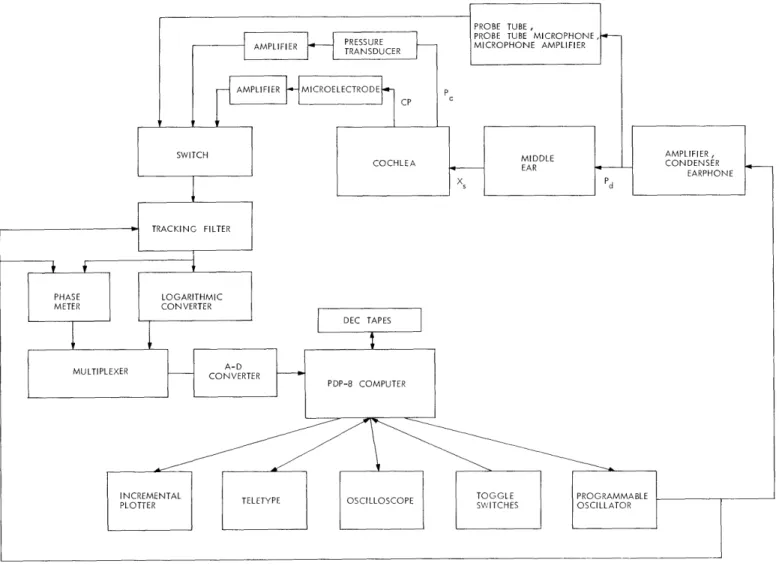
A computer systeml has been developed for controlling the amplitude, frequency, and duration of tones delivered to the ear of an experimental animal. The system can be used to measure any one of the following response variables: the voltage output of a microphone used to measure the sound pressure at the eardrum, the potential recorded by an electrode inserted into the cochlea, the voltage output of a pressure transducer used to measure acoustic pressure in the cochlea, or any other voltage response.
The system is capable of calculating and plotting frequency responses and transfer functions of cochlear response variables obtained with the level of any one of the fol-lowing stimulus variables held constant: the output voltage of the oscillator (used to drive a condenser earphone as the sound source), the sound pressure at the drum mem-brane (monitored through a calibrated probe tube), the stapes displacement (calculated from the measured drum pressure and an average transfer function of the middle ear of the cat2) or the stapes velocity. Furthermore, any of the response variables can be measured as a function of the stimulus level with the stimulus frequency held constant. A schematic diagram of the system is shown in Fig. XII-5. A PDP-8 computer con-trols the amplitude and frequency of a programmable oscillator. The oscillator drives
,O
O PROBE TUBE,
PROBE TUBE MICROPHONE -AMPLIFIER PRESSURE MICROPHONE AMPLIFIER
I'D TRANSDUCER_
Ln
AMPLIFIER MICROELECTRODE P
CP
SWITCH MIDDLE AMPLIFI
COCHLEA EAR CONDEI
EAEA X5 I Pd TRACKING FILTER PHASE LOGARITHMIC METER CONVERTER DEC TAPES MULTIPLEXER A-D CONVERTER PDP-8 COMPUTER
INCREMENTAL TELETYPE OSCILLOSCOPE TOGGLE PROGRAMMABLE
PLOTTER SWITCHES OSCILLATOR
Fig. XII-5. Diagram of a system to control stimulus and measure response
Fig. XII-6. Cochlear potential vs frequency at constant drum pressure recorded with a gross electrode on the surface of the coch-lea of a cat. The bony septum separating the middle ear and bulla cavities was opened. The animal had received a small dose of the ototoxic drug, kamamycin. Upper curve shows the phase response in hundredths of a period (00 = 0 and -360' = -100) for 110 dB SPL. Lower curves repre-sent the magnitude of the cochlear potential in dB relative to 1 iV rms for drum pressures from 110 to 55 dB SPL. The cochlear potential (magnitude and phase) was mea-sured at 120 points in frequency. For each point, there was an initial delay of 400 ms, after which the computer took alternate samples of the magnitude and phase every
5 ms for a period of 400 ms. The average values of these 40 magnitude and 40 phase measurements are plotted and connected by straight lines. A symbol is plotted for every 1 2th point to facilitate identification of the curve. (The identification symbol, its size, and spacing were con-trolled by toggle switches.) The sequence of sweeps at constant drum pressure was accomplished by pushing one button after an initial set of commands was given to the computer. During the experiment, the data were plotted on an incremental plotter and stored on DECtape. The entire figure was generated by the computer using data stored on DECtape.
a condenser earphone that generates tones that are delivered to the ear of the experi-mental animal. The response to the tones is fed to a tracking filter (a 2-Hz bandpass electrically tuned filter) tuned to the oscillator's frequency. The output of the tracking filter drives a phase meter and a logarithmic converter. The magnitude (in dB) and phase of the fundamental component of the response are fed into the computer through a two-channel signal multiplexer and an A-D converter.
Note that the output voltage of the programmable oscillator passes through several frequency-dependent filters (the sound-generating system and the middle ear). Similarly, the pressure at the eardrum can be measured, but only after this signal has passed through several frequency-dependent filters (a probe tube, microphone, and amplifier). Since the frequency dependence of each of these filters (except the middle ear) is mea-sured during the calibration procedure at the beginning of each experiment, and since each of these filters (with the possible exception of the middle ear) can be regarded as linear and time-invariant, the computer can use this information to calculate the required values of the frequency and voltage of the programmable oscillator to achieve some constant stimulus condition (such as constant drum pressure or stapes displace-ment).
The data shown in Fig. XII-6 were obtained in an experiment with a cat as the exper-imental animal. The data are intended to illustrate the method only. The cochlear potential recorded with a gross electrode on the surface of the cochlea is shown as a function of frequency. Each curve was obtained for a constant amplitude of the
sure at the eardrum. The constancy of the pressure was verified by measuring the pres-sure at the eardrum vs frequency at 100 dB SPL.
The system is designed to operate over the frequency range from 20 Hz to 20 kHz (this range is limited largely by the frequency response of the peripheral equipment -the tracking filter and logarithmic converter), and calculations are made, at present, at a
maximum of 120 points in frequency (spaced equally along a logarithmic scale). The precision and accuracy of the frequency is determined by the characteristics of the pro-grammable oscillator (Wavetek, Model 157). The system now operates over a dynamic range of amplitudes of response variables of 60 dB (80 dB for signals with a high signal-to-noise ratio) for a single sweep in frequency. Range switches are used to extend the
dynamic range for multiple sweeps. In principle, the measurements should be accurate within 0. 3 dB for amplitudes and 3. 60 for phase (the accuracy of the A-D converter). Preliminary experiments lead us to believe that the system will achieve measurements of magnitude accurate within 1 dB.
The computer sweeps the level or frequency in discrete steps from one stimulus to another. After an initial delay following a change in stimulus, the magnitude and phase signals are sampled alternately and average values of both magnitude and phase are cal-culated. The values of the initial delay and the averaging time interval are set by toggle
(XII. COMMUNICATIONS BIOPHYSICS)
switches. The data and parameters from any run can be stored on DECtape. Since the frequency responses and transfer functions are in absolute units (rms amplitudes are
expressed in dB relative to a standard reference level: 0. 0002 dynes/cm2, for pressure, 1 pLm/sec for velocity, 1 A for displacement, and 1 [MV for voltage), it is convenient to compare data obtained in different runs. At present, it is possible to calculate the prod-uct or the quotient of two complex frequency responses or transfer functions that are stored on DECtape and to plot the result. We plan to write programs to transform and combine data in other useful ways.
T. F. Weiss, G. M. Goldmark, D. W. Altmann, R. M. Brown References
1. G. M. Goldmark, "Computer Control of Stimulus-Response Variables in Auditory Experiments, " S. M. Thesis, Department of Electrical Engineering, M. I. T., June 1969.
2. J. J. Guinan and W. T. Peake, "Middle-Ear Characteristics of Anesthetized Cats," J. Acoust. Soc. Am. 41, 1237-1261 (1967).
E. PSYCHOPHYSICS
As stated in previous reports, two of our principal projects concern the development of (i) a unified theory of intensity resolution, and (ii) a theory of binaural hearing based on auditory-nerve data. We have described our preliminary theory of intensity resolu-tion1 (which has now been published) our analysis of the limitations on interaural dis-crimination imposed by the random variations in the firing patterns on the auditory nerve,3 and some psychophysical experiments on interaural discrimination4 (which will soon be available 5 , 6) that were performed to help guide the development of the binaural-hearing theory. In this report, we describe some further binaural experiments, a small portion of the instrumentation work related to the development of our laboratory
facil-ities, and a project concerned with bat sonar. In future reports, we shall describe the experiments performed to test the theory of intensity resolution, the more recent the-oretical work on binaural hearing, and the substantial improvements that have been made
in our laboratory facilities.
N. I. Durlach
1. EXPERIMENTS ON BINAURAL HEARING a. INTERAURAL TIME DISCRIMINATION
In most experiments on interaural time discrimination the just noticeable difference (jnd) in interaural time has been measured only for the case in which the interaural
amplitude ratio AR/AL is unity and the interaural time delay T is zero. In the recent study by Hershkowitz,4 the interaural time jnd (AT)0 was measured for a 500-Hz tone
as a function of T (with AR/AL = 1) and as a function of AR/AL (with r = 0). Three aspects of this study that are relevant to the present series of experiments are the fol-lowing. First, the study did not include measurements of (AT) for cases in which AR/AL - 1 and T * 0, simultaneously. Second, the study suggested that for T = 750 ILs,
the discrimination task may become very difficult, and that for values of T greater than this critical value, the lateralization cue used in making the discrimination tends to
reverse its direction (in the sense that a larger time lead to the left ear produces a sub-jective image farther to the right). Third, the study suggested that (AT)0 increases when
T = 0 and the ratio AR/AL is moved away from unity by increasing either AR or AL . All three of these features made it necessary to conduct additional experiments in order to help guide the development of the binaural hearing theory. 3
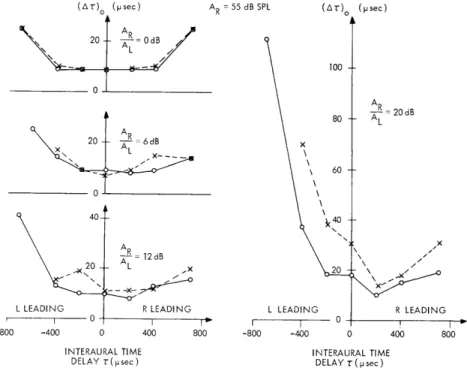
In the major experiment,7 the jnd (AT) for a 300-ms burst of 500-Hz tone (with rise and decay times of 50 ms) was measured as a simultaneous function of T and AR/AL. The values of (AR/AL, T) that were tested included all pairs from the sets T = 0, ±200, ±400, ±700 ls and AR/AL= 6, 12, 20 dB, plus the values T= 0, 200, 400, 700, 1000 Ls at
AR/AL = 0 dB. In all cases, AR was maintained at 55 dB SPL. The psychophysical method was symmetric, two-interval, two- alternative-forced- choice, plus feedback, and psychometric functions (based on roughly 6 points per function and 50 trials per point) were obtained for each value of (AR/AL, T). The jnd (AT) was defined as the increment AT for which the responses were 75% correct. Two subjects (with clinically normal hearing) were employed, one experienced, and the other pretrained for roughly 8 hours. Also, before the psychometric functions were obtained, each subject had an average of roughly 2000 trials of practice for each value of AR/AL'
The results of this experiment are shown in Fig. XII-7. Positive values of T cor-respond to the right ear leading (so that when AR/AL > 1 and T > 0, amplitude and time reinforce each other with respect to lateralization), whereas negative values of T correspond to the left ear leading (so that when AR/AL > I and T < 0, amplitude and time counteract each other with respect to lateralization). In the graph for AR/AL = 1, we have assumed that the system is symmetric and plotted points for negative T (not actually measured) at the same values as the results for positive T. No points are plotted for Subject 2 at (6,-700), (12,-700), and (20,-700), because we were unable to obtain reliable results for these cases (rough estimates indicated that the jnd for these cases was greater than 100 s).
The important properties of the data shown in Fig. XII-7 can be summarized as fol-lows. First, the dependence of (AT)o on T becomes asymmetric about T = 0 as AR/AL becomes appreciably greater than unity. Second, the value of (AT)0 at (AR/AL, --T) is
(XII. COMMUNICATIONS BIOPHYSICS)
always greater than or equal to the value of (AT)o at (AR/AL' T), and when AR/AL is
much greater than unity, the value of T for which (AT)° is a minimum is greater than zero. Third, the minimum value of (AT)o obtained for a fixed value of AR/AL depends
only very weakly upon AR/AL.
The subjective impressions experienced by the subjects were generally consistent with the data: When amplitude and time reinforced each other, the image was relatively sharp; when they counteracted each other, the image was relatively diffuse. In all cases, the cue appeared to be that of lateralization. For the points (12, -700) and (20, -700), however, the movement of the cue reversed direction. Also, for the cases (6, -700), (12, -700), and (20, -700), Subject 2 found the discrimination task extremely confusing.
These results are roughly consistent with those of Hershkowitz, except that the jnd's tend to be somewhat smaller, the increase in (AT)o with T for AR/AL = 1 occurs some-what more slowly, the increase in (AT)o with AR/AL for T = 0 occurs somewhat more
slowly, and somewhat less difficulty was encountered in discrimination for cases in which AR/AL= 1 and T is large. Furthermore, it can be shown7 that these results are consistent with an extension of the model developed by J. L. Hall in connection with his neurophysiological work on the accessory superior olivary nucleus. 8
A comparison of
(At) (pisec) AR =55 dB SPL (Ar) (psec)
A R 20 = 0dB 100 0 A RS20dB 80 AL 20 = 6dB S60 0 40- 40 AR x S 12dB L 220 L
L LEADING R LEADING L LEADING R LEADING
F T 0 I I I I 0
-800 -400 0 400 800 -800 -400 0 400 800
INTERAURAL TIME INTERAURAL TIME
DELAY r(psec) DELAY r(psec)
Fig. XII-7. Dependence of interaural time jnd (AT)° on interaural time delay T and interaural amplitude ratio AR/AL. Circles denote results for Subject 1, and crosses for Subject 2. Results for
AR/AL= 0 dB and r = 1000
ps
(not shown on graph) were (AT) = 33pLs
for Subject 1, and (AT)o = 50p.s
for Subject 2.chese data with the model of binaural hearing based on auditory-nerve data3 (mentioned above) will be considered in a future report.
In two additional experiments,9, 10 attempts were also made to extend the work of Hershkowitz by briefly exploring how the difficulties in interaural time discrimination for AR/AL = l and large values of T would be affected by lowering the tone frequency,
and by checking the result that interaural time discrimination is degraded as AR/AL is moved away from unity by increasing either AR or AL. The results of the first experi-ment (in which we used a tone frequency of 250-Hz and only one subject) tend to con-firm the notion that the critical point where cue reversals begin is frequency-dependent, and the results of the second experiment (in which we used a tone frequency of 500-Hz and, again, only one subject) support the previous result on the effect of increasing either AR or AL .
R. H. Domnitz, J. D. Hild, C. Mpagazehe
b. MONAURAL DETECTION WITH CONTRALATERAL CUEING
It is well known that a human's ability to detect a signal in a background of noise when the signal and noise are presented to only one ear and the human has been previously exposed to the signal is considerably worse than the ability of the ideal receiver to per-form the same task. It is also known that the difference between the human and the ideal
receiver tends to decrease as the amount of signal uncertainly increases. Thus, it has often been suggested that the difference between the two systems may, in large part, be the result of the human's inability to make effective use of the signal exposure and that he actually operates with a considerable amount of signal uncertainty. In an attempt to explore this hypothesis, M. M. Taylor and his associates have recently performed a series of experiments in which the need for storing a representation of the signal is eliminated by presenting the signal on each trial to the opposite ear ("contralateral cueing").11-13 His results indicate that, for certain combinations of interaural ampli-tude and interaural phase (i. e., the ampliampli-tude and phase of the cue signal relative to the target signal), the human's performance is very close to that of the ideal receiver,
whereas for other combinations, it is even worse than when the cue is omitted entirely (i. e., the presentation is purely monaural).
In the present experiment,1 4 the target signal was a 500-ms burst of 500-Hz tone, the noise resulted from passing white Gaussian noise through a lowpass filter with cut-off frequency 2000-Hz, and the experimental method was two-interval, two-alternative-forced-choice, plus feedback. The noise was pulsed on and off with the signal, the signal level was maintained at 55 dB SPL, and variations in the signal-to-noise ratio E/No (where E equals signal energy, and No equals noise power per cycle) were achieved by varying the level of the noise. The cue was identical to the target except
(XII. COMMUNICATIONS BIOPHYSICS)
for phase (which was an experimental parameter) and was presented on each interval of each trial, except for those runs in which the presentation was purely monaural (per-formed for purposes of comparison). Four subjects were employed and psychometric functions were obtained for interaural phases separated successively by 300.
The results of this experiment showed that (i) the psychometric functions obtained with the cue are generally less steep than those obtained without the cue (a result that is consistent with the idea that the cue reduces the uncertainty); (ii) the level of perfor-mance depends upon the interaural phase; and (iii) the presence of the cue never improves performance (a result that is inconsistent with both the results of Taylor's experiments and with the signal uncertainty interpretation). Although there are dif-ferences between this experiment and those of Taylor, no satisfactory explanation has yet been found for the discrepancy between our third result and the results obtained by Taylor.
S. F. Grundfest
2. INSTRUMENTATION
a. FOUR-QUADRANT MULTIPLIER
A four-quadrant analog multiplier utilizing integrated circuit elements was designed 15
and constructed. The multiplication was achieved by using the variable transconduc-tance method. This method is ideally suited to integrated transistor arrays, since it exploits the integrated circuit virtues of close matching of element parameters, excel-lent thermal tracking between elements, and the availability of many active elements at low cost. The multiplier is well-suited for use as a balanced modulator at audio fre-quencies, having a carrier suppression of -60 dB and 0. 5% distortion up to 10 kHz.
J. Yu
b. SOLID-STATE RANDOM NOISE GENERATOR
A solid-state, general-purpose, noise source was designed and constructed.1 6 The source, which utilizes a special zener diode, is compact, has a flat frequency spectrum to 0. 5 MHz, and compares favorably with commercially available units with respect to
its Gaussian amplitude distribution (as well as to its cost).
G. R. Ladd 3. FEASIBILITY OF ELECTRONIC SPOOFING OF BAT SONAR
Despite the large amount of information on the sonar systems of bats that is now available, there is still very little known about which properties of the returned echo sequence actually serve as cues for determining the bat's behavior (in tasks such as, for
example, detection, pursuit, and capture of flying insects). One possible approach to this
problem is to develop a method for controlling the echo sequence and observing how the
bat's behavior varies with changes in the properties of this sequence. A crude
realiza-tion of this approach, which has been used in a variety of experiments,17 is to select a
set of targets with known scattering properties, propel these targets (one at a time on
successive trials) into the spatial region in front of the bat, and observe how the bat' s
behavior varies as a function of the target (and its orientation and trajectory). This
real-ization is extremely limited, however, because the control over the echo sequence is
very imprecise and inflexible. A much more promising technique (but much more
dif-ficult to achieve) would be to develop instrumentation that would permit the
experi-menter to receive each pulse emitted by the bat and to quickly rebroadcast it in
such a manner that the sequence of signals seems to the bat like a sequence of echoes
from a target (i. e., to create an imaginary target).
Once such a "spoof" had been
achieved, it would then be relatively simple to modify the "echo" sequence in a
pre-cise and flexible manner, by using electronic devices to operate on the signals before
rebroadcasting them, and to observe the correlation between the bat's behavior and the
characteristics of the signal sequence.
A preliminary study of this technique was
con-ducted in order to determine its feasibility, and it was concluded that the technique was
sufficiently promising to warrant a more detailed analysis.18
R. A. McPherson
Footnotes and References
1.
N. I. Durlach and L. D. Braida, "Psychophysics of Intensity Resolution," Quarterly
Progress Report No. 91, Research Laboratory of Electronics, M. I. T., October 15,
1968, pp. 240-249.
2. N. I. Durlach and L. D. Braida, "Intensity Perception. I.
Preliminary Theory
of Intensity Resolution," J. Acoust.
Soc. Am.,
Vol. 46, Part 2, pp. 372-383,
1969.
3.
H. S. Colburn, "Preliminary Work on a New Model of Binaural Hearing," Quarterly
Progress Report No. 87, Research Laboratory of Electronics, M. I. T., October 15,
1967, pp. 170-177.
4.
R. M. Hershkowitz, "Discrimination of Interaural Time and Intensity Off the
Mid-line," Quarterly Progress Report No. 87,
Research Laboratory of Electronics,
M.I.T., October 15, 1967, pp. 177-181.
5.
R. M. Hershkowitz and N. I. Durlach, "Interaural Time and Amplitude jnd's for a
500-Hz Tone" (to appear in Journal of the Acoustical Society of America).
6.
R. M. Hershkowitz and N. I. Durlach, "An Unsuccessful Attempt to Determine the
Tradability of Interaural Time and Interaural Intensity" (to appear in Journal of the
Acoustical Society of America).
7.
R. H. Domnitz, "Auditory Discrimination of Interaural Time, " S. M. Thesis,
Depart-ment of Electrical Engineering, M. I. T., 1968.
8.
J. L. Hall, "Binaural Interaction in the Accessory Superior-Olivary Nucleus of the
Cat," J. Acoust. Soc. Am. 37, 814-823 (1965).
(XII. COMMUNICATIONS BIOPHYSICS)