HAL Id: hal-01492688
https://hal.archives-ouvertes.fr/hal-01492688
Submitted on 22 Mar 2017
HAL is a multi-disciplinary open access
archive for the deposit and dissemination of sci-entific research documents, whether they are pub-lished or not. The documents may come from teaching and research institutions in France or abroad, or from public or private research centers.
L’archive ouverte pluridisciplinaire HAL, est destinée au dépôt et à la diffusion de documents scientifiques de niveau recherche, publiés ou non, émanant des établissements d’enseignement et de recherche français ou étrangers, des laboratoires publics ou privés.
Modelling T cell proliferation: Dynamics heterogeneity
depending on cell differentiation, age, and genetic
background
Julien Vibert, Véronique Thomas-Vaslin
To cite this version:
Julien Vibert, Véronique Thomas-Vaslin. Modelling T cell proliferation: Dynamics heterogeneity depending on cell differentiation, age, and genetic background. PLoS Computational Biology, Public Library of Science, 2017, 13 (3), pp.e1005417. �10.1371/journal.pcbi.1005417�. �hal-01492688�
Vibert, J. and V. Thomas-Vaslin (2017). PLos Comput Biol 13 (3): e1005417. http://journals.plos.org/ploscompbiol/article?id=10.1371/journal.pcbi.1005417
1
Modelling T Cell Proliferation: Dynamics Heterogeneity Depending on
1
Cell Differentiation, Age, and Genetic Background
2
Julien VIBERT1, Véronique THOMAS-VASLIN1* 3
1Sorbonne Universités, UPMC Univ Paris 06, INSERM, Immunology-4
Immunopathology-Immunotherapy (I3) UMRS959; Paris, France 5
Short Title: Modelling T Cell Proliferation in aging
6 *Corresponding author 7 Email: [email protected] (VTV) 8 9 10 11 12 13 14 15 Abbreviations 16 BrdU : Bromo-deoxyuridine 17 EdU: 5-ethynyl-2'-deoxyuridine 18
ODE: Ordinary Differential Equation 19
DP: double positive thymocyte CD4+CD8+ 20
TN: triple negative thymocyte CD4-CD8-CD3 -21
Treg: regulatory T cells 22
23
Key words: cell proliferation; modelling immune system; aging; lymphocyte dynamics;
24
cell differentiation; cell death; cell cycle; flow cytometry; mathematical model; state 25
transition diagram 26
27 28
Vibert, J. and V. Thomas-Vaslin (2017). PLos Comput Biol 13 (3): e1005417. http://journals.plos.org/ploscompbiol/article?id=10.1371/journal.pcbi.1005417
2
Abstract
29
Cell proliferation is the common characteristic of all biological systems. The 30
immune system insures the maintenance of body integrity on the basis of a continuous 31
production of diversified T lymphocytes in the thymus. This involves processes of 32
proliferation, differentiation, selection, death and migration of lymphocytes to peripheral 33
tissues, where proliferation also occurs upon antigen recognition. Quantification of cell 34
proliferation dynamics requires specific experimental methods and mathematical 35
modelling. Here, we assess the impact of genetics and aging on the immune system by 36
investigating the dynamics of proliferation of T lymphocytes across their differentiation 37
through thymus and spleen in mice. Our investigation is based on single-cell multicolour 38
flow cytometry analysis revealing the active incorporation of a thymidine analogue 39
during S phase after pulse-chase-pulse experiments in vivo, versus cell DNA content. A 40
generic mathematical model of state transition simulates through ODEs the evolution of 41
single cell behaviour during various durations of labelling. It allows us to fit our data, to 42
deduce proliferation rates and estimate cell cycle durations in sub-populations. Our model 43
is simple and flexible and is validated with other durations of pulse/chase experiments. 44
Our results reveal that T cell proliferation is highly heterogeneous but with a specific 45
“signature” that depends upon genetic origins, is specific to cell differentiation stages in 46
thymus and spleen and is altered with age. In conclusion, our model allows us to infer 47
proliferation rates and cell cycle phase durations from complex experimental 5-ethynyl-48
2'-deoxyuridine (EdU) data, revealing T cell proliferation heterogeneity and specific 49
signatures. 50
Vibert, J. and V. Thomas-Vaslin (2017). PLos Comput Biol 13 (3): e1005417. http://journals.plos.org/ploscompbiol/article?id=10.1371/journal.pcbi.1005417
3
Author summary
52
We assess the impact of genetics and aging on immune system dynamics by 53
investigating the dynamics of proliferation of T lymphocytes across their differentiation 54
through thymus and spleen in mice. Understanding cell proliferation dynamics requires 55
specific experimental methods and mathematical modelling. Our investigation is based 56
upon single-cell multicolour flow cytometry analysis thereby revealing the active 57
incorporation in DNA of a thymidine analogue during S phase after pulse-chase 58
experiments in vivo, versus cell DNA content. A generic mathematical model that 59
simulates the evolution of single cell behaviour during the experiment allows us to fit our 60
data, to deduce proliferation rates and mean cell cycle phase durations in sub-populations. 61
This reveals that T cell proliferation is constrained by genetic influences, declines with 62
age, and is specific to cell differentiation stage, revealing a specific “signature” of cell 63
proliferation. Our model is simple and flexible and can be used with other pulse/chase 64 experiments. 65 66 67 68
Vibert, J. and V. Thomas-Vaslin (2017). PLos Comput Biol 13 (3): e1005417. http://journals.plos.org/ploscompbiol/article?id=10.1371/journal.pcbi.1005417
4
Introduction
69
Cell division is a characteristic of biological systems, with variability of rates of 70
proliferation and interphase duration according to the type of organism, organ, and period 71
of life. In the immune system, cell proliferation is essential for the high turnover of 72
diversified lymphocytes that insures dynamic cognitive function and maintenance of 73
body integrity. The production of T cells occurs through processes of proliferation, 74
differentiation, migration, selection and death in the thymus to finally export less than 6% 75
of cells to peripheral tissues as naïve T cells (1). T cells circulate through the whole 76
organism and interact with environmental and body antigens to proliferate and 77
differentiate into effector/memory T cells upon antigenic recognition. Quantification and 78
interpretation of lymphocyte dynamics remains a challenge in systems immunology (2, 79
3). Studies on T cell dynamics at various ages have questioned the mechanisms of thymic 80
involution (4) beginning at puberty, followed by immuno-senescence and inflammation 81
with aging (5), and physiological accumulation of effector/memory peripheral T cell 82
clones, particularly of CD8 phenotype, in both aged humans (6) and mice (7). Although 83
the number of T cells decreases with aging, promiscuous CD4 T cells accumulate (8). 84
Thymic hypoplasia or thymectomy in young individuals also affects the repertoire of 85
peripheral T cells and immunocompetence (9). Thus, thymic production is primordial so 86
as to maintain a homeostatic and dynamic equilibrium in terms of cell populations and 87
repertoires, thereby allowing an effective and adaptive immune surveillance. Sequential T 88
cell development and CD4/CD8 lineage decision models were previously described (10-89
13). However, there remain open questions concerning the rates of thymocyte production 90
that result from various processes, such as differentiation, proliferation, selection, and 91
death of T cells, and that influence the homeostasis and life-span of naïve and 92
Vibert, J. and V. Thomas-Vaslin (2017). PLos Comput Biol 13 (3): e1005417. http://journals.plos.org/ploscompbiol/article?id=10.1371/journal.pcbi.1005417
5
effector/memory T cells in secondary lymphoid organs. Several theoretical approaches 93
and experimental immunological protocols are available to investigate lymphocyte 94
dynamics (3) and to model them (14). A number of studies have tried (15-17), often with 95
the help of modelling (1, 18-21), to quantify thymocyte production, thymic output, and 96
the processes involved in maintenance of a T lymphocyte dynamic equilibrium in the 97
periphery in humans or mice (1, 22-26). It was suggested that the naïve T cell pool is 98
maintained by peripheral division in humans, at variance to thymic output in mice, and 99
with significant differences in lifespan of CD8 peripheral T cells in young and old 100
C57BL/6 mice (27). Some findings also suggested different genetic regulations of thymic 101
output according to strains of mice (28). The flexibility of T cell behaviour has already 102
been approached, in particular for peripheral cells (29), but references concerning 103
quantitative proliferation are still lacking. 104
Altogether, these studies were performed with various experimental methods, on 105
various species, strains, ages, and cell populations. Consequently, no clear consensus has 106
been reached concerning the influence of genetics and age on T cell dynamics. We have 107
previously observed that both the genetic background and aging affect T cell dynamics 108
and repertoires (30). Indeed, C57BL/6 and FVB mice differ in their T cell composition at 109
steady state but also in their kinetics of T cell reconstitution after a transient 110
immunosuppression. In FVB mice, there is an acceleration of thymic involution and of 111
the immunological aging quantified by alterations in the homeostatic control of 112
lymphocyte numbers and repertoire diversity in the periphery (30). 113
To determine whether or not the differences in the dynamic behaviour of T cells 114
previously observed between the FVB and B6 mice strains are related to the proliferation 115
capacities of T cells during their differentiation, we assayed cell proliferation in vivo by 116
Vibert, J. and V. Thomas-Vaslin (2017). PLos Comput Biol 13 (3): e1005417. http://journals.plos.org/ploscompbiol/article?id=10.1371/journal.pcbi.1005417
6
active DNA labelling of cells in S phase. We designed an original in vivo cell labelling 117
experiment with 5-ethynyl-2'-deoxyuridine (EdU) during a pulse-chase-pulse experiment, 118
followed by multi-parameter flow cytometry analysis, on the basis of earlier methods that 119
measured bivariate amounts of incorporated label versus DNA content in single cells (15, 120
31). To our knowledge, there is currently no model able to analyse the bi-dimensional dot 121
plot flow cytometry data, in order to infer dynamic parameters of cell cycle phases after 122
complex pulse-chase experiments. Thus, to interpret the complex cell dynamics during 123
the experiment, we designed a generic mathematical model that describes the dynamics 124
of cells that transit from G0/G1 to S and then to G2/M phase of the cell cycle according 125
to variable periods of pulse-chase. Fitting of the model to the experimental bi-126
dimensional flow cytometry data allowed us to infer rates of proliferation, and to give an 127
estimate of mean duration times of cell cycle phases. Our mathematical model is also able 128
to fit data from other pulse/chase experiment protocols and by extension can potentially 129
be used to investigate cell cycle kinetics in any cell type. 130
This study provides a detailed proliferation assessment and cell quantification in 131
subpopulations of T cells, along their differentiation from thymus to spleen, and through 132
aging. For the first time, we show that genetic origin and age drive a particular 133
"signature" of proliferation and cycle phase durations, according to T cell differentiation 134
stage and T cell lineage. FVB mice have significantly lower rates of T cell proliferation 135
than C57BL/6 mice in both thymus and spleen. Proliferation decreases with age in both 136
strains. These results are discussed in the perspective of T cell dynamics and proliferation 137
of T cells, where aging and genetic peculiarities could be of importance. 138
Vibert, J. and V. Thomas-Vaslin (2017). PLos Comput Biol 13 (3): e1005417. http://journals.plos.org/ploscompbiol/article?id=10.1371/journal.pcbi.1005417
7
Results
140
Assessment of in vivo cell proliferation by active DNA labelling
141
To determine proliferation properties of cell populations, active labelling of cells 142
during S phase of the cell cycle was done with EdU, a thymidine analogue, during 143
pulse/chase periods. In our specific case, two pulse periods were separated by a fourteen-144
hour chase interval (Fig 1). Since the in vivo half-life of EdU is about one hour (32), this 145
was equivalent to a pulse-chase-pulse experiment comprising an initial two-hour pulse 146
followed by a fourteen-hour chase and then a second thirty-minute pulse. This protocol 147
was chosen because it allows the labelling of cell populations with low proliferation rates, 148
which would not be detected with only one EdU injection. Multicolour flow cytometry 149
then allowed the identification of the cell cycle phases and the quantitative active EdU 150
labelling status, using bi-dimensional EdU label/DNA content dot plots that represent 151
single cell analysis. According to DNA content, cells can be classified in G0/G1 phase 152
(DNA content equal to 1), G2/M phase (DNA content equal to 2), or S phase (DNA 153
content between 1 and 2). According to the intensity of EdU label, one can distinguish 154
between labelled cells that have progressed through S phase during the pulse, and non-155
labelled cells. Thus, the dot plots represent the end snapshot of the cell population 156
evolution through periods of pulse/chase. Three groups of cells can be delimited on our 157
dot plots (Fig 1): G0/G1 unlabelled, G2/M unlabelled, and EdU labelled cells. Since the 158
experiment ends with a pulse phase, there are no remaining unlabelled cells in S phase. 159
160 161 162
Vibert, J. and V. Thomas-Vaslin (2017). PLos Comput Biol 13 (3): e1005417. http://journals.plos.org/ploscompbiol/article?id=10.1371/journal.pcbi.1005417
8 163
Fig 1. EdU pulse chase experiment for quantification of cell proliferation. Mice were
164
injected intra-peritonealy with EdU at 0, 1, and 16 hours equivalent to a "pulse-chase-165
pulse" experiment. Thirty minutes after the last pulse, the mice were sacrificed, lymphoid 166
organs removed, and cell suspensions were analysed by single-cell multicolour flow 167
cytometry. The bi-dimensional dot plot reveals the intensity of EdU label (log scale) and 168
DNA content (linear scale arbitrary unit) in lymphocytes. Manual gating allows 169
identification of unlabelled cells in either G0/G1 (G) or G2/M (M) that have not transited 170
through S phase during pulse, and EdU labelled cells (G'+S'+M') that have transited 171
through S phase. 172
173
Differential cell proliferation in T cells according to differentiation stage, age and
174
strain
175
Our purpose was to assess the variation of T cell dynamics and heterogeneity in 176
individuals, in time and location, by quantification of T cell proliferation in two different 177
strains (FVB and B6), through aging (at 2 and 18 months) and during differentiation in 178
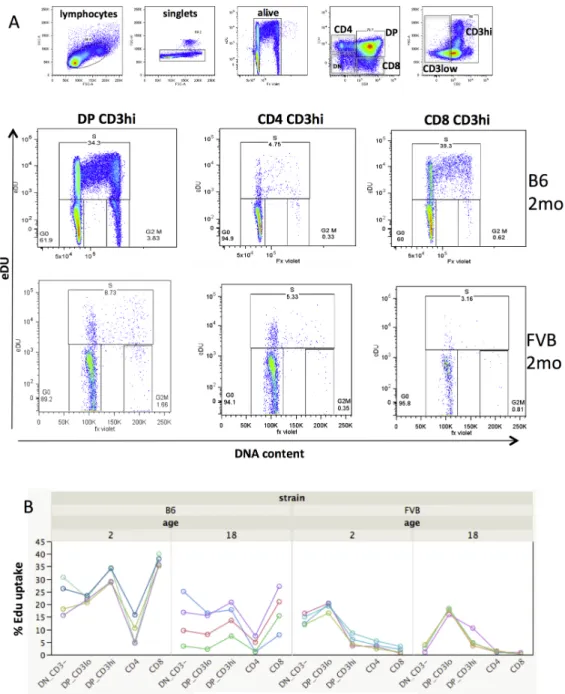
lymphoid organs (from thymus to spleen). As exemplified in Fig 2A, in the thymus, the 179
percentage of EdU labelled cells varies significantly according to strains of mice and the 180
stage of thymocyte differentiation. Thus, comparing the FACS profiles between typical 2-181
month-old FVB and B6 mice, one can observe that the proportion of EdU+ cells is much 182
lower in FVB mice, showing lower proliferation capacities in this strain. A given group 183
Vibert, J. and V. Thomas-Vaslin (2017). PLos Comput Biol 13 (3): e1005417. http://journals.plos.org/ploscompbiol/article?id=10.1371/journal.pcbi.1005417
9
of mice depicts a particular signature of proliferation according to strain and age (Fig 2B) 184
revealing the heterogeneity of proliferation across the stages of differentiation. The 185
percentages of labelled cells after 16 hours are given in S2 Table. With aging, at 18 186
months, which corresponds to middle life in mice, the proliferation of thymocytes in B6 187
is reduced by about 1.5 fold in all populations. In 18-month-old FVB mice, the 188
proliferative capacities are even more reduced in immature CD3-CD4-CD8- TN cells and 189
thereafter are quite comparable to the altered proliferation capacities already detected in 190
young FVB mice. In conclusion, T-cell dynamics is very heterogeneous, depending on 191
the differentiation stages as detected by the variation in the EdU uptake. Cell proliferation 192
is altered with age, and genetic origin influences the proliferation capacities, which are 193
depressed in FVB mice. Thus, a typical biological signature of thymocytes is revealed, 194
allowing one to distinguish strains of mice and ages, although precise quantification of 195
dynamic parameters is required. 196
Vibert, J. and V. Thomas-Vaslin (2017). PLos Comput Biol 13 (3): e1005417. http://journals.plos.org/ploscompbiol/article?id=10.1371/journal.pcbi.1005417
10 197
Fig. 2. Thymocyte proliferation in mice according to cell differentiation stage, age
198
and genetic origin. Cell proliferation was assessed in C57BL/6 and FVB mice of 2 or 18
199
months as in Fig 1. (A) Multi-colour flow cytometry and hierarchical gating in 200
Vibert, J. and V. Thomas-Vaslin (2017). PLos Comput Biol 13 (3): e1005417. http://journals.plos.org/ploscompbiol/article?id=10.1371/journal.pcbi.1005417
11
thymocytes showing EdU vs DNA content dot plot in 2-month-old mice. (B) Percentage 201
of EdU+ labelled cells according to differentiation stages through time: from the most 202
immature CD3-CD4-CD8- triple negative cells (TN), CD3loCD4+CD8+ (DP CD3lo), 203
CD3hiCD4+CD8+ (DP CD3hi) to single positive mature CD4+CD3+ or 204
CD8+CD3+stage. Each curve represents the %EdU uptake for one of the 4 mice per 205
group. 206
Model of labelling experiment and fit to experimental data
207
Our aim was to quantitatively estimate proliferation parameters and mean life-span 208
of cells (here restricted to inter-mitotic time), according to age and strain, in a standard 209
way independent of pulse-chase experiment duration, and to express results as a 210
proliferation rate/day. Thus we designed a mathematical model to interpret and fit the 211
data obtained from the experimental cytometry bi-dimensional dot plots. To model 212
system dynamics and the variation of “stocks” of cells as a function of time, equivalent 213
representations can be proposed: the hydraulic metaphor, stock-flow/transition diagrams, 214
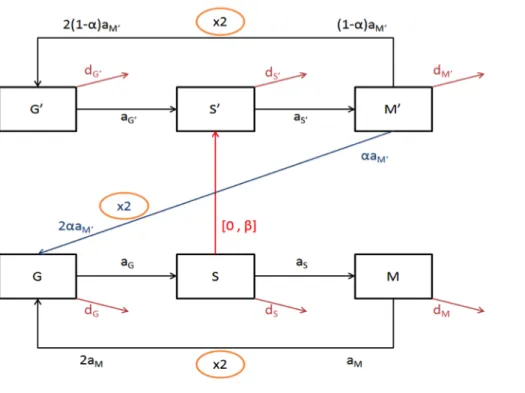
integral equations, and differential equations (33). We chose to explain our model with a 215
state-transition diagram (Fig 3), a visual language that is accessible to biologists and 216
provides an equivalence to a system of ODEs (34, 35). A state-transition diagram allows 217
representation of the parallel processes occurring in cells and during the experiment. 218
Through time, the cells can progress across three stages, G0/G1, S, G2/M or exit the 219
population (death, differentiation, migration). During the alternative phases of pulse and 220
chase of EdU, the cells can exist in one of two stages, either EdU unlabelled (Edu-) or 221
EdU labelled (EdU+). Thus, by combination, the cells can progress in six different stages 222
represented by six differential equations. Moreover, the cells progress through the cycle 223
in the context of EdU bio-availability (pulse or chase). Altogether, the multiplicity of the 224
states (3x2x2) results in a system of twelve equations (see Materials and Methods section 225
and Tables 1 to 3 for the description of the mathematical model). 226
Vibert, J. and V. Thomas-Vaslin (2017). PLos Comput Biol 13 (3): e1005417. http://journals.plos.org/ploscompbiol/article?id=10.1371/journal.pcbi.1005417
12 227
Fig. 3. State transition model of cell cycle and EdU labeling. According to the FACS
228
dot plot, the evolution of cells through the cell cycle and EdU labelling can be 229
represented by a transition diagram. Unlabelled cells can transit successively in the three 230
phases of the cell cycle: G0/G1 (G), S (S), and G2/M (M). Terms in aX correspond to 231
rates of entry into the next phase of cells in X phase (X being either G, S, or M). The exit 232
of cells, either due to death, differentiation, or migration is represented by terms in dX. 233
During the pulse-phase the cells in S phase incorporate EdU (red arrow) and enter into S’ 234
with rate β and continue the cycle to M’ and G’. During the chase phase, in the absence 235
of EdU, the labelled cells lose labelling upon several cell divisions (blue arrow) (de-236
labelling) with rate α. Unlabelled cells can enter into S phase but remain unlabelled. 237
238
Under our experimental conditions, the EdU labelling protocol is modelled by a 239
first pulse phase (between t=0 and t=2 hours), a chase phase (between t=2 and t=16 240
hours) and a second pulse phase (between t=16 and t=16.5 hours). We defined an 241
experimental result as a two-dimensional vector, representing the three percentages of 242
G0/G1 unlabelled, G2/M unlabelled, and labelled cells which are equivalent to the G, M, 243
and G’+S’+M’ in the model. Fitting to experimental data was done by simulating the 244
progression of cells through the cell cycle and labelling over a bi-dimensional range of 245
Vibert, J. and V. Thomas-Vaslin (2017). PLos Comput Biol 13 (3): e1005417. http://journals.plos.org/ploscompbiol/article?id=10.1371/journal.pcbi.1005417
13
parameters. To constrain parameters, we used the biological hypotheses detailed in 246
Materials and Methods (Table 3). 247
Average proliferation rates and cell cycle durations in thymus and spleen from B6
248
and FVB mice
249
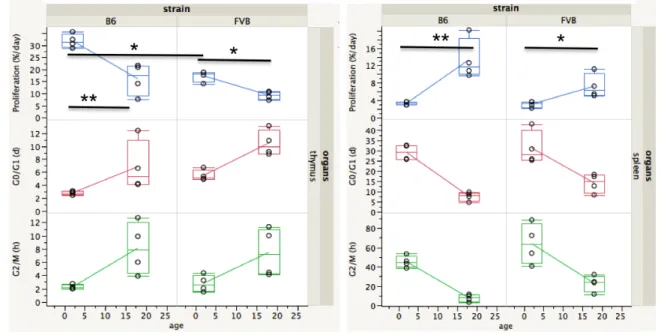
We first compared proliferation rates for whole thymus and whole spleen, 250
abstracting the phenotypic heterogeneity of T cells, in young and old B6 and FVB mice 251
(Fig 4, S1 Table). In the thymus, proliferation rates can vary up to three-fold, from 32% 252
per day in young B6 mice to 9% per day in old FVB mice. Proliferation rates of 253
thymocytes in young B6 mice are in general twice the value of those in young FVB mice 254
(p<0.05). The proliferation rates of thymocytes from old B6 mice and young FVB mice 255
are similar (around 17%/day). In both strains, there is a two-fold drop of proliferation 256
rates in thymus with aging (p<0.05 in spleen and p<0.01 in thymus). In the spleen, in 257
contrast to the thymus, the proliferation rates increase with age. From about 3% per day 258
in both young strains, it doubles in old FVB (p<0.05) and quadruples in old B6 mice 259
(p<0.01). 260
261
Fig. 4. Proliferation rates and cell cycle phase durations in thymus and spleen.
Vibert, J. and V. Thomas-Vaslin (2017). PLos Comput Biol 13 (3): e1005417. http://journals.plos.org/ploscompbiol/article?id=10.1371/journal.pcbi.1005417
14
Proliferation rates (%/day), G0/G1 and G2/M phase durations (in days) in B6 and FVB 263
mice (n=4 per group) according to age (2 and 18 months) in whole thymus (left) and 264
whole spleen (right). Values are indicated in the box plot, the median is the 50th 265
percentile, the lower and upper limits of the box are the 25th and 75th percentiles and the 266
whiskers indicate 1.5x(interquartile range). *: p<0.05. **: p<0.01. (See Materials and 267
Methods section for statistical tests used). Statistics are for proliferation rates only. Mean 268
values and SD are given in S1 Table. 269
270
The duration of G0/G1 phase, S, and G2/M gives an indication of the mean time 271
between two cell cycles (inter-mitotic time), which can be calculated as 1/proliferation 272
rate. Again, these values are heterogeneous; the duration of G0/G1 phase increases with 273
aging, G2/M duration varies from 2 hours in young B6 thymocytes to up to 63 hours in 274
young FVB splenocytes. 275
Model validation: Simulation of another pulse-chase experiment from the literature
276
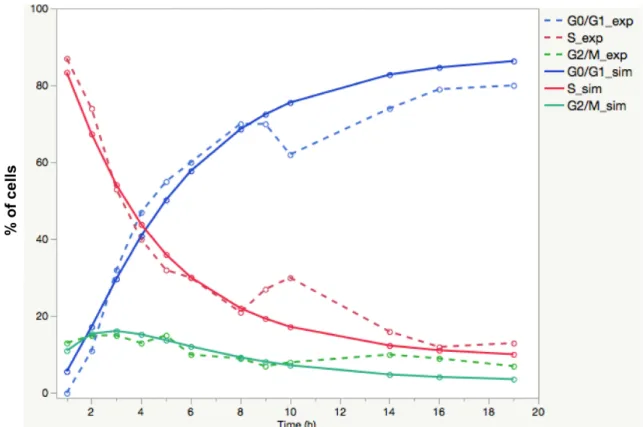
In order to consolidate our results and validate our mathematical model, we 277
simulated a different pulse/chase experiment, as performed in 1990 by Baron and Penit. 278
This in vivo experiment also assesses whole thymocyte kinetics from six- to eight-week-279
old B6 mice, using a thymidine analogue Bromo-deoxyuridine (BrdU) uptake, versus 280
DNA content measurement (15). To simulate this experiment with our model, we set up a 281
single injection of BrdU at the beginning of the experiment (1-hour pulse), followed by a 282
nineteen-hour chase phase, during which within the BrdU-labelled cells the percentages 283
of cells in G0/G1, S, and G2/M cells were quantified according to DNA content. We used 284
cell cycle parameters retrieved from our own fitting procedure on the whole thymus of 285
our 2-month old B6 mice (underlined in red in S1 Table), and we simulated the 286
experiment by setting the initial state to be 100% of cells in S phase. We also set α=0 and 287
dG=aG . The comparison of the experimental results provided by Baron and Penit (15) and 288
the simulation of their pulse/chase protocol with our parameters obtained from B6 data is 289
shown in Fig 5. The ability of our simulation to visibly approach Baron and Penit's 290
Vibert, J. and V. Thomas-Vaslin (2017). PLos Comput Biol 13 (3): e1005417. http://journals.plos.org/ploscompbiol/article?id=10.1371/journal.pcbi.1005417
15
experimental results confirms the plausibility of the biological parameters obtained in our 291
young B6 mice and points to the fact that our model can be run with other experimental 292
conditions of pulse/chase. 293
294
295
Fig. 5. Validation of the mathematical model and parameter values with pulse/chase
296
experimental data from (15). Young B6 mice received a single BrdU pulse, and within
297
the BrdU-labelled cells the percentages of cells in GO/G1, S or G2/M is recorded over a 298
nineteen hour chase period. The points and dashed lines represent Baron experimental 299
data. Simulation of the same pulse chase conditions using our mathematical model, with 300
the mean parameter values (S1 Table) obtained from our 2-month-old B6 mice (n=4). 301
The points and continuous lines represent the results of our simulation. 302
303
Signature of proliferation according to T cell differentiation stage, age, and genetics
304
The complexity and heterogeneity of cell populations that compose the thymus led 305
us to analyse, more deeply, the proliferation rates of cells according to their 306
differentiation stages, thus across time. Thymocytes were further decomposed in the 307
Vibert, J. and V. Thomas-Vaslin (2017). PLos Comput Biol 13 (3): e1005417. http://journals.plos.org/ploscompbiol/article?id=10.1371/journal.pcbi.1005417
16
earliest immature triple negative thymocyte CD4-CD8-CD3-(TN), in DP (double positive 308
thymocyte CD4+CD8+, sub-divided into DP CD3lo and DP CD3hi according to low or 309
high expression of CD3), CD4, and CD8 mature CD3+ populations (S1 Figure upper 310
panel). In the spleen, CD4 and CD8 T cells were separated as CD44lo (naïve) and CD44hi 311
(antigen-experienced). CD4+Foxp3+ (regulatory T cells, Treg) cells were also identified 312
as a sub-population of CD4 T cells (S1 Fig lower panel). From all data collected in the 313
thymus, we were able to establish a linear correlation between the observed percentages 314
of EdU+ cells and the fitted proliferation rates that is similar in the two strains of mice 315
and is independent of the age (Fig 6). The equation y=-0.000884+0.0119x allows 316
estimation of the proliferation rates, y, for further experiments using the same pulse/chase 317
protocol duration, from x =%EdU+ cells (r2=0.99, p<0.01). Estimated parameter values 318
are given in S2 Table. 319
Vibert, J. and V. Thomas-Vaslin (2017). PLos Comput Biol 13 (3): e1005417. http://journals.plos.org/ploscompbiol/article?id=10.1371/journal.pcbi.1005417
17 320
Fig. 6. Signatures of lymphocyte proliferation according to strains and ages. The
321
upper panel shows the correlation between the proliferation rate and percentages of EdU+ 322
cells observed 16 h after the pulse/chase/pulse experiment in thymus of B6 and FVB 323
mice (80 values) and according to the age of mice (2 months: blue circle, 18 months: red 324
circles). Hierarchical unsupervised clustering showing the clusters of mice according to 325
the rates of proliferation. Values and statistics are given in Tables S1, S2, S3, S4. 326
Vibert, J. and V. Thomas-Vaslin (2017). PLos Comput Biol 13 (3): e1005417. http://journals.plos.org/ploscompbiol/article?id=10.1371/journal.pcbi.1005417
18
Proliferation rates/day are significantly different (p<0.05) comparing : 327 In thymus : B6 2M vs B6 18M: 2M>18M in DP, CD8 ; FVB 2M vs FVB 18M: 328 2M>18M in DN and CD4 ; B6 2M vs FVB 2M:B6>FVB in DP CD3+, CD8 ; B6 18M vs 329 FVB 18M:B6>FVB in CD8 330 In spleen : B6 2M vs B6 18M: 2M>18M in CD4 CD44hi ; FVB 2M vs FVB 18M: 331 2M>18M in CD4 CD44hi ;B6 2M vs FVB 2M:B6>FVB in CD4, CD4 Foxp3+ ; B6 18M 332 vs FVB 18M:B6>FVB in CD4 Foxp3+, CD8 CD44hi 333 334
Because the intragroup variability of proliferation rates is low while inter-group 335
heterogeneity is high (S1 Fig), unsupervised hierarchical clustering allows identification 336
of clusters of mice according to age, strain, and differentiation stage giving particular 337
signatures (Fig 6). The heterogeneity of cell dynamics is revealed at the various steps of 338
differentiation. If decomposition of the population is performed so as to identify rare 339
populations as DN1 to DN4, then to DP that increase CD3 expression through maturation 340
while modulating CD4 and CD8 co-expression, then one can observe oscillations in 341
proliferation (S4 Table and S1 Fig median panel), as previously observed in young B6 342
mice using other protocols (36). Hence in the thymus, while DN1 cells (the early thymic 343
precursors) display minimal proliferation, in particular in old FVB mice (1.2%/day), CD8 344
mature thymocytes are the cells that display the highest proliferation rate (45%/day in 345
young and a 2-fold decrease to 21%/day in old B6 mice) (S4 Table). Thus, the inter-346
mitotic time for CD8 CD3+ mature thymocytes in young B6 are of about 2 days (S2 347
Table), suggesting expansion of mature thymocytes before thymic export, while such 348
proliferation is limited in FVB. The relative durations of G0/G1 and G2M/ phase and thus 349
inter-mitotic time increase with aging in most thymic populations (S2 Figure). In the 350
spleen aging perturbations are more irregular. Altogether these durations are again 351
heterogeneous according to the stage of differentiation and T cell lineage. 352
Vibert, J. and V. Thomas-Vaslin (2017). PLos Comput Biol 13 (3): e1005417. http://journals.plos.org/ploscompbiol/article?id=10.1371/journal.pcbi.1005417
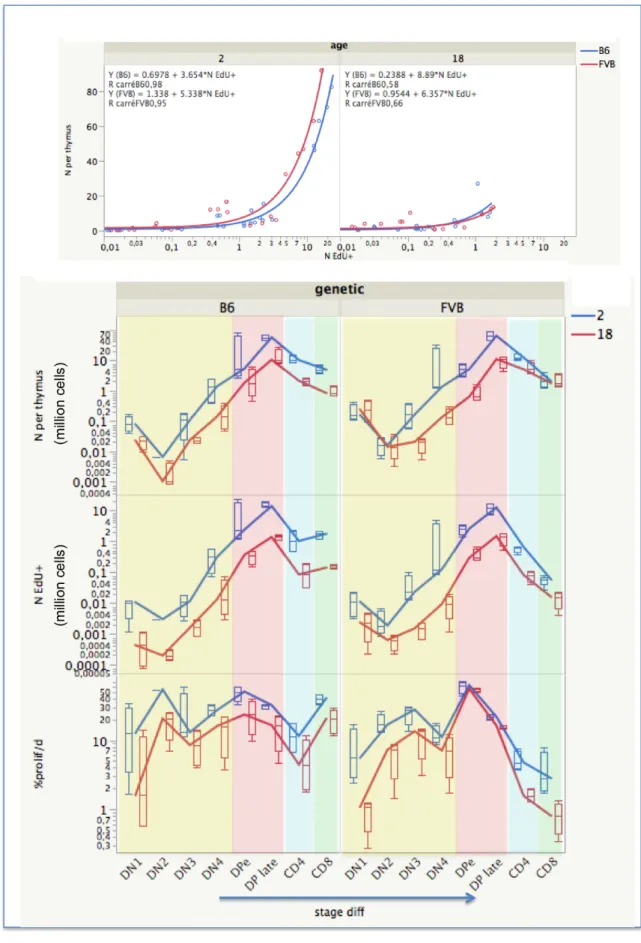
19 354
Fig. 7. Quantification of dividing cells during thymocyte differentiation.
355
For each stage of thymocyte differentiation, the number of cells and the number of EdU+ 356
Vibert, J. and V. Thomas-Vaslin (2017). PLos Comput Biol 13 (3): e1005417. http://journals.plos.org/ploscompbiol/article?id=10.1371/journal.pcbi.1005417
20
cells (in millions) is quantified by FACS after pulse/chase. The correlation between these 357
numbers is shown according to strains and ages of mice (upper panel). Box plots 358
represent the quartiles and the lines represent the evolution of the median values through 359
stage of differentiation thus across time, in four mice per group (lower panel). DN CD3 -360
cells are in yellow, DP cells are in red and decomposed into DPearly (CD4hiCD8hi) and 361
DP late (CD4medCD8med). Then DP cells differentiate either into CD4+CD3+ (blue) or into 362
CD8+CD3+(green) mature T cells. 363
364
Numbers of cells per differentiation stage in the thymus are in accordance with the 365
progression of thymocytes within 4 weeks as previously modelled in young FVB mice 366
(1). These numbers are correlated to the numbers of EdU+ cells (Fig 7 upper panel). Thus, 367
an exponential growth of cells occurs during their residence in the thymus from DN2 368
where they actively divide up to late DP cells (Fig 7 lower panel). The minimal estimate 369
of exponential cell divisions in B6 mice is 13 divisions in about 22 days, higher than the 370
previous 9 divisions estimate (37). This estimation does not take into account the cell 371
death that occurs essentially at DN4 (1-3% of cells are dying) and at early DP stage for 372
cells co-expressing the highest levels of CD4 and CD8 (death slightly increases from 13 373
to 15% in B6 mice and from 8 to 12% in FVB mice with ageing) during the thymic 374
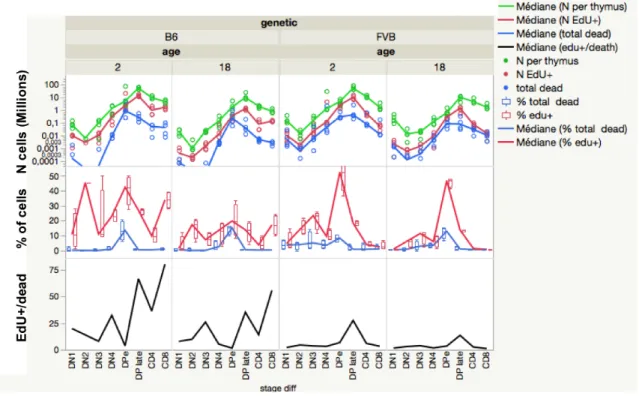
selection processes (Fig 7, S5 Table). We calculated the ratio of cell number EdU+/death 375
as a performance index of T cell expansion. In FVB, the EdU+/death ratio is lower than in 376
B6 at all stages of differentiation (S5 Table, Fig 8). Thus, although the total number of 377
cells reaches similar expansion, the balance between division and death appears quite 378
different in both strains. 379
Vibert, J. and V. Thomas-Vaslin (2017). PLos Comput Biol 13 (3): e1005417. http://journals.plos.org/ploscompbiol/article?id=10.1371/journal.pcbi.1005417
21 380
Fig. 8. Quantification of cell proliferation and death in thymus. For each stage of
381
thymocyte differentiation, the total number of live cells (green), of accumulated EdU+ 382
(red) cells, and of dead cells (blue) after the pulse/chase/pulse are shown (upper panel). 383
The percentage of EdU+ cells (red) and dead cells (blue) among each differentiation stage 384
identified is given (lower panel). Quantification is done by FACS and given as the 385
median (line) of 4 mice per group (points). In DN2 and DN3 cells in some B6 mice death 386
is so rare that quantification is below 10 cells/thymus and sometimes up to 0 and cannot 387
be represented on the log scale. The ratio of EdU+/dead cells gives a performance of cell 388
expansion. 389
390
When cells migrate from the thymus to the spleen they reduce their proliferation. 391
Naïve CD44lo T cells reduce their proliferation rate to <1%/day in all groups (S1 Fig, S3 392
Table, S4 Table). Thus a minimal inter-mitotic time of 226 days (a value similar to 218 393
days found in young B6 mice (27)), can be estimated for the more active CD8 naïve T 394
cells in 2-month-old mice. In contrast, effector/memory T cells expressing CD44hi after 395
antigenic stimulation (38), are actively labelled, suggesting inter-mitotic times of 12 to 16 396
days in CD4 and CD8 from 2-month-old B6 while it increases about two-fold (32 and 37 397
days) in FVB old mice. Regulatory T cells are the T cell population with maximal 398
Vibert, J. and V. Thomas-Vaslin (2017). PLos Comput Biol 13 (3): e1005417. http://journals.plos.org/ploscompbiol/article?id=10.1371/journal.pcbi.1005417
22
proliferation rates in young B6 (21%/d), dividing every 5 to 12 days, respectively, in 2- 399
and 18-month-old mice. In contrast, proliferation rates are as low as 1.4%/day suggesting 400
that Treg cells divide only every 83 days in FVB mice, independently of the age. 401
Vibert, J. and V. Thomas-Vaslin (2017). PLos Comput Biol 13 (3): e1005417. http://journals.plos.org/ploscompbiol/article?id=10.1371/journal.pcbi.1005417
23
Discussion
403
Investigation of cell proliferation and turnover in space and time currently remains 404
a challenge in immunology, in order to quantify the parameters of cell population 405
dynamics in vivo according to tissue/organ and cell population heterogeneity, as well as 406
to identify peculiarities related to the state of individuals, such as age and genetic origin 407
(2, 3, 39-41). 408
Experimental approach and mathematical modelling
409
The model developed here allows estimation of proliferation rates and inter-mitotic 410
time (with estimated parameters and confidence intervals for G0/G1 and G2/M cell cycle 411
phase durations as described in Protocol S1 and Table S6) and allows quantitative 412
comparison of the effect of age and genetics on lymphocyte dynamics from their early 413
differentiation in thymus to their final maturation in spleen. 414
Heterogeneity of experimental approaches can be solved by modelling. Various
415
experimental approaches, such as active cell labelling during cell cycle with nucleotide 416
analogues, deuterated water or glucose, passive DNA content measurement, depletion of 417
dividing cells, assessment of cyclin activity, and measurement at the level of populations 418
or single cells, were recently reviewed (2). Mathematical or computer modelling is 419
necessary to interpret complex data and obtain standardized values for parameters such as 420
proliferation rates and cell cycle phase durations. This is the only way to compare results 421
issuing from different experimental approaches (2) (P. Loap et al. in preparation). BrdU, 422
or more recently EdU labelling pulse-chase experiments, with various durations and 423
routes of administration were used to investigate lymphocyte turnover and life-span in 424
mice. Only a few reports concerned bi-dimensional analysis of BrdU/DNA content (15, 425
42), and these investigations were limited to whole organ cell populations. Indeed, 426
Vibert, J. and V. Thomas-Vaslin (2017). PLos Comput Biol 13 (3): e1005417. http://journals.plos.org/ploscompbiol/article?id=10.1371/journal.pcbi.1005417
24
sensitivity of fluorochromes to reveal BrdU labelling, and the small number of parameter 427
investigations limited studies using old cytometers. In the last few years, the introduction 428
of Clickit EdU technology and multi-colour flow cytometry has allowed investigation of 429
cell phenotype together with EdU and DNA content labelling, as set up in this paper. 430
Since complex experimental pulse chase periods change from one study to another, as in 431
Baron's paper (15), the only way to interpret the results and to infer quantitative 432
parameter values of proliferation per day is to develop a mathematical model. 433
Our mathematical model, designed with visual language accessible to biologists, is 434
easy to manipulate to quantify lymphocyte dynamics parameters and can be used to 435
simulate all kinds of pulse/chase experimental designs for further investigations. 436
Moreover, it is flexible and can be easily modified to accommodate other phases of the 437
cell cycle or different kinetics of label incorporation. This model was successfully applied 438
to previous results from Penit group obtained with a different experimental pulse/chase 439
protocol (cf Fig 5). 440
Cell heterogeneity and granularity of modelling. In the mathematical model and
441
the process of fitting, it is assumed that the studied population has uniform cycling 442
parameters. We make abstraction of certain important transition factors, such as 443
differentiation, death, and migration between different compartments, as if the population 444
was a closed system. 445
The estimated parameter values must be considered as averages over the whole 446
population studied. Values for the total thymus are in fact an average over all sub-447
populations in the thymus, weighted by their relative importance in numbers of cells (DP 448
cells are the most numerous intra-thymic population, and therefore results for the total 449
thymus are similar to those for DP cells). A correct understanding of kinetic 450
Vibert, J. and V. Thomas-Vaslin (2017). PLos Comput Biol 13 (3): e1005417. http://journals.plos.org/ploscompbiol/article?id=10.1371/journal.pcbi.1005417
25
heterogeneity within the whole population therefore requires further identification into 451
sub-populations so as to increase the resolution. However, precise rates of proliferation 452
are difficult to calculate for heterogeneous populations during the differentiation process 453
without integrating transition to cell death and transition between cell stages into a 454
mathematic model. This is a general problem in the literature since to our knowledge 455
there is currently no model that integrates such complex dynamical transitions. Indeed 456
there is cell transition within populations (from rare DN, to DP to SP in thymus and from 457
naïve to effector/memory in spleen), transition to cell death, and transition to another 458
organ (from thymus to spleen) or recirculation. Here we can only quantify the numbers of 459
dead cells at instant time (and not estimate rates/day) and death is not integrated in the 460
current mathematical model. Inter-mitotic time and cell phase duration are only indicative 461
but allow to compare the behaviour of various cell populations and conditions. While 462
CD8 CD3+ mature thymocytes from young B6 mice have high proliferation rates 463
(allowing for an inter-mitotic time of about 2.2 days) and possible expansion before 464
thymic output, the CD8 CD3+ mature thymocytes from old FVB mice display a 100-fold 465
lower proliferation rate and thus would be exported before having time to divide. 466
One should consider that between two pulses or within long pulse periods, cells 467
may transit from differentiation stage or migrate to other tissues. However with a sixteen-468
hour long pulse/chase/pulse experiment these transitions are rather limited. The 469
observation of a linear relationship between the number of cells labelled by EdU and the 470
proliferation rate (Fig 6) is probably explained by the fact that as the duration of the 471
experiment is smaller on average than the duration of one full cell cycle, labelled cells 472
have not had the time to transit to another compartment, so that the number of labelled 473
cells is globally proportional to the rate of entry into S phase and the proliferation rate, as 474
mice are in steady-state. Nonetheless if we were to model a longer experimental protocol, 475
Vibert, J. and V. Thomas-Vaslin (2017). PLos Comput Biol 13 (3): e1005417. http://journals.plos.org/ploscompbiol/article?id=10.1371/journal.pcbi.1005417
26
it would undoubtedly be necessary to take into account these processes. Moreover, the 476
parameter values observed with our sixteen-hour pulse/chase/pulse are confirmed by 477
simulating the context of a single pulse followed by a nineteen-hour chase, as in the 478
Baron paper that assessed whole thymocyte proliferation. 479
Considering these limitations, we believe that our experimental design and 480
modelling is able to give, if not exact absolute values, at least a correct understanding of 481
the relative differences between the heterogeneous populations studied. 482
Overlap of phases with DNA content analysis. Since DNA content only allows
483
one to distinguish three phases in the cell cycle, it is not possible to give separate 484
estimates of durations for G2 and M phases or, more problematically, for G0 and G1 485
phases. Thus G0/G1 phase duration is an average between G0 and G1 durations, 486
weighted by their relative importance in numbers of cells. New protocols and modelling 487
introducing Ki-67 labelling to separate G0 from G1 cells are under investigation (P. Loap 488
et al. in preparation). 489
Parameter constraint and fit. The relatively low information content of the
490
experimental dot plots (three proportions, i.e., a two-dimensional vector) constrains our 491
search for parameters. We notably restrain ourselves to the steady-state case (Hyp.4) 492
since we believe that the in vivo conditions of the experiment in normal mice justify this 493
hypothesis. We also fix loss of cells in S and G2/M to be null (Hyp.5), as confirmed by 494
observations (15). Finally, we fix S phase duration to 6.5 hours (Hyp.7); this is a value 495
that has been measured in the same type of cells, as simulated here (15). A stretched cell 496
cycle duration model (43) was recently proposed for mature T and B cells (44), but there 497
is no indication this model could also occur in immature cells. 498
Vibert, J. and V. Thomas-Vaslin (2017). PLos Comput Biol 13 (3): e1005417. http://journals.plos.org/ploscompbiol/article?id=10.1371/journal.pcbi.1005417
27
Heterogeneity of lymphocyte dynamics according to cell population, age and genetic
499
origin
500
The seminal work of Penit has addressed the quantification of proliferation in the 501
thymus of young B6 mice (36). However, to our knowledge we are the first to give 502
proliferation rate/day at various granularities (from whole organ to rare populations) 503
according to the time evolution of lymphocyte differentiation, from thymus to spleen, and 504
in relation to the age and genetic origin of mice. FVB and B6 mice were chosen, because 505
these strains belong to different phylogenetic clusters (45, 46) and display dissimilar T-506
Cell Receptor (TCR) repertoires as explained by chromosomal deletion of six Beta chain 507
Variable region (BV) TCR families in FVB (47). B6 and FVB mice differ in their 508
lymphocyte and T cell compositions (48) and numbers in the various populations at 509
steady-state (30). Moreover, FVB mice display accelerated thymic involution and aging 510
of VB repertoire as compared to B6 mice (30). Thus, this suggests that variation in 511
proliferation rates or cell death might explain these differences. 512
We have previously modelled thymocyte dynamics in young FVB mice and shown 513
that 83% of the produced thymocytes die, with 35% of DP dying per day (1). Here, we 514
quantify thymocyte cell death as apoptotic cells in sub G0/G1 and as cells with a DNA 515
content >4, corresponding to macrophages engulfing dying cells. While in total thymus 516
about 2-3% of cells are in death at an instant time, major cell death occurs between DN3 517
and DN4 stages if VDJ recombination fails (3-5% of instant death) and at the DP stage by 518
negligence and negative selection processes, with up to 15% instant cell death at early DP 519
stages before CD4 and CD8 modulation. During death by neglect (49) and negative 520
selection macrophages remove dying auto-reactive thymocytes, before cell membrane 521
permeabilisation and chromatin condensation (50). While the thymus of FVB young mice 522
contains a higher number of cells than B6 mice (90 vs 81 millions of cells), we observe 523
Vibert, J. and V. Thomas-Vaslin (2017). PLos Comput Biol 13 (3): e1005417. http://journals.plos.org/ploscompbiol/article?id=10.1371/journal.pcbi.1005417
28
global defective proliferation rates as compared to B6 mice, in particular at early DN1 524
and DP stages but also for the proliferation of CD8 mature thymocytes (3%/day in FVB 525
vs 40%/day in B6), and accumulation of cells at late DP stage. Conversely, in FVB mice, 526
thymocyte death is generally higher. Thus, the death/EdU+ ratio is higher at all stages 527
except in DP. (51). Our results show that genetics and age influence T cell dynamics, in 528
particular increase in the time spent in G0/G1 in thymus with aging, related to the G0 529
elongation theory of aging. Aging thus increases the inter-mitotic time, and contributes to 530
the decrease of the total number of thymocytes as the individual ages. Impaired 531
thymocyte proliferation and higher cell death in FVB mice could be related to the 532
immaturity of their thymic epithelial cells (52) that normally interact with thymocyte 533
during differentiation, selection, and migration, as recently modelled in B6 mice (35). 534
These defects in FVB mice may participate in the accelerated thymic involution and 535
aging and the high CD4/CD8 ratio (30), also observed here (CD4/CD8= 7 for FVB and 2 536
for B6). As modelled by Cohen’s group in a reactive animation (53), the cell competition 537
for epithelial cells and decreased ratio of the dissociation rates of CD8+ and CD4+ 538
thymocytes to 0.3, would induce an increase of the CD4/CD8 ratio to 7, thus possibly 539
limiting the emergence of CD8 and their proliferation in FVB mice. As a consequence it 540
could explain that while the recovery to steady state values following transient depletion 541
of dividing cells is effective in young FVB mice (1), this process is defective in old FVB 542
mice, leading to CD8 clonal expansions in periphery in spleen (30). The defective Treg 543
proliferation observed here in FVB mice with increased time passed in G0/G1 and G2/M 544
even in young mice, may explain these TCR repertoire alterations in old mice. Indeed, in 545
FVB mice, the transfer of Treg from young mice or the stimulation of their proliferation 546
by low doses IL-2 treatment, initiated at 15 months of age, prevents repertoire alterations 547
and CD8 clonal expansion at 2 years (30). 548
Vibert, J. and V. Thomas-Vaslin (2017). PLos Comput Biol 13 (3): e1005417. http://journals.plos.org/ploscompbiol/article?id=10.1371/journal.pcbi.1005417
29
The global proliferation rate of splenocytes increases with aging from 3 to 13% per 549
day in B6 and from 3 to 7% per day in FVB. This 2- to 4-fold increase in proliferation 550
with aging reflects, however, considerable heterogeneity according to naïve or 551
effector/memory T cells. Our previous modelling using transient depletion of dividing 552
cells (1) led to the conclusion that “recent thymic emigrants” in the spleen, which 553
represent around 50% of all naïve T cells in young mice, make 1 to 2 cell divisions 554
during the 9 days after thymic output, allowing to complete the thymic clonal expansion 555
(of positively selected T cells) up to obtain at least 24 to 25 cells per naïve cell clone. The 556
mean proliferation rate of effector/memory T cells is 14 times that of naïve T cells. This 557
high level of proliferation in effector memory antigen-experimented T cells (inter-mitotic 558
time varies from 12 to 19 days in both strains) is in accordance with our previous results 559
showing that immunological memory maintenance is dependent on active T cell division 560
and that specific depletion of dividing T cells induces immunological amnesia while 561
primary responses were intact (54). However, with aging, the inter-mitotic time of 562
CD44hi cells increases. This suggests that the accumulation of CD44hi cell number 563
observed with aging is related to increased cell longevity rather than to active 564
proliferation. This decrease in proliferation of effector memory T cells with aging could 565
be related to hyper-glycosylation of T cell surface macromolecules, leading to altered T 566
cell signalling (55). Altered signalling pathways occur in T cells with aging, in particular 567
as alteration of lipid raft polarisation, altering early steps of T cell activation, with 568
increased activity of SHP-1 acting as a negative feedback on lymphocyte proliferation 569
(56, 57). This could explain the altered vaccine response in old individuals, and shouldbe 570
considered in systems biology approaches for vaccine design (58). 571
The CD4+Foxp3+ regulatory T cells, which represent less than 10% of CD4 splenic 572
T cells, display the highest proliferation rate within splenic T cells. This is in accordance 573
Vibert, J. and V. Thomas-Vaslin (2017). PLos Comput Biol 13 (3): e1005417. http://journals.plos.org/ploscompbiol/article?id=10.1371/journal.pcbi.1005417
30
with their peculiar selection by medullary thymic epithelial cells (59) presenting 574
promiscuous antigens because of Auto-Immune REgulator (AIRE) expression (60) of 575
autoreactive Treg, then triggered in peripheral tissues to division by self-antigens 576
cognition. We have previously shown that dominant tolerance to allogeneic grafts is 577
related to antigen specific Treg cells selection in thymus (61). In fact, a delicate balance 578
between proliferation or suppressive function of Treg is of importance to insure the 579
negative feedback loop, which controls the proliferation of other T cells. When Treg cells 580
are under “suppressive mode”, they are anergic, cannot proliferate (62) and thus less 581
sensitive to specific depletion of dividing T cells than other CD4 T cells. Thus, 582
specifically targeting cells in proliferation can induce dominant tolerance (51). 583
Our general conclusion is that FVB mice have lower proliferation rates than B6 584
mice, and that with aging T lymphocytes have lower proliferation rates, although all mice 585
are kept in the same environment. This certainly contributes to an accelerating aging. 586
This reveals a specific “signature” of proliferation across differentiation stages in each of 587
the two strains. This is in favour of the influence of genetic background and age on T cell 588
dynamics and thus on the homeostatic equilibrium of the immune system. Therefore, the 589
sensitivity of dividing cells - to depletion treatment by conditional immuno-pharmaco-590
genetics that also reveal cell dynamics (1, 30, 51, 54) or to gene therapy where retrovirus 591
integration requires cell division (63) - could be very different with aging and genetic 592
origin. Cell proliferation, age and genetics then influence the induction or control 593
memory (54) and induction of tolerance (30, 51). Thus, knowledge on lymphocyte 594
dynamics and proliferation of sub-populations is of importance for clinical applications. 595
Vibert, J. and V. Thomas-Vaslin (2017). PLos Comput Biol 13 (3): e1005417. http://journals.plos.org/ploscompbiol/article?id=10.1371/journal.pcbi.1005417
31
Materials and Methods
597
Mice
598
C57BL/6/N (B6) and FVB/N (FVB) mice were obtained from Charles River 599
Laboratories maintained in SPF conditions and used at 2 and 18 months of age. Mice 600
were manipulated according to European council directive 86/609/EEC of 24 November 601
1986 and with the approval of an ethics committee. 602
In vivo EdU treatment and multicolor flow cytometry analysis
603
The experimental protocol is summarized in Fig 1. Mice received three intra-604
peritoneal injections of 1 mg of EdU (5-ethynyl-2'-deoxyuridine, Life technologies) at 0, 605
1 and 16 hours and were killed half an hour after the last injection to remove thymus and 606
spleen. Cell suspensions were obtained by mechanical disruption of organs in PBS + 3% 607
newborn calf serum at 4°C, were then washed and submitted to CD16/CD32 blockage 608
with 2.4G2 hybridoma cell supernatant for 10 minutes. Cell membrane labeling was then 609
done for 20 minutes with antibodies coupled with fluorochromes Percp, APC-H7, and 610
APC. After washing, the cells were fixed and permeabilized with the ClickIT fixative, 611
and EdU was revealed by Click-IT containing Alexa488-azide. The last step consisted of 612
staining with antibodies labeled with PE and PE-cy7 for 30 minutes and washing with 613
Perm/Wash buffer (Becton-Dickinson). 1 µL FxCycleTM violet stain (Life Technologies) 614
was added per tube, 30 minutes before acquisition. Cell parameters were acquired on 615
LSR2 equipped with 405, 488, and 633 nm lasers (Becton-Dickinson) at a rate of 2000 616
cells/sec with DIVA software. Cells were analysed with Flowjo (www.flowjo.com) on 617
the basis of structural cell markers FSC-A (Forward Area), SSC-A (Side Scatter-618
Area), FSC-W (Forward Scatter-Width) to remove debris, apoptotic cells, and doublets. 619
Multicolour expression of specific markers CD3, CD4, CD8, CD25, CD44 allowed 620
identification of cell sub-population phenotype by hierarchical gating. Then, DNA 621
Vibert, J. and V. Thomas-Vaslin (2017). PLos Comput Biol 13 (3): e1005417. http://journals.plos.org/ploscompbiol/article?id=10.1371/journal.pcbi.1005417
32
content and EdU label enabled construction of bi-dimensional dot plots to determine cell 622
kinetics in each population. Dead cells were quantified in subG0/G1 apoptotic cells and 623
cell that display a DNA content >4N, corresponding to macrophages engulfing dying 624
cells before apoptosis. 625
Mathematical model
626
We designed an ODE (Ordinary Differential Equation) model describing cell 627
dynamics during an EdU labelling experiment. Cells cycle through G0/G1, S, G2/M and 628
are either unlabelled or labelled by EdU, giving six populations of cells represented by 629
the six following ODEs (system of equations (1) ): 630 631 !" !" = 2𝑎!𝑀 + 2𝛼𝑎!!𝑀 !− 𝑎 ! + 𝑑! 𝐺 !" !" = 𝑎!𝐺 − 𝑎!+ 𝑑! 𝑆 − 0, 𝛽 𝑆 !" !" = 𝑎!𝑆 − 𝑎! + 𝑑! 𝑀 !"! !" = 2(1 − 𝛼)𝑎!!𝑀′ − 𝑎!! + 𝑑!! 𝐺′ !"! !" = 𝑎!!𝐺!− 𝑎!! + 𝑑!! 𝑆! + 0, 𝛽 𝑆 !"! !" = 𝑎!!𝑆′ − 𝑎!! + 𝑑!! 𝑀′ (1) 632 (1) 633
Populations are described in Table 1, parameters in Table 2, the equivalent state transition 634
diagram is in Fig 2. 635
636 637
Vibert, J. and V. Thomas-Vaslin (2017). PLos Comput Biol 13 (3): e1005417. http://journals.plos.org/ploscompbiol/article?id=10.1371/journal.pcbi.1005417
33
Table 1. Cell populations described in the model and initial values used in the fit
638
according to our hypotheses.
639
Population
name Population description Initial value used for the fit
G Cells in G0 or G1 phase, unlabelled (𝐺 + 𝐺′)!! = !""!! !!!!! !!! !!!!! !!!!!!! !!!!! !!!!! S Cells in S phase, unlabelled (𝑆 + 𝑆′)!! = !""!!!! !!! !!!!! !!!!!!! !!!!! !!!!! M Cells in G2 or M phase, unlabelled (𝑀 + 𝑀′)!! = !"" !!!!! !!!!! !!! !!!!! !!!!!!! !!!!! !!!!! G' Cells in G0 or G1 phase, labelled 0 S' Cells in S phase, labelled 0 M' Cells in G2 or M phase, labelled 0 640 641
Vibert, J. and V. Thomas-Vaslin (2017). PLos Comput Biol 13 (3): e1005417. http://journals.plos.org/ploscompbiol/article?id=10.1371/journal.pcbi.1005417
34
Table 2. Model parameters and values used for the fit in our experimental
642
conditions.
643
Parameter
name Parameter description Value used for the fit
aG, aG' Rate of entry into S phase of G1 phase unlabelled, labelled cells
aG = aG ' = parameter to fit
aS, aS' Rate of entry into G2 phase of S phase unlabelled, labelled cells
aS = aS ' = 1/6.5 aM, aM' Rate of entry into cell division of M phase
unlabelled, labelled cells ato fit M = aM ' = parameter dG, dG' Rate of cell death, differentiation or
migration of G0/G1 phase unlabelled, labelled cells
dG = dG' = aG
dS, dS' Rate of cell death, differentiation or migration of S phase unlabelled, labelled cells
dS = dS' = 0
dM, dM' Rate of cell death, differentiation or
migration of G2/M phase unlabelled, labelled cells
dM = dM' = 0
α Proportion (0≤α≤1) of labelled M phase cells shedding label during cell division
α = 0 (no cell loses its label with cell
division) β Rate of labelling of S phase cells during the
pulse phase
β = ∞ (instant labelling by EdU)
p Proliferation rate Result of the fit
644
G, S, M are numbers of cells in G0/G1, S, G2/M phase of the cell cycle, 645
respectively. G’, S’, M’ are the corresponding EdU labelled cell numbers. aX terms 646
correspond to rates of entry into the next phase of cells in X phase (X being either G, S, 647
M or G’, S’, M’). The exit of cells, either due to death, differentiation, or migration is 648
represented by dX terms. EdU labelling intensity is modelled by two terms: β is the rate of 649
labelling of S phase cells by EdU, while α is the rate of loss of labelling by labelled cells 650
after division. To distinguish pulse and chase phases of the experiment, we have 651
introduced the symbol [0,β] , meaning that during the chase phase (no EdU) we use 0, 652
while during the pulse phase we use β in the equation (equivalent to a Dirac function 653
Vibert, J. and V. Thomas-Vaslin (2017). PLos Comput Biol 13 (3): e1005417. http://journals.plos.org/ploscompbiol/article?id=10.1371/journal.pcbi.1005417
35
multiplied by β , with the Dirac function equal to 1 during pulse and 0 during chase). The 654
proliferation rate is defined as p = aMM+aM'M' , i.e., it is the number of cells in G2/M 655
phase, unlabelled (M) and labelled (M'), which divide at rate aM (unlabelled) or aM' 656
(labelled). 657
A simulation is run by assigning: the twelve parameters of the cell cycle 658
(aG,aS,aM,dG,dS,dM) and (aG',aS',aM',dG',dS',dM'); the two parameters corresponding to de-659
labelling and labelling, respectively (α,β) ; the initial state of the cell populations 660
(G0,S0,M0) and (G'0,S'0,M'0) ; and the labelling protocol, i.e., the beginning and end of 661
pulse and chase phases. 662
Fit of simulations to experimental results
663
The results of simulations were fitted to experimental results represented by 664
EdU/DNA flow cytometry dot plots. On the dot plot, three groups of cells can be 665
individualized and their relative percentages determined according to EdU labelling and 666
DNA content: G0/G1 EdU-, G2/M EdU-, and EdU+. We therefore defined an 667
experimental result by three percentages: (Gexp,Mexp,(G'+S'+M')exp). To fit our model to 668
experimental results and to restrict the search for parameters, we made hypotheses listed 669
in Table 3: 670
-Hyp.1: Parameters during pulse and chase are equal, reducing to six the number of 671
parameters of the cell cycle, i.e., (aG,aS,aM,dG,dS,dM)=(aG',aS',aM',dG',dS',dM'). 672
-Hyp.2: EdU cell labelling is instantaneous, i.e., β=∞. While mathematically not 673
integrable as such, this is very simply implemented in the computer model by transferring 674
at the start of the pulse phase all unlabelled S cells to the labelled S compartment, and by 675
allowing the unmarked G1 cells to only go into the labelled S compartment during pulse 676
phase. 677
Vibert, J. and V. Thomas-Vaslin (2017). PLos Comput Biol 13 (3): e1005417. http://journals.plos.org/ploscompbiol/article?id=10.1371/journal.pcbi.1005417
36
-Hyp.3: There is no shedding of EdU label during the time of the experiment, i.e., α=0. 678
-Hyp.4: Cells are in a steady-state, and so is the distribution of cells in each cycle phase 679
((G+G')SS,(S+S')SS,(M+M')SS) as described by system of equations (2): 680 !(!!!!) !" = 0 !(!!!!) !" = 0 !(!!!!) !" = 0 (𝐺 + 𝐺′)!! = !""!! !!!!! !!! !!!!! !!!!!!! !!!!! !!!!! (𝑆 + 𝑆′)!! = !""!!!! !!! !!!!! !!!!!!! !!!!! !!!!! (𝑀 + 𝑀′)!! = !"" !!!!! !!!!! !!! !!!!! !!!!!!! !!!!! !!!!! (2) 681 with (𝐺 + 𝐺′)!!+ (𝑆 + 𝑆′)!!+ (𝑀 + 𝑀′)!! = 100(%). 682
As a consequence, the total number of cells during the experiment is constant and 683
percentages can be used. This also gives a conservation equation as follows: 684
aMM+aM'M'=dGG+ dSS+ dMM+ dG'G'+ dS'S'+ dM'M'. 685
-Hyp.5: There is no exit during S or G2/M phase (15), i.e., dS=dM=dS'=dM'=0. 686
-Hyp.6: One injection of EdU is modelled by a one-hour pulse (32). 687
-Hyp.7: S phase lasts 6.5 hours (15), i.e., aS=1/6.5. 688