HAL Id: hal-01252022
https://hal.sorbonne-universite.fr/hal-01252022
Submitted on 7 Jan 2016HAL is a multi-disciplinary open access archive for the deposit and dissemination of sci-entific research documents, whether they are pub-lished or not. The documents may come from teaching and research institutions in France or abroad, or from public or private research centers.
L’archive ouverte pluridisciplinaire HAL, est destinée au dépôt et à la diffusion de documents scientifiques de niveau recherche, publiés ou non, émanant des établissements d’enseignement et de recherche français ou étrangers, des laboratoires publics ou privés.
Carbon-13 labelling shows no effect of ocean
acidification on carbon transfer in Mediterranean
plankton communities
Laure Maugendre, Jean-Pierre Gattuso, A. de Kluijver, K. Soetaert, D. van
Oevelen, J.J. Middelburg, F. Gazeau
To cite this version:
Laure Maugendre, Jean-Pierre Gattuso, A. de Kluijver, K. Soetaert, D. van Oevelen, et al.. Carbon-13 labelling shows no effect of ocean acidification on carbon transfer in Mediterranean plankton communi-ties. Estuarine, Coastal and Shelf Science, Elsevier, 2015, �10.1016/j.ecss.2015.12.018�. �hal-01252022�
M
AN
US
CR
IP
T
AC
CE
PT
ED
ACCEPTED MANUSCRIPT
Journal: Estuarine, Coastal and Shelf Science (Special Issue Ocean Acidification)
Title: Carbon-13 labelling shows no effect of ocean acidification on carbon transfer in
Mediterranean plankton communities.
Authors: Maugendre L.1,2 *, Gattuso J.-P.1,2,3, de Kluijver A.4, Soetaert K.5, van Oevelen D.5, Middelburg J. J.6 & Gazeau F.1,2
[1] Sorbonne Universités, UPMC Univ Paris 06, UMR 7093, LOV, Observatoire Océanologique de Villefranche, 06230, Villefranche-sur-Mer, France
[2] CNRS-INSU, Laboratoire d’Océanographie de Villefranche, 06230 Villefranche-sur-Mer, France
[3] Institute for Sustainable Development and International Relations (IDDRI), Sciences Po, 27 rue Saint Guillaume, F-75007 Paris, France
[4] Deltares, Delft, The Netherlands
[5] Department of Ecosystems Studies, Royal Netherlands Institute for Sea Research (NIOZ), Yerseke, The Netherlands
[6] Department of Earth Sciences, Faculty of Geosciences, Utrecht University, The Netherlands
Corresponding author: L. Maugendre (laure.maugendre@gmail.com)
Highlights:
• Mesocosm experiments performed in two Mediterranean sites during two seasons
• Inorganic 13C was added to follow carbon transfer in plankton communities using biomarkers
• Summer community production dominated by slow-growing species is representative of stratified nutrient limited conditions
• Winter community initially dominated by fast-growing species evolved towards the dominance of slow-growing species due to nutrient limitation.
• No detectable effect of ocean acidification on production and carbon transfer during both experiments
Key words: Ocean acidification; plankton communities; carbon transfer; 13C and biomarkers; mesocosm experiments; Mediterranean Sea.
M
AN
US
CR
IP
T
AC
CE
PT
ED
ACCEPTED MANUSCRIPT
AbstractDespite an increasing number of experiments, no consensus has emerged on the effect of ocean acidification on plankton communities and carbon flow. During two experiments, performed in the Bay of Calvi (France, Corsica; summer 2012) and the Bay of Villefranche (France; winter 2013), nine off-shore mesocosms (~50 m3) were deployed among which three served as controls and six were enriched with CO2 to reach partial pressure of CO2 (pCO2) levels from 450 to 1350 µatm and 350 to 1250 µatm in the Bay of Calvi and the Bay of Villefranche, respectively. In each mesocosm, inorganic 13C was added in order to follow carbon transfer from inorganic via bulk particulate organic carbon and phytoplankton to bacteria by means of biomarkers as well as to zooplankton and settling particles. Despite very low plankton biomasses, labelled carbon was clearly transferred through plankton communities. Incorporation rates in the various plankton compartments suggested a slow-growing community based on regenerated production in the Bay of Calvi while in the Bay of Villefranche, fast-growing species were clearly dominating community production at the start with a shift toward slow-growing species during the experiment due to nutrient limitation. Both bulk and group-specific productions rates did not respond to increasing pCO2 levels. These experiments were the first conducted in the Mediterranean Sea under low nutrient concentrations and phytoplankton biomasses and suggest that ocean acidification may not significantly impact plankton carbon flows in low nutrient low chlorophyll (LNLC) areas.
M
AN
US
CR
IP
T
AC
CE
PT
ED
ACCEPTED MANUSCRIPT
1.
Introduction
The ocean is the largest active reservoir of carbon on Earth, absorbs about 2.6 ± 0.5 Pg C yr-1 (Le Quéré et al., 2014) and has a key role in regulating carbon flow on Earth. Carbon dioxide (CO2) fluxes from the atmosphere to the ocean are partly controlled by primary production, community respiration and organic matter (OM) export to the deep-sea, the so-called biological pump. Primary production rates in the surface layer depend on environmental conditions such as temperature, water-column structure (mixed vs. stratified), irradiance levels and nutrient availability. The freshly produced OM can be consumed by zooplankton or exported to the deep-sea but a large fraction is respired and degraded by heterotrophic bacteria in the upper layer producing CO2 as well as recycled inorganic nutrients brought back in the ecosystem (Rivkin and Legendre, 2001). The CO2 equilibrium between atmosphere and ocean is then dependent on the trophic status and metabolic state of surface plankton communities.
Over the last century, CO2 concentration in the atmosphere has increased at an unprecedented rate in the Earth’s history due to human activities, warming the lower atmosphere and the ocean. Furthermore, 26% of the emitted CO2 dissolves in seawater (Le Quéré et al., 2014) causing an acidification of the ocean with potential effects on plankton metabolic rates in the upper layer (Riebesell and Tortell, 2011). Dissolved CO2 is the main substrate for photosynthesis but the activity of the RuBisCO, the enzyme necessary for carbon fixation, is suboptimal at CO2 concentrations present in ocean surface waters (Reinfelder, 2011). Therefore, primary production rates might increase under elevated CO2 levels resulting in carbon overconsumption relative to other nutrients (Riebesell et al., 2007). This could further alter phytoplankton-derived dissolved organic matter (DOM) production and composition (Engel et al., 2004; Riebesell et al., 2007), and consequently increase bacterial carbon consumption as DOM is the main substrate for their growth (Grossart et al., 2006). In
M
AN
US
CR
IP
T
AC
CE
PT
ED
ACCEPTED MANUSCRIPT
parallel, the formation of C-rich aggregates could also increase carbon export and therefore the efficiency of the biological pump (Engel et al., 2004). Furthermore, due to differences in carbon fixation pathways between phytoplankton species, carbon export capacities of the surface ocean could be altered due to modifications of phytoplankton community size structure and sinking capacities (Klaas and Archer, 2002). An significant number of experiments have assessed the effects of ocean acidification on plankton composition and functioning. These studies provided variable and sometimes conflicting results, preventing the development of a general concept on the effects of ocean acidification (see Riebesell and Tortell 2011 for review). For instance, in some studies, ocean acidification has been shown to modify the community structure towards more diatoms (Tortell et al., 2008; 2002) or towards smaller species (Brussaard et al., 2013). In other studies, no changes were found (Nielsen et al., 2010; 2012).
As the functioning of plankton communities depends on many ecological interactions between biotic and abiotic compartments, there is a strong need to study natural assemblages rather than individual species or strains. Carbon flow within natural plankton communities has been studied using stable isotopes labelling coupled with biomarkers (Middelburg et al., 2000; van den Meersche et al., 2011). The addition of 13C dissolved inorganic carbon and subsequent transfer to phytoplankton, heterotrophic bacteria as well as zooplankton and sinking particles, allows following carbon transfer through plankton communities. The estimation of carbon incorporation in various taxonomic groups can be performed through the analysis of 13C enrichment in phospholipids derived fatty acids (PLFA) biomarkers. PLFA are cell membrane components, produced by phytoplankton and heterotrophic bacteria, which occur in relatively fixed proportion in cells and allow distinguishing among groups of organisms (Middelburg, 2014). As PLFA degrade rapidly after cell death, they therefore largely reflect the activity of living cells (Boschker and Middelburg, 2002). The combination
M
AN
US
CR
IP
T
AC
CE
PT
ED
ACCEPTED MANUSCRIPT
of 13C stable isotope labelling with biomarkers analyses and particulate organic carbon has been used to determine production rates at taxon-specific (Dijkman et al., 2009) and community level (Van den Meersche et al., 2004, 2011; De Kluijver et al., 2010; 2013).
To date, two experiments have focused on the effect of ocean acidification on the flow of carbon within plankton communities through the use of 13C stable isotope labelling combined with biomarkers analyses. The first experiment was performed in the frame of the PeECE III project (Riebesell et al., 2008) in land-based mesocosms following initial nutrient additions (N and P). Group specific primary production rates increased with elevated pCO2 during the post-bloom period, while no effects were found on phytoplankton-bacteria coupling nor on export rates (De Kluijver et al., 2010). The second experiment was performed in Arctic waters using large offshore mesocosms (Riebesell et al., 2013). Heterotrophic bacteria and two phytoplankton groups were distinguished based on their PLFA composition: mixotroph and autotrophic phytoplankton (De Kluijver et al., 2013). While no effects of CO2 on particulate organic carbon (POC) production rates were detected before nutrient addition, POC production rates decreased with increasing partial pressure of CO2 (pCO2) after nutrient addition. In contrast, no CO2 effects on bacterial production were highlighted both under nutrient-depleted or -replete conditions. Depending on the experimental period considered, positive or negative effects of CO2 on phytoplankton and mixotroph production rates, zooplankton grazing and export of detritus were highlighted. The effects of ocean acidification during this experiment were subtle and different for each phase (before and after nutrient addition).
Most of the experiments conducted at community level (including mesocosm experiments) have been performed during a natural or artificial phytoplankton bloom that only occurs during a restricted period of the year and may not reflect the physiological state of plankton community and ecosystem trophic state for most of the year. There is therefore a
M
AN
US
CR
IP
T
AC
CE
PT
ED
ACCEPTED MANUSCRIPT
strong lack of data for warm, low nutrient and productivity regions although these areas represent a vast majority of the surface ocean (> 60%, Longhurst et al., 1995). However, a recent study in the Northwestern Mediterranean sea has shown a substantial effect of ocean acidification on plankton communities (phytoplankton abundances and bacterial activities and abundances) under very low nutrient concentrations (Sala et al., 2015) in 200 L laboratory mesocosms (controlled temperature, light intensity and light-dark cycles).
The Mediterranean Sea is oligotrophic for most of the year although several biogeographical provinces have been identified (D’Ortenzio and D’Alcalà, 2009). The pH decrease in this region has been estimated to be ~ 0.15 pH units since the industrial revolution (Touratier and Goyet, 2009) and an additional decrease of 0.3 to 0.4 units is foreseen for the end of the century (Geri et al., 2014). The effect of ocean acidification on plankton communities has been investigated based on mesocosm experiments conducted in two different sites of the Northwestern Mediterranean Sea (Gazeau et al., sbm a, this issue). This manuscript reports on the first 13C labelling study on Mediterranean plankton communities in the frame of a mesocosm experiment focused on ocean acidification.
M
AN
US
CR
IP
T
AC
CE
PT
ED
ACCEPTED MANUSCRIPT
2.
Material and Methods
2.1 Study sites, experimental set-up and sampling
Two mesocosm experiments were carried out: one in the Bay of Calvi (BC; Corsica, France) in June-July 2012 and the other in the Bay of Villefranche (BV; France) in February-March 2013. The experimental set-up and mesocosm characteristics are described in Gazeau et al. (sbm a, this issue). In brief, for each experiment, nine mesocosms of ca. 50 m3 (2.5 m in diameter and 12 m maximum depth) were deployed for 20 and 11 days in BC and BV, respectively. Once the bottom of the mesocosms was closed, acidification of the mesocosms was performed over 4 days by homogenous addition of various volumes of CO2-saturated seawater to obtain a pCO2 gradient from ambient levels to an intended 1250 µatm, with three control mesocosms (C1, C2 and C3) and six mesocosms with increasing pCO2 (P1 to P6). In BC, the six targeted elevated pCO2 levels were P1: 550, P2: 650, P3: 750, P4: 850, P5: 1000 and P6: 1250 µatm. In BV, the levels were P1: 450, P2: 550, P3: 750, P4: 850, P5: 1000 and P6: 1250 µatm. Mesocosms were grouped in clusters of 3 with each cluster containing a control, a medium and a high pCO2 level (cluster 1: C1, P1, P4; cluster 2: C2, P2, P5 and cluster 3: C3, P3, P6). During the last day of CO2 saturated seawater addition, 13C sodium bicarbonate (NaH13CO3; 99%) was added to each mesocosm to increase the isotopic level (δ13C signature) of the dissolved inorganic carbon pool (δ13C-DIC) to ca. 200‰ in BC and 100‰ in BV. In BC, on day 11, a second addition of NaH13CO3 was performed to better constrain production rates and this resulted in a further enrichment of the DIC pool to ca. 270‰.
Every morning, depth-integrated samplings (0-10 m) were performed using 5 L Hydro-Bios integrated water samplers and sampled seawater was used for various analyses such as dissolved inorganic carbon and total alkalinity that were used to compute integrated pH and pCO2 levels (Gazeau et al., sbm a, this issue), particulate organic matter measured on
M
AN
US
CR
IP
T
AC
CE
PT
ED
ACCEPTED MANUSCRIPT
an elemental analyzer (Gazeau et al., sbm a, this issue), nitrate+nitrite (NOx) and phosphate (PO43-) measured at nanomolar level by Liquid Waveguide Capillary Cell (Louis et al., sbm, this issue), ammonium concentrations measured using an autoanalyser (Skalar) in BC and using a manual fluorometric method in BV (see Gazeau et al., sbm a, this issue, for more details), microbial abundances by flow cytometry (Celussi et al., in press, this issue) and pigment concentrations measured by high performance liquid chromatography (Gazeau et al., sbm b, this issue). Daily samples for δ13C-DIC, δ13C-particulate organic carbon (δ13C-POC) and δ13C-phospholipid derived fatty acids (δ13C-PLFA) were taken at the beginning (day 0 to 15 in BC and day 0 to 4 in BV) and every second day toward the end of the experiments. The sediment traps were emptied every day in BC or every other day in BV and samples were immediately preserved with pH buffered formaldehyde. In BC, a single zooplankton net haul (200 µm mesh size) was performed in each mesocosm at the end of the experiment so as not disturb the mesocosms during the experiment. Unfortunately, in BV, a storm caused an unintended opening of the mesocosms on day 13 (Gazeau et al. sbm a, this issue, for details) and no zooplankton net haul could be done during this experiment.
For δ13C-DIC analyses, 20 mL of sampled seawater was gently transferred to glass vials avoiding bubbles and vials were sealed after being poisoned with 10 µL saturated HgCl2 and stored upside-down at room temperature in the dark pending analysis. For δ13C-POC, sampled seawater (0.5 to 1 L) was immediately filtered on pre-weighed and pre-combusted 25 mm GF/F. Filters were dried at 60 °C and stored in a dry place pending analysis. Samples for
δ13C-PLFA analyses (~4 L) were filtered through 47 mm pre-combusted GF/F filters, which
were subsequently stored at -80 °C. Zooplankton samples of the final net haul were transferred to 0.2 µm filtered seawater for 30 min to empty their guts. One to ten individuals of the two species Paracalanus spp. and Oncaea spp., that were found in nearly all mesocosms, were transferred to pre-combusted tin cups and were stored at -80 °C for organic
M
AN
US
CR
IP
T
AC
CE
PT
ED
ACCEPTED MANUSCRIPT
δ13C analyses. For sediment trap samples, swimmers larger than 1 mm were removed (and
discarded) and the remaining material was rinsed, centrifuged and freeze-dried. In BC, as a consequence of low amounts of material especially at the end of the experiment, daily sediment traps samples were pooled as follows: days 5-7, 8-10, 11-14 and 15-19. Total particulate matter was weighed for flux determination and subsamples were used for POC and
δ13C-POC measurements.
2.2 Laboratory analyses
Sample preparations and measurements for δ13C analyses were performed at the Netherlands Institute of Sea Research (NIOZ-Yerseke; The Netherlands) except for measurements of sediment traps δ13C-POC in BV that were performed at the Laboratoire d’Océanographie de Villefranche (LOV; France). At NIOZ-Yerseke, δ13C-POC samples were analyzed on an elemental analyzer (EA; Thermo Electron Flash 1112) coupled to a Delta V isotope ratio mass spectrometer (IRMS). At LOV, δ13C-POC samples were analyzed on an elemental analyzer (Elementar Vario Pyrocube) coupled to an Isoprime 100 IRMS. For δ13 C-DIC analyses, a helium headspace (3 mL) was created in the vials and samples were acidified with 2 µ L of phosphoric acid (H3PO4, 99%) to transfer all DIC to gaseous CO2. After equilibration, the CO2 concentration in the headspace and its isotopic composition were measured on an EA-IRMS. PLFA were extracted using a modified Bligh & Dyer method (Middelburg et al., 2000). In brief, after extraction of total lipids in a methanol:chloroform mix, lipids were separated into different polarity classes on a column separation using previously heat activated silica. After elution with chloroform and acetone, the methanol fraction was collected and PLFA were derivatized to fatty acid methyl esters (FAME). The standards 12:0 and 19:0 were used as internal standards. Concentrations and δ13C of individual PLFA were measured using gas chromatography-combustion isotope ratio mass spectrometry (GC-c-IRMS). In BC, due to very low concentrations, daily PLFA samples were
M
AN
US
CR
IP
T
AC
CE
PT
ED
ACCEPTED MANUSCRIPT
pooled by two days after the extraction step.
2.3 Data analyses
Carbon isotope data are expressed in the delta notation (δ) relative to Vienna Pee Dee Belemnite (VPDB) standard and are presented as specific enrichment (∆δ13C) and 13C incorporation (Middelburg, 2014). The specific enrichment ∆δ13C was calculated as δ13Csample
–δ13Cbackground with δ13Cbackground being the isotope ratio under natural conditions (before 13C
addition). The carbon isotope ratio was calculated as Rsample = (δ13Csample/1000+1) x RVPDB, with RVPDB = 0.011237. The 13C fraction was calculated as: 13F = 13C/(13C+12C) = R/(R+1). The excess 13C was obtained as ∆13F = 13Fsample - 13Fbackground. Incorporation was then calculated as 13C-incorporation = ∆13F x C (µmol 13C L-1; De Kluijver et al., 2010) with C being POC or PLFA concentrations in µmol C L-1. In order to directly compare values between mesocosms, data were corrected for the different initial δ13C-DIC using a correction factor calculated as the ratio between δ13C-DIC in each mesocosm to the average δ13C-DIC in all mesocosms at day 0. This ratio varied from 0.92 to 1.21 in BC and from 0.72 to 1.22 in BV. δ13C-DIC data were corrected for air-sea gas exchanges using the method described in Czerny et al. (2013).
Different PLFA were detected depending on the experiment and higher PLFA concentrations and more diversity were measured in BV than in BC. Only a few PLFA are taxon specific with many PLFA shared by several groups (Dalsgaard et al., 2003) and in the same taxon there are strain specific differences in PLFA composition (Dijkman and Kromkamp, 2006). Therefore, an approach combining several indicators is recommended to infer the plankton composition (Dalsgaard et al., 2003). Two specific PLFA, detected in both experiments (ai15:0 and i15:0), were used to identify heterotrophic bacteria (Kaneda, 1991). For phytoplankton, identification at the species or taxon level was too complex, and only two phytoplankton groups were distinguished by combining information on PLFA ratios and
M
AN
US
CR
IP
T
AC
CE
PT
ED
ACCEPTED MANUSCRIPT
PLFA biomarker attribution based on the literature. In a first step, for both experiments, the ratios 16:1ω7/16:0 <1 as well as 20:5ω3/22:6ω3 <1 indicated a low living biomass and the presence of aggregates from senescent and/or degrading diatoms as well as dominance of dinoflagellates and flagellates over diatoms (Tolosa et al., 2004; Balzano et al., 2011). These ratios allow inferring that C16 and 20:5ω3 are not specifically attributed to diatoms but to other phytoplankton groups sharing the same PLFA. In BC, PLFA that showed a delayed δ13C incorporation (18:1ω9c, 20:5ω3 and 22:6ω3) likely representing heterotrophic dinoflagellates and flagellates as well as some haptophytes (Dalsgaard et al., 2003; Brinis et al., 2004; Dijkman and Kromkamp, 2006; Rossi, 2006), were grouped. Their weighted δ13C ratio and sum of concentrations were used to describe a general slow-growing phytoplankton group termed Phyto2. The PLFA that showed a comparatively fast incorporation were 16:2ω4, 18:4ω3 and 18:3ω3 and their weighted δ13C ratio was used to characterize fast-growing phytoplankton (Phyto1) comprising cyanophytes, chlorophytes (prasinophyceae and chlorophyceae) and other haptophytes (Viso and Marty, 1993; Dalsgaard et al., 2003; Dijkman and Kromkamp, 2006). In BV, a slow-growing phytoplankton group Phyto2 containing 16:4ω3, 20:5ω3 and 22:6ω3 was considered and comprised heterotrophic dinoflagellates, some haptophytes and some diatoms. The fast incorporating group Phyto1 contained the following PLFA: 16:2ω4, 18:2ω6c, 18:3ω3, 18:4ω3, 18:5ω3(12-15) and 18:5ω3(12-16), and comprised cryptophytes, some haptophytes, chlorophytes and autotrophic dinoflagellates (Viso and Marty, 1993; Dalsgaard et al., 2003; Dijkman and Kromkamp, 2006; Adolf et al., 2007; Taipale et al., 2013, 2009). The sum of characteristic PLFA concentrations were converted to total carbon concentrations using conversion factors of 0.01, 0.06 and 0.05 µg C PLFA / µg C for heterotrophic bacteria, fast-growing Phyto1 and slow-growing Phyto2, respectively (Van Den Meersche et al., 2004; Dijkman et al., 2009; De Kluijver et al., 2013).
M
AN
US
CR
IP
T
AC
CE
PT
ED
ACCEPTED MANUSCRIPT
Primary production rates were calculated based on 13C incorporation in POC as well as in PLFA characteristic of each phytoplankton group and for each time interval using the equation:
PP = [∆(13Fbiomass · C biomass)/∆t – 13Fmean;biomass (∆C biomass /∆t)] / [13Fmean;DIC – 13Fmean;biomass] (1) in µmol C L-1 d-1 with, 13Fbiomass the 13C fraction in the considered biomass (PLFA fast- and slow-growing phytoplankton or POC), Cbiomass the concentration of the considered biomass in µmol C L-1, ∆t is the time interval in days, 13Fmean;biomass is the average 13C fraction in the considered biomass (PLFA or POC) for the time interval and 13Fmean;DIC is the average 13C fraction in DIC for the considered time intervals.
By the end of the experiment, stable isotope patterns approached steady state and the ratio of the enrichment in consumers (∆δ13Ccons) to the enrichment of the substrate (∆δ13Csubst) can then be used to quantify the dependency of consumers on the resource (Van Oevelen et al., 2006; Middelburg, 2014).
2.4 Model description
Having isotope enrichment data (∆δ13C) at multiple time steps allows using a simple sink-source isotope ratio model based on that of Hamilton et al. (2004) in which the isotopic composition of a consumer is altered by the uptake of the source compartments minus any losses. This model is based on two assumptions: that labelled DIC concentration is known within the mesocosm at each time point and that the biomass of consumers is at steady state with time. This model allows estimating the turnover rate of phytoplankton and heterotrophic bacterial groups (r, d-1). Here we apply a phytoplankton-bacteria-detritus model, with two phytoplankton types (Phyto1 and Phyto2 for the fast and slow incorporation groups, respectively), to model the 13C data of this study:
d ∆ δ13CPhyto1 / d t = rPhyto1 (∆ δ13CDIC - ∆ δ13CPhyto1) (2)
M
AN
US
CR
IP
T
AC
CE
PT
ED
ACCEPTED MANUSCRIPT
d ∆ δ13Cbact / d t = rbact (∆ δ13CPhyto1 - ∆ δ13Cbact) (4)
d ∆ δ13Cdet / d t = rPhyto1 (∆ δ13CPhyto1 - ∆ δ13Cdet) + rPhyto2 (∆ δ13CPhyto2 - ∆ δ13Cdet) + rbact (∆
δ13Cbact - ∆ δ13Cdet) (5)
This model was implemented in the R software (R core team 2013), using the R-packages packages deSolve (Soetaert et al., 2010) and fitted to the data using the R-package FME (Soetaert and Petzoldt, 2010). It was applied to the experimental periods of 20 and 9 days in BC and BV, respectively. More details and earlier applications of the model can be obtained in Van Oevelen et al. (2006) and De Kluijver et al. (2010). This simple modeling approach allows derivation of model parameters with uncertainty.
2.5. Statistics
In order to identify differences between pCO2 treatments, stepwise multiple linear regression analyses were performed to establish relationships between estimated parameters and processes and environmental/experimental conditions including pCO2. Other environmental conditions that have been considered were temperature, salinity and nutrients (NOx, NH4+ and PO43-). Integrated levels of temperature and salinity were acquired through daily CTD casts performed in each mesocosm. Furthermore, cumulative productions were calculated as the sum of production rates calculated from equation (1) for the available experimental period and were related to increased pCO2 levels (averages during the experiments) using linear regression. All regressions were performed using the R software (version 3.1; www.r-project.org) and were considered significant at a probability p < 0.01 and marginally significant at a probability p < 0.05.
M
AN
US
CR
IP
T
AC
CE
PT
ED
ACCEPTED MANUSCRIPT
3.
Results
3.1 Environmental and experimental conditions during both experiments
Ambient pCO2 levels were higher in BC in summer as compared to BV in winter (~450
vs. 350 µatm respectively; Fig. S1). While pCO2 levels slightly decreased in BC after the acidification phase during the course of the experiment, especially for high CO2 mesocosms (P5 and P6), drops in pCO2 levels were much more important in BV due to strong winds (see Gazeau et al. sbm a, this issue for more details) with mesocosms P1 to P4 showing very similar levels by the end of the experiment. In BC, NOx and PO43- were very low: NOx always remained below 150 nmol L-1 while PO43- average was 9 ± 4 nmol L-1 (data not shown; Louis et al., sbm, this issue). Ammonium levels averaged 0.37 ± 0.18 µmol L-1 (data not shown) without specific time evolution. This N/P co-limitation likely prevented the development of a phytoplankton bloom as shown by a mean chlorophyll a concentration of 70 ± 10 ng L-1 (Fig. S1). Haptophytes and cyanophytes were dominating the phytoplankton community (data not shown; Gazeau et al., sbm b, this issue).
In BV, nutrient levels were initially higher than in BC but NOx and PO43- were rapidly consumed during the acidification period leading to an unusual, at this period of the year, N and P co-limitation when the experiment started (data not shown; Louis et al., sbm, this issue). Ammonium concentrations were lower than in BC averaged 0.05 ± 0.01 µmol L-1 (data not shown) and tended to decrease during the experiment. The average chlorophyll a concentration was however much higher (987 ± 147 ng L-1) than in BC (Fig. S1) and the community was dominated by cryptophytes and haptophytes (data not shown; Gazeau et al., sbm b, this issue).
Chlorophyll a was not affected by CO2 during both experiments (Gazeau et al., sbm b, this issue) and displayed a stationary trend over time in BC while slightly decreasing during the experiment in BV (Fig. S1). Nutrient concentrations were also not impacted by CO2
M
AN
US
CR
IP
T
AC
CE
PT
ED
ACCEPTED MANUSCRIPT
during both experiments (Louis et al., sbm, this issue). Heterotrophic bacteria abundances did not respond to increase pCO2 (Celussi et al., in press, this issue).
3.2 Carbon flow in the Bay of Calvi 3.2.1. Labelling results: DIC and POC
The addition of NaH13CO3 led to an increase of ∆δ13C-DIC in all mesocosms to an average (± SD) of 224 ± 16‰ that steadily decreased to a minimum of 194 ± 12‰ at day 10 before the second addition was performed. This latter further increased ∆δ13C-DIC to 270 ± 13‰ (Figure 1a). The 13C-DIC concentration varied during the whole experimental period from 7.3 to 4.2 µmol 13C L-1, accounted for 0.19 to 0.30% of total DIC concentration and followed the same temporal pattern as described for ∆δ13C-DIC. The decrease in 13C-DIC concentrations occurred in all mesocosms independent of pCO2 level. Losses through air-sea exchange were negligible (< 0.7% 13C-DIC; data not shown).
Incorporation into POC was rapid and a first plateau starting at day 9 was reached with an average (± SD) ∆δ13C-POC in all mesocosms of 86 ± 8‰. The second addition of NaH13CO3 on day 11 led to a further increase in ∆δ13C-POC until day 15 when a second plateau was reached (average ± SD of all mesocosms: 122 ± 18‰; Figure 1a). The 13C-POC concentration varied, following the same temporal pattern as for ∆δ13C-POC, from 3.6 to 58.2 10-4 µmol 13C L-1. The ratio of ∆δ13C-POC / ∆δ13C-DIC reached a maximum of 0.54 ± 0.04 (average ± SD of all mesocosms) at the end of the experiment and differences among mesocosms were not related to pCO2 levels (Table 1). Ratios remained below 1 indicating a large inert (non-reacting) detritus pool.
3.2.2. Phytoplankton and bacteria dynamics: labelling and biomass
The averaged ∆δ13C-Phyto2 steadily increased to an average between all mesocosms (± SD) of 123 ± 16‰ and the second NaH13CO3 addition on day 11 allowed an additional increase to 167 ± 27‰ (Figure 1a). The fast-growing phytoplankton (Phyto1) incorporated
M
AN
US
CR
IP
T
AC
CE
PT
ED
ACCEPTED MANUSCRIPT
13C much faster and on day 6 a first saturation plateau was reached at an average (± SD) between all mesocosms of 170 ± 12‰. After the second NaH13CO3 addition, ∆δ13C-Phyto1 increased again until the end of the experiment to 187 ± 27‰ (average of all mesocosms ± SD; Figure 1a). The ∆δ13C-bacteria steadily increased to reach a final average (± SD) maximum of 136 ± 17‰ (Figure 1a).
The final ratios of ∆δ13C-Phyto1 / ∆δ13C-DIC and ∆δ13C-Phyto2 / ∆δ13C-DIC reached an averaged (± SD) maximum of 0.82 ± 0.07 and 0.73 ± 0.06, respectively. The ratio ∆δ13 C-bacteria / ∆δ13C-all phytoplankton averaged 0.80 ± 0.15 at the end of the experiment and were independent of pCO2 levels (Table 1). Heterotrophic bacteria growth was based on Phyto1 or Phyto2 products as bacteria isotope ratios (∆δ13C) were below isotope ratios of fast and slow growing phytoplankton. The 13C content of Phyto1, Phyto2 and heterotrophic bacteria, used to estimate production rates, increased during the experiment (Figure 2a, b and c) until day 15 after which labelling reached a plateau.
Biomass of Phyto1 was very low and increased from an average (± SD) between all mesocosms of 0.013 ± 0.003 to 0.03 ± 0.01 µmol C L-1 (Figure 3a), reflecting the increase in chlorophyll a until day 12 (Figure S1). The estimated biomass of Phyto2 tended to increase over the experimental period from an average (± SD) between all mesocosms of 0.06 ± 0.01 to 0.12 ± 0.04 µmol C L-1 (Figure 3a). Heterotrophic bacterial biomass based on PLFA varied from an average (± SD) between all mesocosms of 0.021 ± 0.007 to 0.06 ± 0.03 µmol C L-1 (Figure 3a) and tended to increase during the experiment although this was not evidenced based on flow cytometry data (Celussi et al., in press; see Figure S1). No relationships between pCO2 and biomasses of the different compartments were found using the stepwise multiple regression analysis approach (Table 2) but with nutrient concentrations and temperature.
M
AN
US
CR
IP
T
AC
CE
PT
ED
ACCEPTED MANUSCRIPT
3.2.3. Primary production based on POC and PLFA
Based on POC labelling, net community production rates (NCP-13C) globally averaged 0.15 ± 0.01 µmol C L-1 d-1 with large variations between mesocosms and sampling days. Stepwise analyses reveal no effect of increasing pCO2 and no significant relationships with any other environmental parameters (Table 2). Meanwhile, cumulative productions ranged from 1.12 to 2.29 µmol C L-1 with no significant trend with increasing pCO2 (Figure 4a; n = 9, r = - 0.51, p > 0.05). Both phytoplankton groups did not show any particular temporal trend and the Phyto2 group was more productive with the lowest cumulative production in P6 (0.02 µmol C L-1) and the highest in P2 (0.19 µmol C L-1). No linear trend with increasing pCO2 levels was observed for both phytoplankton groups on cumulative productions (Figure 4b; n = 9, r = -0.49, p > 0.05 and n = 9, r = -0.35, p > 0.05, for Phyto1 and Phyto2, respectively). Stepwise analyses reveal no effect of increasing pCO2 and no significant relationships with any other environmental parameter for the primary production of Phyto2 (Table 2) while Phyto1 production rates followed the same trend than temperature (Table 2).
3.2.4. Zooplankton and sediment traps
Specimens of the copepod Paracalanus spp. were present in samples from all mesocosms except P1 and P2 and specimens of Oncaea spp. were found in all samples except for mesocosm P3. Paracalanus showed a higher specific enrichment (∆δ13C; average 108 ± 10‰; Figure 5) than Oncaea (average 60 ± 10‰). Both species were less labelled in P6 but there was no significant effect of pCO2 on zooplankton 13C enrichment (Figure 5;
Paracalanus: n = 7, r = - 0.73, p > 0.05; Oncaea: n = 8, r = - 0.31, p > 0.05).
Transfer of 13C to sediment traps was fast, as after 2 days an increase in sediment-trap 13
C-POC was measured and 13C-POC of settlings particles increased with time (Figure 2d). The stepwise multiple regression analysis revealed no relationship between pCO2 and labelled settling particles but a significant relationship with temperature, as both parameters increased
M
AN
US
CR
IP
T
AC
CE
PT
ED
ACCEPTED MANUSCRIPT
during the experimental period, and a marginal relationship with NOx (Table 2). Cumulative 13
C labelling in settling particles was also independent of pCO2 (linear regression on daily cumulative labelled materials: n = 9, r = 0.23, p > 0.05).
3.3 Carbon flow in the Bay of Villefranche 3.3.1. Labelling results: DIC and POC
The addition of NaH13CO3 led to an increase in ∆δ13C-DIC to 92 ± 15‰ (average ± SD between all mesocosms) that steadily decreased to a minimum of 41 ± 12‰ until day 9 (Figure 1b). The 13C-DIC concentration varied during the whole experimental period between an average between all mesocosms of 0.6 and 2.9 µmol 13C L-1 and followed the same pattern as described for ∆δ13C-DIC. Losses by air-sea exchange calculated during the experiment were more important than in BC and were dependent on the considered mesocosm. Control mesocosms presented similar negative air-sea fluxes while perturbed mesocosms (P1 to P6) presented positive fluxes with a 13C outgassing up to 3% of 13C-DIC in the most acidified mesocosms (P5 and P6; data not shown), explaining partly the decrease in 13C-DIC observed during the experiment.
Incorporation into POC was rapid and on day 6 a plateau was reached with ∆δ13 C-POC (average ± SD of 35 ± 7‰; Figure 1b) and with a final value on day 9 of 33 ± 7‰. 13 C-POC concentrations varied, following the same pattern as for ∆δ13C-POC, from 1.3 to 48.8 10-4 µmol 13C L-1. The ratio of ∆δ13C-POC / ∆δ13C-DIC reached a average (± SD) maximum of 0.83 ± 0.11 at the end of the experiment when nearly all the particulate material had been labelled and was independent of pCO2 levels (Table 1).
3.3.2. Phytoplankton and bacteria dynamics: biomass and labelling
The ∆δ13C-Phyto2 steadily increased until day 9 to 38 ± 7‰ while ∆δ13C-Phyto1 reached 46 ± 10‰. The ∆δ13C of heterotrophic bacteria was similar to ∆δ13C-Phyto2 with an average between all mesocosms (± SD) of 36 ± 5‰ on day 6 (Figure 1b) and to 42 ± 11‰ on
M
AN
US
CR
IP
T
AC
CE
PT
ED
ACCEPTED MANUSCRIPT
day 9, however only values for C1 and C3 are available for the last day. After that day, ∆δ13 C-DIC, POC and PLFA were at isotopic equilibrium and no other NaH13CO3 addition could be done to stimulate further 13C incorporation into particulate matter (Figure 1b) due to a storm event (see Material and Methods).
Ratio of ∆δ13C-Phyto1 / ∆δ13C-DIC and ∆δ13C-Phyto2 / ∆δ13C-DIC reached an averaged (± SD) maximum of 1.1 ± 0.1 and 1.0 ± 0.1, respectively meaning that all 13C was incorporated into particulate phytoplankton biomass (Table 1). Final ratio ∆δ13C-bacteria /
∆δ13C-all phytoplankton on day 6 averaged (± SD) 0.60 ± 0.07. All final ratios were
independent of pCO2 levels (Table 1).
The 13C-biomasses showed more variability between mesocosms than during the experiment in BC (Figure 6a, b and c) and heterotrophic bacteria were very difficult to identify based on PLFA especially at the end of the experiment. Fast- and slow-growing phytoplankton 13C-biomasses increased during the experiment (Figure 6a, b and c) until days 6 and decreased between day 6 and 9.
Biomasses estimated using PLFA for the two phytoplankton groups were higher than in BC (Figure 3b) and biomasses tended to decrease over the course of the experiment (9 days) with a large variability between mesocosms as also observed with chlorophyll a concentrations (Figure S1). During this experiment, fast- and slow-growing phytoplankton showed similar concentrations. Biomass of Phyto1 was on average (± SD) 1.7 ± 0.3 and 0.8 ± 0.5 µmol C L-1 on day -1 and 9 while biomass of Phyto2 was on average (± SD) 1.7 ± 0.3 and 1.0 ± 0.7 µmol C L-1 on day -1 and 9, respectively. Heterotrophic bacterial biomass based on PLFA was higher than in BC with an average (± SD) during the experiment 0.15 ± 0.02 µmol C L-1, and showed no clear temporal trend (Figure 3c) in contrast to flow cytometry data that showed an increase in heterotrophic bacteria cell abundances during the course of the experiment (Figure S1). Stepwise multiple regression analyses did not reveal a pCO2 effect on
M
AN
US
CR
IP
T
AC
CE
PT
ED
ACCEPTED MANUSCRIPT
any of the estimated biomasses but a marginal relationship between Phyto1 and NH4+ (Table 2.).
3.3.3. Primary production based on POC and PLFA
Net community production based on the incorporation of 13C into POC (NCP-13C) decreased during the experiment from an average (± SD) between all mesocosms of 1.03 ± 0.24 to -0.09 ± 0.41 µmol C L-1 d-1. As 13C-POC was equilibrated already with 13C-DIC on day 6, no estimate of NCP-13C could be obtained for the rest of the experiment. Stepwise multiple regression analysis did not reveal any pCO2 effect on this process (Table 2) but with salinity, temperature and NOx. Cumulative productions from day 0 to 6 varied from 2.1 to 5.9 µmol C L-1 in P4 and P1 respectively and were not correlated to pCO2 levels (Figure 4c; n = 9, r = - 0.08, p > 0.05). In contrast to what has been observed in BC, the two considered phytoplankton groups presented a clear temporal trend based on their production rates. Production rates of slow-growing phytoplankton (Phyto2), were rather constant during the first four days of the experiment but further decreased with final cumulative productions ranging from 0.53 to 1.05 µmol C L-1 (Figure 4d). Phyto1 presented higher cumulative production rates (Figure 4d) although they decreased over the course of the experiment. Cumulative productions did not correlate with increasing pCO2 levels (Figure 4d; Phyto1: n = 9, r = -0.45, p > 0.05; Phyto2: n = 9, r = -0.17, p > 0.05). Stepwise multiple regression analysis did not reveal relationship with pCO2 levels (Table 2) but as for NCP-13C with salinity, temperature, NH4+ and NOx.
3.3.4. Zooplankton and sediment traps
As mentioned in the Material and Methods section, no samples were available for zooplankton. As in BC, transfer of 13C to sediment traps was fast and on day 1 an increase in sediment-trap 13C-POC was already measured. 13C-POC of settlings particles increased with time (Figure 6d). The stepwise multiple regression analysis did show a negative effect of
M
AN
US
CR
IP
T
AC
CE
PT
ED
ACCEPTED MANUSCRIPT
increasing pCO2 (Table 2; p < 0.001) as well as relationships with most of the tested parameters. In contrast, cumulative 13C-POC of settling particles varied independently of
pCO2 levels (linear regression on daily cumulative labelled material: n = 9, r = -0.53, p > 0.05).
3.4 Model results
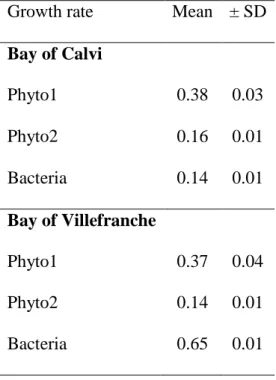
Modeling was performed on biomass and 13C labelling for both experiments. Due to the initial high 13C-DIC labelling, the label in the DIC remained relatively constant, and global biomass did not significantly change in time (variability between replicates was much higher than through time) thus the model could be adequately applied. All compartments were well fitted except for 13C-POC in BC suggesting that one phytoplankton group is missing to correctly model POC labelling. Growth rates are presented in Table 3 and were not significantly affected by elevated pCO2 levels.
M
AN
US
CR
IP
T
AC
CE
PT
ED
ACCEPTED MANUSCRIPT
4.
Discussion
The labelling studies showed a 13C incorporation into pelagic particulate organic matter and different phytoplankton groups and subsequent transfer to heterotrophic bacteria and zooplankton as well as export to sediment traps despite environmental and sampling constrains. The 13C incorporations in all compartments of the investigated plankton communities allowed for a qualitative and quantitative description of the dynamics of these communities and their potential dependence on CO2.
4.1 Environmental conditions and dynamics
The 13C transfer from dissolved inorganic carbon to phytoplankton was evident for bulk organic matter, phytoplankton groups and heterotrophic bacteria in which significant labelling was measured after 1 or 2 days. Labelling was effective despite the low to extremely low phytoplankton biomasses, obtained with PLFA biomarkers (< 0.2 µmol C L-1 in BC and < 3 µmol C L-1 in BV). This is consistent with chlorophyll a concentrations that were low at both sites (< 0.11 µg chl a L-1 in BC and < 1.3 µg chl a L-1 in BV; see Gazeau et al., sbm b, this issue). In BC, the biomass of the phytoplankton group considered as slow-growing presented higher abundances than the fast-growing group while in BV, both groups contributed equally to phytoplankton biomass. Although heterotrophic bacterial abundances as estimated based on PLFA concentrations were difficult to obtain in BV, abundances during this winter experiment were higher than in summer in BC, consistently with flow cytometry cell counts (see Figure S1; Celussi et al., in press, this issue). Modeled heterotrophic bacterial growth rates were also much higher in BV than BC. With respect to production rates, net community production based on bulk 13C incorporation (NCP-13C) was higher in winter and decreased during the time of this experiment.
The plankton community in BC was characteristic of summer communities under nutrient-limited stratified conditions with a dominance of slow-growing phytoplankton, and
M
AN
US
CR
IP
T
AC
CE
PT
ED
ACCEPTED MANUSCRIPT
based on regenerated production. This is supported by higher bacterial enzymatic activities measured in BC in summer than during the winter experiment (Celussi et al., in press, this issue). In contrast, in winter, the fast-growing phytoplankton group presented higher production rates than the slow-growing group at the start of the experiment, suggesting that the ecosystem was more at an autotrophic state. Toward the end of the experiment, the community tended to become more based on regenerated or secondary production as shown by the increase in regenerated nutrients (Louis et al., sbm, this issue) and decrease in the fast-growing phytoplankton group. During this winter experiment, theoretically conducted during the productive period in the Bay of Villefranche, nutrients were rapidly consumed during the first few days of deployment, leading to an unexpected N and P co-limitation at this period of the year and a shift from autotrophic to heterotrophic conditions. Final ∆δ-13C ratios suggested that, during the summer experiment, a large inert organic compartment was present while in BV nearly all POC was ultimately labelled. Final ∆δ-13C bacteria / ∆δ-13C phytoplankton ratios was slightly higher in BC than in BV suggesting a stronger dependency of heterotrophic bacteria on phytoplankton derived carbon in summer and a fast turnover as compared to winter conditions. To summarize, while environmental and trophic conditions observed during the experiment in BC are fully representative of stratified unproductive conditions as observed in the Mediterranean Sea in summer, in winter, a fast nutrient consumption led to heterotrophic conditions that are not representative of this productive period. As such, extrapolation of results obtained during this deployment must be done with caution.
4.2 Methodological considerations
Although PLFA are useful to understand the functioning of a community or an ecosystem, particularly when combined with stable isotope analyses (Middelburg, 2014), the low daily sampling volume (~ 4 L due to necessary sampling restrictions) under these low
M
AN
US
CR
IP
T
AC
CE
PT
ED
ACCEPTED MANUSCRIPT
nutrient concentrations and phytoplankton biomasses made the determination and quantification of PLFA rather difficult. Nevertheless, despite these methodological difficulties, 13C incorporation was successfully traced through different phytoplankton groups and heterotrophic bacteria, showing an active carbon transfer between these compartments. It must be stressed that, in order to draw a full budget of carbon transfer in these communities, 13
C labelling of dissolved organic carbon (DOC) would have provided important information in these oligotrophic areas. However, 13C-DOC in seawater remains very difficult to measure under high-labelled DIC concentrations. Furthermore, although PLFA are good taxonomic markers, most are shared by several phytoplankton groups and the PLFA composition of each species present in the studied community should be known to avoid misinterpretation (Zelles, 1999). In the Mediterranean Sea, few studies have been conducted on the attribution of PLFA to specific phytoplankton groups, therefore a conservative approach using a few broad phytoplankton groups, selected on incorporation patterns, was used to obtain group-specific information. The conversion factors, used to estimate carbon biomass from the measured PLFA concentrations, were based on data from phytoplankton strains sampled from estuaries, productive areas or nutrient-replete cultures. This has certainly introduced uncertainties in our estimates of biomass and production, but conversion factors are inevitable to quantitatively decipher carbon fluxes. Complementary laboratory studies should be performed to improve PLFA attribution to relevant phytoplankton groups of the Mediterranean Sea and to estimate proper conversion factors. Nevertheless, as identical conversion factors were used among mesocosms, this implies that they could not be responsible for the absence of CO2 effects in our studies (see thereafter).
Finally, although mesocosms are often considered the experimental ecosystem closest to the “real world” (Riebesell et al., 2013), they are not exempt of complications due to local heterogeneity of plankton populations. While in summer in BC, starting conditions were
M
AN
US
CR
IP
T
AC
CE
PT
ED
ACCEPTED MANUSCRIPT
rather homogeneous among mesocosms (see Figure 2), a large variability between rates estimated in the three control mesocosms was observed during the more productive period in winter (see Figure 6), most likely due to a stronger heterogeneity of plankton populations at that period of the year. This supports the choice of having several control treatments to characterize this natural variability. Finally, as already mentioned previously, during this experiment in winter, nutrients were rapidly consumed leading to unrepresentative conditions in mesocosms as observed to ambient conditions. It is out of the scope of this paper to discuss further these experimental uncertainties related to the use of mesocosms in dynamics and heterogeneous plankton communities.
4.3 Ocean acidification effect on carbon transfer
Net community production and phytoplankton group-specific production rates, biomasses based on PLFA as well as dependencies of consumers on resources obtained during the two experiments did not show any significant relationship with increasing pCO2 levels. This is consistent with the other measurements of community production through bottle incubations (O2 light-dark and 18O, 14C labelling; see Maugendre et al., in press, this issue). The absence of pCO2 effect on biomasses based on PLFA concentrations are also consistent with the resilience of plankton communities based on pigment and flow cytometry analyses (Gazeau et al., sbm b, this issue; Celussi et al., in press, this issue). The zooplankton isotopic signature at the end of the experiment in BC did not show a significant pCO2 effect although the highest CO2 levels tended to have lower ∆δ13C for both species collected. This tentatively suggests a reduced or delayed transfer of recently fixed carbon up the food web at the highest CO2 levels (> 1000 µatm), which is not foreseen until the end of the century. Freshly exported particulate matter was not sensitive to increased CO2 levels in BC. This is coherent with the fact that no effect was measured on community and group-specific production rates. In contrast, labelling of settling particles in the Bay of Villefranche showed
M
AN
US
CR
IP
T
AC
CE
PT
ED
ACCEPTED MANUSCRIPT
a significant decrease with increasing pCO2. Considering that none of the other considered processes was significantly affected by an increase in pCO2 and that cumulative labelling at the end of the experiment was not CO2-dependent, a clear explanation of the nature of this negative effect over the course of the experiment could not be provided and has to be taken with caution.
To date, only one mesocosm experiment, conducted in high-latitude waters, followed the same 13C enrichment protocol (De Kluijver et al., 2013). During this experiment in the Arctic (hereafter referred to as Svalbard), the effects of ocean acidification on production rates and carbon fluxes were subtle and depended on the growth phase considered (before or after nutrient addition; De Kluijver et al., 2013; Tanaka et al., 2013). During the first 12 days of the experiment (before nutrient addition), nutrient (nitrogen as nitrate and nitrite as well as phosphate) concentrations were close to or below detection limits of the conventional methods. This suggests very low levels and a dominance of slow-growing phytoplankton as during our summer experiment. Although chlorophyll a concentrations were similar between the experiments in BV and in Svalbard, POC concentrations were 2 to 3 times higher in Svalbard (~ 20-30 µmol L-1; Schulz et al., 2013) than in BV (~10 µmol L-1; Gazeau et al., sbm b, this issue). In all three experiments (BC, BV and Svalbard; Schulz et al., 2013; Gazeau et al., sbm b, this issue), phytoplankton communities were composed of small species such as haptophytes but communities differed by the presence of other small species such as cyanobacteria (mostly Synechococcus spp.) in BC and pelagophytes in BV that were absent or not reported as such in Svalbard where nano- and pico-phytoplankton were reported (Brussaard et al., 2013). In Svalbard, although NCP-13C did not change with increasing pCO2, group-specific production rates of fast-growing and slow-growing phytoplankton tended to respectively increase and decrease as pCO2 increased under nutrient-limited conditions (before nutrient addition). Therefore, despite similar chlorophyll a concentrations, the
M
AN
US
CR
IP
T
AC
CE
PT
ED
ACCEPTED MANUSCRIPT
plankton community in Svalbard was more affected by elevated pCO2 than during our experiments. It must be stressed that nutrient limitations were much stronger during our experiments, especially regarding PO43- that remained 3 to 10 lower than levels measured in Svalbard at the start of this experiment.
While it appears evident that the response of plankton communities to ocean acidification depends on environmental conditions (e.g., nutrient levels), a recent study has highlighted the preponderant role of the community structure (Eggers et al., 2014). Phytoplankton species have several carbon concentration mechanisms (CCMs) that are species-dependent (e.g. Rost et al., 2008, Reinfelder, 2011). The initial ratio of diatoms, dinoflagellates and cyanobacteria could thus be responsible for large differences in the response to ocean acidification (Eggers et al., 2014). In contrast to laboratory results (Sala et al., 2015) on plankton communities from the Northwestern Mediterranean Sea, our experiments suggest that production and biomass of natural assemblages with large proportion of haptophytes, cyanobacteria (mostly Synechococcus spp.) and other small phytoplankton species will most likely be insensitive to ocean acidification.
The fact that no effect of ocean acidification was detected, in two experiments performed at two locations and seasons in the Northwestern Mediterranean Sea, for the great majority of measured parameters and processes, is very coherent considering the strong nutrient limitations observed during these experiments. As far as mesocosms can be considered as representative of natural conditions, our findings suggest that ocean acidification would have a limited effect on plankton communities structure and carbon transfer within pelagic compartments in oligotrophic areas for pCO2 level expected by the end of the century. In addition, the different responses obtained between the two oceanic provinces that have been compared (Arctic vs. Mediterranean Sea) shows the need to consider a regional approach while studying the biological response to climate change (Häder et al.,
M
AN
US
CR
IP
T
AC
CE
PT
ED
ACCEPTED MANUSCRIPT
2014). In fact, temperature, nutrient availability, plankton community composition and other unidentified parameters are major environmental and biological aspects that control the effect of human-induced perturbations such as ocean acidification. Finally, although some methodological improvements are still necessary, especially in oligotrophic unproductive areas, the use of 13C enrichment combined with PLFA identification remains a very attractive method to estimate group-specific production rates and carbon transfer in mesocosms.
M
AN
US
CR
IP
T
AC
CE
PT
ED
ACCEPTED MANUSCRIPT
AcknowledgmentsThis work was funded by the EC FP7 project Mediterranean Sea Acidification in a changing climate (MedSeA; grant agreement 265103), the project European Free Ocean Carbon Enrichment (eFOCE; BNP-Paribas foundation), the MISTRALS-MERMEX program (Institut des Sciences de l’Univers, INSU), the Corsican local authorities and the Rhone-Mediterranean and Corsica Water Agency. It is a contribution to the Surface Ocean - Lower Atmosphere Study (SOLAS) and Integrated Marine Biogeochemistry and Ecosystem Research (IMBER) projects and the Netherlands Earth System Science Center. The STARESO marine station in Corsica is gratefully acknowledged for its assistance and boat support carried out within the framework of the STARECAPMED project funded by the Rhone-Mediterranean and Corsica Water Agency. The staff of the Observatoire Océanologique de Villefranche is gratefully acknowledged for their assistance and boat support, colleagues of the Laboratoire d'Océanographie de Villefranche for providing laboratory space. Thanks are due to A. Sallon for organizing the experiments and logistics, F. Louis and J.-M. Grisoni for organizing the construction and deployment of the mesocosms as well as J.-M. Grisoni, A. Sallon, G. Obolensky, S. Alliouane, B. Hesse, D. Luquet, D. Robin, P. Mahacek and E. Cox for assistance with diving operations. Many thanks to M. Houtekamer, P. van Breugel and P. van Rijswijk for their advices and help in the laboratory for 13C and PLFA analyses and Thierry Blasco for 13C-POC analyses in Villefranche. L. Maugendre has been supported by a grant from the French Ministry of Higher Education and Research.
M
AN
US
CR
IP
T
AC
CE
PT
ED
ACCEPTED MANUSCRIPT
ReferencesAdolf, J.E., Place, A.R., Stoecker, D.K., Harding, L.W., 2007. Modulation of polyunsaturated fatty acids in mixotrophic Karlodinium veneficum (Dinophyceae) and its prey, Storeatula major (Cryptophyceae) 1. J. Phycol. 43, 1259–1270.
Balzano, S., Pancost, R.D., Lloyd, J.R., Statham, P.J., 2011. Changes in fatty acid composition in degrading algal aggregates. Mar. Chem. 124, 2–13.
Boschker, H.T.S., Middelburg, J.J., 2002. Stable isotopes and biomarkers in microbial ecology. FEMS Microbiol. Ecol. 40, 85–95.
Brinis, A., Méjanelle, L., Momzikoff, A., Gondry, G., Fillaux, J., Point, V., Saliot, A., 2004. Phospholipid ester-linked fatty acids composition of size-fractionated particles at the top ocean surface. Org. Geochem. 35, 1275–1287.
Brussaard, C.P.D., Noordeloos, A.A.M., Witte, H., Collenteur, M.C.J., Schulz, K.G., Ludwig, A., Riebesell, U., 2013. Arctic microbial community dynamics influenced by elevated CO2 levels. Biogeosciences 10, 719–731.
Celussi M., Malfatti F., Franzo A., Gazeau F., Giannakourou A., Pitta P., Tsiola A., Del Negro P., in press. Ocean acidification effect on prokaryotic metabolism tested in two diverse trophic regimes in the Mediterranean Sea. Estuar. Coast. Shelf Sci. this issue. Czerny, J., Schulz, K.G., Ludwig, A., Riebesell, U., 2013. A simple method for air/sea gas
exchange measurement in mesocosms and its application in carbon budgeting. Biogeosciences 10, 1379-1390.
D’Ortenzio, F., D’Alcalà, M.R., 2009. On the trophic regimes of the Mediterranean Sea: a satellite analysis. Biogeosciences 6, 1–10.
Dalsgaard, J., John, M.S., Kattner, G., Muller-Navarra, D., Hagen, W., 2003. Fatty acid trophic markers in the pelagic marine environment. Adv. Mar. Biol. 46, 225–340.
M
AN
US
CR
IP
T
AC
CE
PT
ED
ACCEPTED MANUSCRIPT
De Kluijver, A., Soetaert, K., Czerny, J., Schulz, K.G., Boxhammer, T., Riebesell, U., Middelburg, J.J., 2013. A 13C labelling study on carbon fluxes in Arctic plankton communities under elevated CO2 levels. Biogeosciences 10, 1425–1440.
De Kluijver, A., Soetaert, K., Schulz, K.G., Riebesell, U., Bellerby, R.G.J., Middelburg, J.J., 2010. Phytoplankton-bacteria coupling under elevated CO2 levels: a stable isotope labelling study. Biogeosciences 7, 3783–3797.
Dijkman, N., Boschker, H.T.S., Middelburg, J.J., Kromkamp, J.C., 2009. Group-specific primary production based on stable-isotope labeling of phospholipid-derived fatty acids. Limnol. Oceanogr. Methods 7.
Dijkman, N., Kromkamp, J.C., 2006. Phospholipid-derived fatty acids as chemotaxonomic markers for phytoplankton: application for inferring phytoplankton composition. Mar. Ecol. Prog. Ser. 324, 113–125.
Eggers, S.L., Lewandowska, A.M., Barcelos, E.R.J., Blanco-Ameijeiras, S., Gallo, F., Matthiessen, B., 2014. Community composition has greater impact on the functioning of marine phytoplankton communities than ocean acidification. Glob. Chang. Biol. 20, 713–723.
Engel, A., Delille, B., Jacquet, S., Riebesell, U., Rochelle-Newall, E., Terbrüggen, A., Zondervan, I., 2004. Transparent exopolymer particles and dissolved organic carbon production by Emiliania huxleyi exposed to different CO2 concentrations: a mesocosm experiment. Aquat. Microb. Ecol. 34, 93–104.
Gazeau, F., Sallon, A., Lejeune, P., Gobert, S., Maugendre, L., Louis, J., Alliouane, S., Taillandier, V., Louis, F., Obolensky, G., Grisoni, J.M., Delissant, W., Guieu, C., submitted a. First mesocosm experiments to study the impacts of ocean acidification on the plankton communities in the NW Mediterranean Sea (MedSeA project). Estuar. Coast. Shelf Sci. this issue.
M
AN
US
CR
IP
T
AC
CE
PT
ED
ACCEPTED MANUSCRIPT
Gazeau, F., Sallon, A., Pitta, P., Pedrotti, M.L., Marro, S., Guieu, C., submitted b. Effect of ocean acidification on the plankton community diversity in the NW oligotrophic Mediterranean Sea: results from two mesocosm studies. Estuar. Coast. Shelf Sci., this issue.
Geri, P., El Yacoubi, S., Goyet, C., 2014. Forecast of sea surface acidification in the Northwestern Mediterranean Sea. J. Comput. Environ. Sci. 2014, 1–7.
Grossart, H.-P., Allgaier, M., Passow, U., Riebesell, U., 2006. Testing the effect of CO2 concentration on the dynamics of marine heterotrophic bacterioplankton. Limnol. Oceanogr. 51, 1–11.
Häder, D.P., Helbling, W., Villafane, V., 2014. Productivity of aquatic primary producers under global climate change. Photochem. Photobiol. Sci. 13(10), 1370-92
Hamilton, S.K., Tank, J.L., Raikow, D.F., Siler, E.R., Dorn, N.J., Leonardos, N.E., 2004. The role of instream vs allochthonous N in stream food webs: modeling the results of an isotope addition experiment. J. North Am. Benthol. Soc. 23, 429–448.
Kaneda, T., 1991. Iso-and anteiso-fatty acids in bacteria: biosynthesis, function, and taxonomic significance. Microbiol. Rev. 55, 288–302.
Klaas, C., Archer, D.E., 2002. Association of sinking organic matter with various types of mineral ballast in the deep sea: Implications for the rain ratio. Global Biogeochem. Cycles 16, 14–63.
Le Quéré, C., Peters, G.P., Andres, R.J., Andrew, R.M., Boden, T., Ciais, P., Friedlingstein, P., Houghton, R. a., Marland, G., Moriarty, R., Sitch, S., Tans, P., Arneth, a., Arvanitis, a., Bakker, D.C.E., Bopp, L., Canadell, J.G., Chini, L.P., Doney, S.C., Harper, a., Harris, I., House, J.I., Jain, a. K., Jones, S.D., Kato, E., Keeling, R.F., Klein Goldewijk, K., Körtzinger, a., Koven, C., Lefèvre, N., Omar, a., Ono, T., Park, G.-H., Pfeil, B., Poulter, B., Raupach, M.R., Regnier, P., Rödenbeck, C., Saito, S., Schwinger, J., Segschneider,