HAL Id: hal-01598578
https://hal.archives-ouvertes.fr/hal-01598578
Submitted on 26 Mar 2019
HAL is a multi-disciplinary open access
archive for the deposit and dissemination of
sci-entific research documents, whether they are
pub-lished or not. The documents may come from
L’archive ouverte pluridisciplinaire HAL, est
destinée au dépôt et à la diffusion de documents
scientifiques de niveau recherche, publiés ou non,
émanant des établissements d’enseignement et de
Validation of Optimal 2D Sparse Arrays in Focused
Mode: Phantom Experiments
Emmanuel Roux, Emilia Badescu, Lorena Petrusca, Francois Varray,
Alessandro Ramalli, Christian Cachard, Marc C. Robini, Hervé Liebgott,
Piero Tortoli
To cite this version:
Emmanuel Roux, Emilia Badescu, Lorena Petrusca, Francois Varray, Alessandro Ramalli, et al..
Validation of Optimal 2D Sparse Arrays in Focused Mode: Phantom Experiments. 2017 IEEE
Inter-national Ultrasonic Symposium (IUS), Sep 2017, Washington, United States. �hal-01598578�
Validation of optimal 2D sparse arrays
in focused mode: phantom experiments
Emmanuel Roux
1, Emilia Badescu
2, Lorena Petrusca
2, François Varray
2, Alessandro Ramalli
1, Christian Cachard
2,
Marc Robini
2, Hervé Liebgott
2, Piero Tortoli
11Department of Information Engineering, University of Florence, Firenze, Italy
2Univ Lyon, INSA-Lyon, Université Claude Bernard Lyon 1, UJM-Saint Etienne, CNRS, Inserm, CREATIS UMR 5220, U1206
F-69621, Lyon, France,
Abstract— There is an increasing interest for sparse 2D arrays as an alternative to full gridded arrays used in commercial systems. This work presents an effective and straightforward solution to perform 3D ultrasound imaging by driving a reduced number of elements of a commercial 2D array. The selection of 128, 192 or 256 elements out of a 32x32 array was based on simulated annealing to produce radiated beam patterns with optimal tradeoff in terms of main lobe width (resolution) and side lobe level (contrast) over a (± 32°) volume. The aim of the present work is to experimentally validate these optimal configurations by performing 3D focused imaging on a phantom. The performance metrics included the lateral resolution and the contrast to noise ratio (CNR), measured on the images obtained by scanning a grayscale phantom. The results show that the optimized 256 elements array performs, as expected, the best among all the compared sparse arrays, presents the same resolution performance as the full array and a -6 dB loss of CNR while using 25% of the active elements.
Keywords—3D ultrasound; 2D sparse arrays; focused mode; experimental validation; wideband optimization; multi-depths;
I. INTRODUCTION
In parallel with the increasing interest for 3D ultrasound imaging, several strategies to design and drive 2D arrays have been investigated. The ideal case is a full 2D array where each individual element is continuously driven by the scanner. However, this solution requires as many channels as the number of elements (i.e. 1024 for a 32x32 array) which for now is only achieved using heavy hardware available in few research centers (the parallelized Aixplorer systems at the Langevin Institute in Paris [1], the SARUS scanner at the Technical University of Denmark in Lyngby [2], the parallelized Verasonics systems at the University of Lyon[3].
On the other hand, very promising techniques allow addressing a large amount of active elements with a reduced number of channels: micro-beamforming [4]–[10], row-column addressing [11]–[14] or channel multiplexing [15]. However, even if they allow reducing the cable size, the acquisition sequence flexibility is reduced because of the pre-allocated delays associated to the sub-arrays in the micro-beamforming strategy and also because the elements are not continuously connected to the scanner when using row-column addressing or multiplexing. By contrast, sparse arrays can be defined to have a number of active elements equal to
the available number of channels which allows a continuous one-element-to-one-channel connectivity and reduces the system cost, power consumption and the overall computation load. Then, given the desired final number of active elements, 2D sparse arrays can be optimized to obtain the best tradeoff on the radiated beam pattern in terms of main lobe width and lateral lobe level.
To design the optimal array, we recently integrated [16] wideband acoustic simulations into a stochastic 2D sparse array optimization framework based on simulated annealing [17]. This optimization tool was applied to the practical case of finding the best combination of 128, 192 or 256 active elements (opti128, opti192 and opti256) out of a 32x32 fully populated array (ref1024) so that 3D ultrasound imaging could be performed by a scanner with a typical number of channels [18]. The aim of the present work is to experimentally validate these optimal configurations by using 4 synchronized Verasonics Vantage 256 systems to perform 3D focused imaging on a grayscale phantom.
The paper is organized as follows: section II presents the experimental setup used to validate the optimal 2D sparse arrays; section III shows the results of the comparison between the optimized sparse arrays and two reference arrays; section IV introduces some elements for discussions.
II. METHODS
A. Experiment setup and workflow
1) Weighting maps on the 1024 element to implement the compared arrays
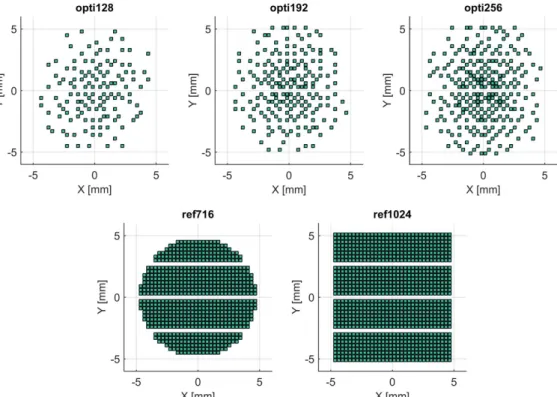
The used 32x32 element probe is a 3 MHz array (72% bandwidth) having a square footprint with sides of about 10 mm. The element size is 249 μm and the pitch is 300 μm in both the x- and y-directions. Each of the 1024 elements was physically connected to the same single channel both in transmission and reception (one-element-to-one-channel design). A weighting map for the 1024 elements was associated to each considered array configuration: active elements were weighted with “one” whereas deactivated elements in the tested array were weighted with “zero”. No other kind of apodization was used except this binary weighting map, to reproduce the five array layouts displayed in Fig. 1.
Fig. 1. Illustation of the compared layouts: the three optimized arrays opti128, opti192, opti256 (top), and the two reference arrays ref716 and ref1024 (bottom).
The two references are the full 32x32 array (ref1024) and the circular dense array (ref716), corresponding to ref1024 without the corner elements. The optimal arrays of 128, 192 and 256 elements (opti128, opti192 and opti256) correspond to the optimal configurations found in [18] after 1,280,000 trials.
2) Acquisition sequence and reconstruction
Once the activation map was defined, the same imaging sequence was performed for all the acquisitions. The four Verasonics Vantage 256 systems working at 12 MHz sampling frequency were synchronized to suitably drive the 1024 elements of the array in focused mode. The maximum depth of interest was 120 mm and the PRF was set at 900 Hz with a resulting volume rate of 1 Hz. A summary of the common parameters that were used for the acquisitions are listed in Table I. In reception, each Verasonics scanner recorded the radiofrequency (RF) signals from the active elements to which it was connected to, and this was repeated for each scan line. After the acquisition, the entire volume dataset was concatenated by grouping the four partial data located on each scanner. A dataset for an entire volume was made of 2048 16-bit samples for each RF line, to be multiplied by 899 scan lines. Thus, in the case of ref1024, the dataset size is 3.8 GB, while in opti256 it is directly divided by four. The volume reconstruction was performed (in 22 sec for opti256, 2.7 GHz CPU) applying the delay-and-sum algorithm to the RF data set.
B. Phantom and evaluation criteria
The comparison criteria were the contrast to noise ratio (CNR) and the lateral resolution, measured on the XZ slice images obtained by scanning the Gammex (Sono410 SCG) and the CIRS (054GS) phantoms respectively. The resolution was computed through the full width at half maximum (FWHM) for
the three wires located at depths 20, 40 and 60 mm. The average values obtained for each array are reported in Table II. The CNR was computed according to:
CNR = 20 log | |
( )/
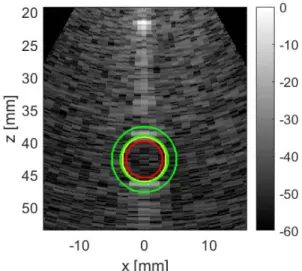
(1) where / and / correspond to the respective mean and standard deviation of the B-mode image module inside/outside the cyst: the inside region was delimited by a circle of radius 2.9 mm; the outside region was a ring area with inner and outer radii of 3.6 mm and 5.1 mm respectively as displayed on Fig. 2. The sector images were interpolated on 2000 (depth) × 700 (lateral direction) pixels and displayed with a 60 dB dynamic range before performing the evaluation.
III. RESULTS
A. Contrast evaluation (CNR)
For qualitative evaluation, the XZ and YZ 3D images slices of the contrast phantom are displayed on Fig. 3 (A) for opti256 and ref1024. Qualitatively, even if opti256 is using only 25% of the elements, it yields a very good contrast, as the image of the ref1024 array is very similar. The quantitative results are reported on the first row of Table II: the best results for the contrast are given by the ref1024 array with a CNR of 9.1 dB. The CNR of opti256 is 6 dB lower than ref1024 but it is 6.2 dB higher than the opti128 array. Surprisingly the opti192 array shows a CNR which is 0.3 dB higher than opti256. The ref716 is very competitive with the ref1024 array as it presents a CNR 0.2 dB below ref1024 while demonstrating the same resolution performance.
B. Resolution evaluation (FWHM)
For a qualitative evaluation, the XZ and YZ 3D images slices of the resolution phantom are displayed on Fig. 3 (B) for opti256 and ref1024. Contrary to the qualitative evaluation of the contrast performance, the opti256 yields a coarser resolution imaging capability compared to ref1024 as the small wire grape located on the top-right of the image (x = 10
mm, z = -30 mm) is not clearly visible with opti256. However, the quantitative results reported on the second row of Table II shows that the resolution result (1.9 mm in average on the three centered scatterers) is the same for opti256, ref716 and ref1024. The opti128 and opti192 arrays show resolutions that are respectively +0.5 mm and +1.3 mm coarser than with opti256.
Fig. 3 Phantom 3D image slices for contrast (two left hand columns designated by letter A) and resolution (two right hand colomns designated by letter B) evaluation comparison between the optimal sparse array (opti256, top line) and the reference array (ref1024, bottom line). The dynamic range is 60 dB. XZ and YZ refer to the central image planes in the azimuth and elevation direction respectively.
Fig. 2 Region of interest used to compute the CNR on the Gammex (Sono410 SCG) phantom: the inside region (red) of the cyst was delimited by a circle of radius 2.9 mm. The outside region (green) of the cyst was delimited by an inner circle of radius 3.6 mm and an outer circle of radius 5.1 mm.
TABLE I:Common parameters
Acquisition parameters
Sampling frequency 12 MHz
Sound speed 1540 m/s
Excitation signal 3-cycle sine @3MHz without temporal weighting Focal distance 25 mm on z-axis
Transducer parameters Central frequency 3 MHz Aperture size 10 mm (~20 ) Bandwidth (-6dB) 72 % Element size (squares) 249 μm Pitch 300 μm
Elements apodization 1 (activated) or 0 (deactivated)
Imaging parameters
Number of scan lines azimuthal × elevation: 31 × 29
Sector scan range ±30 ° in both elevetion and azimuthal directions Grayscale phantoms Gammex (Sono410 SCG), CIRS (054GS)
TABLE IIContrast-to-noise ratio (CNR) and full width at half maximum (FWHM) at - 6 dB (averaged over three scatterers located at depths 20, 40, 60 mm) evaluated on the XZ slices of the acquired volumes.
opti128 opti192 opti256 ref716 ref1024 CNR (dB) -4.1 2.4 2.1 8.9 9.1
FWHM (mm) 2.4 3.2 1.9 1.9 1.9
IV. DISCUSSION AND CONCLUSION
This work experimentally shows that good quality 3D ultrasound imaging can be performed by a scanner with 256 channels without additional integrated circuits or multiplexing. Moreover the optimal 2D arrays configurations obtained by our stochastic 2D sparse array optimization framework based on simulated annealing [18] demonstrates convincing tradeoffs between resolution and contrast. In particular, the opti256 performs the best among all the compared sparse arrays because it presents the same resolution performance as the ref1024 and an acceptable loss of CNR. The ref716 array is very competitive with only 70% of the active elements of ref1024 showing the effectiveness of corner elements deactivation.
As a final comment, the opti128, opti192, opti256 arrays acquisitions could be reproduced using a single 256-channel system by routing (with an adapter or hardware connections) the pin map of the full 32x32 array to directly address the active elements.
ACKNOWLEDGMENT
The authors would like to thank LabTAU for their contribution in the development of the 32x32 probe prototype compatible with a driving by 1 to 4 Verasonics Vantage256 as well as for the provision of the probe and two Vantage 256 systems. Two Verasonics systems were acquired thanks to the program FEDER Saint-Etienne and Loire General Council in the framework of the project SonoCardioProtection supervised by Pierre Croisille. This work was performed within the framework of the LABEX CELYA (ANR-10-LABX-0060) and LABEX PRIMES (ANR-11-LABX-0063) of Université de Lyon, within the program "Investissements d'Avenir" (ANR-11-IDEX-0007) operated by the French National Research Agency (ANR). This project has received funding from the European Union’s Horizon 2020 research and innovation programme under the Marie Sklodowska-Curie grant agreement No 642612, VPH-CaSE (www.vph-case.eu).
REFERENCES
[1] J. Provost, C. Papadacci, C. Demene, J. L. Gennisson, M. Tanter, and M. Pernot, “3-D ultrafast doppler imaging applied to the noninvasive mapping of blood vessels in Vivo,” IEEE Trans. Ultrason.
Ferroelectr. Freq. Control, vol. 62, no. 8, pp. 1467–1472, Aug. 2015.
[2] J. A. Jensen et al., “SARUS: A synthetic aperture real-time ultrasound system,” IEEE Trans. Ultrason. Ferroelectr. Freq. Control, vol. 60, no. 9, pp. 1838–1852, Sep. 2013.
[3] L. Petrusca et al., “A new high channels density ultrasound platform for advanced 4D cardiac imaging,” in Ultrasonics Symposium (IUS),
2017 IEEE International, 2017.
[4] P. Santos, G. U. Haugen, L. Løvstakken, E. Samset, and J. D’hooge, “Diverging Wave Volumetric Imaging Using Subaperture Beamforming,” IEEE Trans. Ultrason. Ferroelectr. Freq. Control, vol. 63, no. 12, pp. 2114–2124, Dec. 2016.
[5] G. Matrone, A. S. Savoia, M. Terenzi, G. Caliano, F. Quaglia, and G. Magenes, “A volumetric CMUT-based ultrasound imaging system simulator with integrated reception and μ-beamforming electronics models,” IEEE Trans. Ultrason. Ferroelectr. Freq. Control, vol. 61, no. 5, pp. 792–804, May 2014.
[6] J. Kortbek, J. A. Jensen, and K. L. Gammelmark, “Sequential beamforming for synthetic aperture imaging,” Ultrasonics, vol. 53, no. 1, pp. 1–16, Jan. 2013.
[7] R. Fisher et al., “Reconfigurable arrays for portable ultrasound,” in
Proc. IEEE Ultrason. Symp, 2005, vol. 1, pp. 495–499.
[8] I. O. Wygant et al., “An integrated circuit with transmit beamforming flip-chip bonded to a 2-D CMUT array for 3-D ultrasound imaging,”
IEEE Trans. Ultrason. Ferroelectr. Freq. Control, vol. 56, no. 10, pp.
2145–2156, Oct. 2009.
[9] S. W. Smith, J. Pavy H. G., and O. T. von Ramm, “High-speed ultrasound volumetric imaging system. I. Transducer design and beam steering,” IEEE Trans. Ultrason. Ferroelectr. Freq. Control, vol. 38, no. 2, pp. 100–108, Mar. 1991.
[10] O. T. von Ramm, S. W. Smith, and J. Pavy H. G., “High-speed ultrasound volumetric imaging system. II. Parallel processing and image display,” IEEE Trans. Ultrason. Ferroelectr. Freq. Control, vol. 38, no. 2, pp. 109–115, Mar. 1991.
[11] H. Bouzari et al., “Curvilinear 3-D Imaging Using Row-Column-Addressed 2-D Arrays With a Diverging Lens: Feasibility Study,”
IEEE Trans. Ultrason. Ferroelectr. Freq. Control, vol. 64, no. 6, pp.
978–988, Jun. 2017.
[12] T. L. Christiansen, M. F. Rasmussen, J. P. Bagge, L. Nordahl Moesner, J. A. Jensen, and E. V. Thomsen, “3-D imaging using row-column-addressed arrays with integrated apodization - part ii: transducer fabrication and experimental results,” IEEE Trans.
Ultrason. Ferroelectr. Freq. Control, vol. 62, no. 5, pp. 959–971, May
2015.
[13] A. S. Logan, L. L. P. Wong, A. I. H. Chen, and J. T. W. Yeow, “A 32 x 32 element row-column addressed capacitive micromachined ultrasonic transducer,” IEEE Trans. Ultrason. Ferroelectr. Freq.
Control, vol. 58, no. 6, pp. 1266–1271, Jun. 2011.
[14] A. Savoia et al., “P2B-4 Crisscross 2D cMUT Array: Beamforming Strategy and Synthetic 3D Imaging Results,” in 2007 IEEE
Ultrasonics Symposium Proceedings, 2007, pp. 1514–1517.
[15] B. Savord and R. Solomon, “Fully sampled matrix transducer for real time 3D ultrasonic imaging,” in 2003 IEEE Symposium on
Ultrasonics, 2003, vol. 1, p. 945–953 Vol.1.
[16] E. Roux, A. Ramalli, P. Tortoli, C. Cachard, M. Robini, and H. Liebgott, “Speed-up of acoustic simulation techniques for 2D sparse array optimization by simulated annealing,” in Ultrasonics Symposium
(IUS), 2015 IEEE International, 2015, pp. 1–4.
[17] E. Roux, A. Ramalli, P. Tortoli, C. Cachard, M. C. Robini, and H. Liebgott, “2-D Ultrasound Sparse Arrays Multidepth Radiation Optimization Using Simulated Annealing and Spiral-Array Inspired Energy Functions,” IEEE Trans. Ultrason. Ferroelectr. Freq. Control, vol. 63, no. 12, pp. 2138–2149, Dec. 2016.
[18] E. Roux, A. Ramalli, H. Liebgott, C. Cachard, M. C. Robini, and P. Tortoli, “Wideband 2-D Array Design Optimization With Fabrication Constraints for 3-D US Imaging,” IEEE Trans. Ultrason. Ferroelectr.