OATAO is an open access repository that collects the work of Toulouse researchers and makes it freely available over the web where possible
This is an author’s version published in: http://oatao.univ-toulouse.fr/23522
To cite this version :
Mohamed, Elham Farouk and Awad, Gamal and Andriantsiferana, Caroline and Delmas, Henri Effect of Salinity and PH on the Industrial Effluent Treatment by Activated Carbon:
Modeling of the Kinetic Adsorption and Equilibrium Isotherms. (2019) Environmental
Management and Sustainable Development, 8 (1). 77-94. ISSN 2164-7682
Effect of Salinity and PH on the Industrial Effluent
Treatment by Activated Carbon: Modeling of the
Kinetic Adsorption and Equilibrium Isotherms
E. F. Mohamed
Air Pollution Department, Environmental Research Division National Research Centre, Giza, Egypt
G. Awad
Chemistry of Natural and Microbial Products Department
Pharmaceutical and Drug Industries Research Division National Research Centre Giza, Egypt
C. Andriantsiferana
Laboratory of Chemical Engineering, University of Toulouse ENSIACET, Toulouse, Cedex, France
H. Delmas
Laboratory of Chemical Engineering, University of Toulouse ENSIACET, Toulouse, Cedex, France
Received: December 23, 2018 Accepted: January 9, 2019 Published: January 24, 2019 doi:10.5296/emsd.v8i1.14258 URL: https://doi.org/10.5296/emsd.v8i1.14258
Abstract
In recent years, interest has been focused on the removal of phenols from contaminated by using a variety of purification techniques. Adsorption of bio-industrial effluent on commercial activated carbon S23 was investigated at ambient conditions. In this wok, phenol and p-hydroxyl benzoic acid (PHBA) was studied as an example of the organic compounds
present in the industrial effluent. The effect of temperature, pH, and the presence of inorganic salt NaCl on the pollutants adsorption were studied to give further comprehension of the optimal conditions of the organic compounds adsorption onto activated carbon. It was noted that the increase in temperature resulted in a decrease in phenols adsorption capacity by S23. Lower phenol adsorption was also observed at the solution pH 2 and 10, whereas, favourable adsorption was reached at neutral solution pH, and the coexisting inorganic salt NaCl exerts slightly positive effect on the adsorption process. The isotherms obtained at pH 2.2 and 3.5 (non-buffered solution) are very similar and showed a higher adsorption capacity compared with that obtained at pH 7 and 10 for PHBA which is more adsorbable than phenol. The kinetic of the adsorption processes can be better represented by the pseudo-second order. The results showed also that the total organic carbon (TOC) of the industrial effluent reduced for about 20 %. Freundlich, Langmuir and Jovanovic adsorption models were used for mathematical description of adsorption equilibrium of phenols. The results showed that the experimental data fitted very well to the Freundlich and Jovanovic models.
Keywords: Phenol, PHBA, Industrial effluent, Adsorption isotherms, Activated carbon,
Temperature, pH, Inorganic Salt, Kinetic
1. Introduction
Environmental pollution is an emerging threat and great concern in today’s context pertaining to its effect on the ecosystem. Industrial effluents often contain various toxic metals, harmful dissolved gases, and several phenolic waste and inorganic compounds (Joshi and Sahu, 2014). The major sources of phenolic waste are petroleum refineries, petrochemical, steel mills, coke oven plants, coal gas, synthetic resins, pharmaceuticals etc. (Bazrafshan et al., 2016). In general, phenolic compounds emit an unpleasant odor and flavor in concentrations as low as 5 g/l and are poisonous to aquatic life, plants and human as a product of the bio-concentration (Kamble et al., 2008; Navarro et al., 2008). Ministry of Environment and Forests (MOEF), Government of India and EPA, has set a maximum concentration level of 1.0 mg l-1 of phenol in the industrial effluents for safe discharge into surface waters, the WHO recommends the permissible phenolic concentration of 0.001 mg l−1 in potable waters (Ullhyan and Ghosh 2014). A great variety of adsorbents (natural or synthetic) have been used for the removal of organic substances from industrial air effluents and aqueous solutions. Activated carbons are considered as the most effective organics adsorbents with high surface areas (Andriantsiferana et al., 2015; Mohamed et al., 2015; Mohamed et al., 2016a, 2016b). The adsorption capacity of activated carbon for the liquid adsorption of phenolic compounds depends on the solution conditions such as temperature, pH, ionic strength; and the adsorbate concentration (Magdy et al., 2018). The goal of the present work was firstly to study the adsorption efficiency of S23 commercial activated carbon in the treatment of bio-industrial effluent, and secondly to increase our understanding of adsorption mechanism of the phenols onto activated carbon. To do this, the influence of contact time, temperature, pH, and presence of NaCl on the adsorption equilibrium of phenol and PHBA was investigated. Kinetic models were used to identify the possible mechanisms of such adsorption process. The Freundlich, Langmuir and Jovanovic models were used to analyze the adsorption
2. Experimental
2.1 Reagents
The original industrial effluent wastewater was from the station treatment of SARP INDUSTRIES (Table 1). Two phenolic compounds with different functional groups were studied. These compounds were phenol (-OH) and p-hydroxyl benzoic acid, PHBA (-COOH) (Aldrich Chemical Co. Inc., Milwaukee, WI). All other chemicals used were analytical grade reagents. Commercial activated carbons S23 are obtained from coconut shell (PICA).
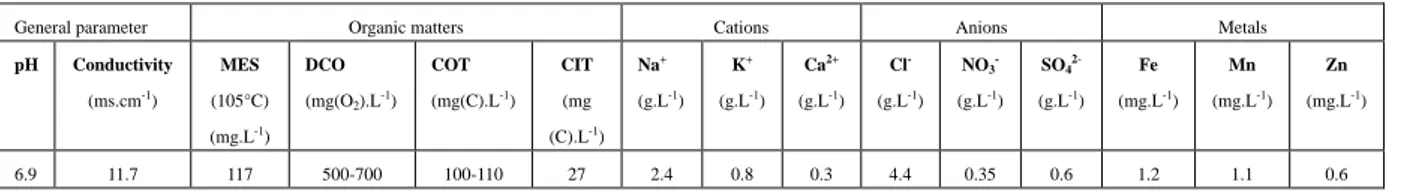
Table 1. Characterization of the studied industrial effluent
General parameter Organic matters Cations Anions Metals
pH Conductivity (ms.cm-1 ) MES (105°C) (mg.L-1 ) DCO (mg(O2).L -1 ) COT (mg(C).L-1 ) CIT (mg (C).L-1 ) Na+ (g.L-1 ) K+ (g.L-1 ) Ca2+ (g.L-1 ) Cl (g.L-1 ) NO3 -(g.L-1 ) SO4 2-(g.L-1 ) Fe (mg.L-1 ) Mn (mg.L-1 ) Zn (mg.L-1 ) 6.9 11.7 117 500-700 100-110 27 2.4 0.8 0.3 4.4 0.35 0.6 1.2 1.1 0.6
2.2 Activated Carbon Characterization
2.2.1 Surface Area and Porosity
Surface area was determined using nitrogen as the sorbate at 77K in a static volumetric apparatus (Micromeritics ASAP 2010 sorptometer). Specific total surface areas were calculated using BET equation.
2.2.2 Boehm Titration
Carbon sample (1 g) was placed in 50 ml of 0.05N of the following solutions: sodium hydroxide, sodium carbonate, sodium bicarbonate, and hydrochloric acid. The excess base or acid was titrated with HCl (0.1 N) or NaOH (0.1 N), respectively. The number of acidic sites was determined under the assumption that NaOH neutralizes carboxylic, lactonic, and phenolic groups; and Na2CO3 neutralizes carboxylic and lactonic groups; and NaHCO3 neutralizes only carboxylic groups. The number of basic sites was calculated from the amount of hydrochloric acid that reacted with the carbon.
2.2.3 pH at the Point of Zero Charge and Metal Contents
The pH at the point of zero charge (pHpzc) of sample was determined by mass titration method (Canizares et al., 2006). To determine the right concentration of carbon, a titration curve was first obtained. Different carbon concentration slurries in deionised water were prepared, then shaken for 24 h and the final pH of the slurry was measured with the pH meter. For values greater than 5% wt, the pH value obtained was constant. Therefore, for all samples, this amount of carbon was used and the resulting pH taken as the pHpzc. The values of the metals composition and the elemental analyses of commercial AC S23 samples were obtained from the industrial Supplier (PICA, Veolia group).
2.3 Total Organic Carbon
The Total Organic Carbon (TOC) is a parameter for measuring the organic matter present in wastewater. This test is performed by injecting a known quantity of sample into a high
temperature furnace in a chemically oxidizing environment. Thus the organic carbon is oxidised to carbon dioxide in the presence of a platinum catalyst. The TOC was measured by TC Multi Analyser 2100 N/C equipment from Analytic Jena with a non-diffractive IR detector. Sample acidification and aeration prior to analysis eliminate errors due to the presence of inorganic carbon.
2.4 Adsorption Experiments
2.4.1 Kinetic Study
In order to determine the time required for reaching the adsorption equilibrium, phenol and PHBA solutions were put in contact with the activated carbon S23 for different times, at a constant temperature of 25 C°. For that purpose, a number of samples were prepared by mixing 0.5 g of AC with 2.35 g l-1of a solution of phenol and others of PHBA (3.38 g l-1), shaken, filtered and then analysed by an HPLC apparatus. The amount of phenol adsorbed on the activated carbon samples at different contact times was calculated by the difference between the initial and the final phenol concentrations. The kinetic data obtained from batch studies have been analyzed by using pseudo-first-order and pseudo-second-order models. The first order equation of Lagergren is generally expressed as follows (Srihari and Das, 2008):
(1)
Where qe and q are the amounts of pollutant adsorbed (mg g
-1
) at equilibrium and at time t (min), respectively, and K1 is the rate constant of pseudo-first-order sorption (min
-1
). The integrated form of Eq. (1) becomes Eq. (2)
(2) The pseudo-second-order kinetic rate equation is expressed by Robati, 2013, as shown in Eq. (3):
(3)
Where k2 is the rate constant of pseudo-second-order sorption (g mg -1
min-1). The integrated form of Eq. (3) becomes Eq. (4)
2.4.2 Adsorption Equilibrium
Phenols solution of different initial concentrations (ranging from 188.22 to 5176.05 mg l-1) were shaken with 0.5 g of AC S23 in a 250 ml bottle using the batch bottle-point technique at a constant temperature 25 C° for three days. After equilibrium, samples were filtered, analysed and the amount of adsorbed phenol and PHBA was then deduced.
2.4.3 Modeling of the Adsorption Isotherms
Many models have been used to describe the equilibrium relationship between solute and activated carbon in both single and multi-component systems. The mono-component isotherms were evaluated according to the two parameter models (Langmuir, Freundlich and Jovanovic). The adsorption models constants, the values of which express the surface properties and affinity of the adsorbent, can be used to compare the adsorptive capacity of adsorbents for different compounds.
Langmuir equation is the most isotherm equation used for modelling of the monolayer adsorption data (Altaher et al., 2015), is given by Eq. (5).
(5)
Where qe is the amount of adsorbate taken up on adsorbent at equilibrium (mg g-1), Ce the equilibrium concentration of the adsorbate in aqueous solution (mg l-1), qmax and KL are the
Langmuir constants, representing the maximum adsorption capacity for the solid phase loading and the energy constant related to the heat of adsorption, respectively.
Freundlich model is used to describe the heterogeneous surface. It is given by Eq. (6).
(6) Where KF is the Freundlich constant for a heterogeneous adsorbent, and n is related to the magnitude of the adsorption driving force and to the adsorbent site energy distribution. The value of n indicates favourable adsorption when 1 < n < 10 (Altaher et al., 2015).
Jovanovic model is a simple isotherm model for homogeneous surfaces without lateral interactions; this model is suitable for monolayer adsorption and is given by Eq. (7) (Jaroniec 1976).
(7) Where q is the amount of adsorbate taken up on adsorbent at equilibrium (mg g-1), Ce the equilibrium concentration of the adsorbate in aqueous solution (mg l-1), qmax and Kare the constants.
2.4.4 Nonlinear Least Squares Analysis
Regression of the experimental data to the adsorption isotherm models were performed using a corrected Gauss-Newton algorithm. The procedure calculates the values of the isotherm parameters which minimize the residual sum of squares (RSS):
(8)
Where qex,i are the elements of the vector qex containing the given experimental adsorbed phase concentrations, n is data points and qt,i are the corresponding theoretical values calculated by model being studied. The selection of the most adequate model was performed using the Fisher’s test. The model selected was the one which exhibited the highest value Fcalc of Fisher parameter, Eq. (9) and having the lowest value of absolute relative errors (AARE), Eq. (10).
(9)
(10)
Where qex is the mean value of the vector qex and I is the number of adjusted parameters of the model.
2.5 Effect of Solution Condition
2.5.1 Effect of Temperature
The effect of temperature in the phenols adsorption experiments were investigated at temperature of 25 and 50 °C. It is important to study the thermodynamic parameters such as the change in the apparent enthalpy, ∆H (KJ/mol) and the Gibbs free energy, ∆G (KJ/mol) and the entropy change, ∆S (KJ/mol K), of adsorption by using the Langmuir constant KL using the following thermodynamic equations (Brucher and Bergstram 1997):
(11)
(12)
Where KL denotes the equilibrium constant, R is universal gas constant and T is the absolute
temperature in Kelvin. The standards enthalpy ∆H and entropy changes ∆S are respectively determined from the slope and intercept of the plot ln KL against 1/T.
2.5.2 Effect of Solution pH
In order to study the effect of the pH on the adsorption of phenol onto activated carbon, different initial solution pH values (2.2, 7 and 10) maintained by means of ionic buffer solutions (phosphates buffers) were used. The ionic fraction (ionsφ) can be evaluated from equation (13):
(13)
2.5.3 Addition of NaCl
The effect of salinity on the phenols removal by activated carbon S23 was studied by adding different amount of NaCl salt to the solutions.
3. Results and Discussion
3.1 Activated Carbon Characterization
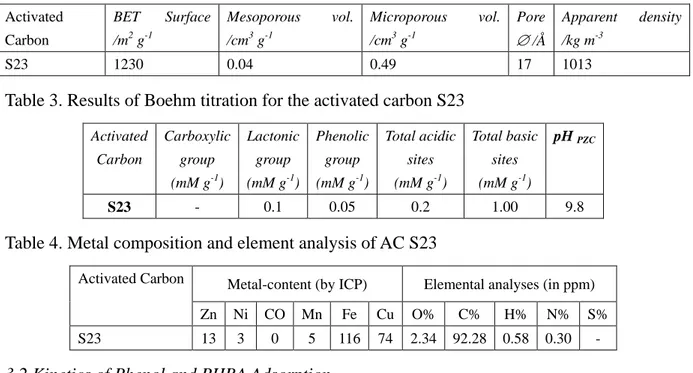
Surface area of the activated carbon was found to be 1230 m2 g-1 (Table 2). The results of Boehm titration was represented in Table 3. The surface function groups was mainly basic groups and the pH was found to be 9.8.The results of the metals content and the elemental analyses of S23 was summarised in Table 4.
Table 2. Characterization of Activated carbon S23 Activated Carbon BET Surface /m2 g-1 Mesoporous vol. /cm3 g-1 Microporous vol. /cm3 g-1 Pore /Å Apparent density /kg m-3 S23 1230 0.04 0.49 17 1013
Table 3. Results of Boehm titration for the activated carbon S23
Activated Carbon Carboxylic group (mM g-1) Lactonic group (mM g-1) Phenolic group (mM g-1) Total acidic sites (mM g-1) Total basic sites (mM g-1) pH PZC S23 - 0.1 0.05 0.2 1.00 9.8
Table 4. Metal composition and element analysis of AC S23
Activated Carbon Metal-content (by ICP) Elemental analyses (in ppm) Zn Ni CO Mn Fe Cu O% C% H% N% S% S23 13 3 0 5 116 74 2.34 92.28 0.58 0.30 -
3.2 Kinetics of Phenol and PHBA Adsorption
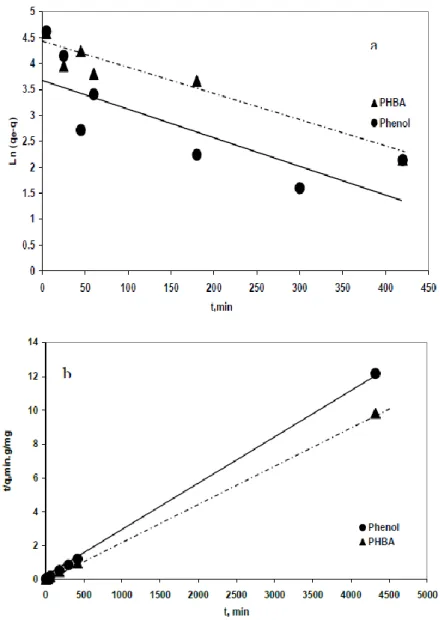
Numerous kinetic models have been proposed to elucidate the mechanism by which pollutants may be adsorbed. The mechanism of adsorption depends on the physical and/or chemical characteristics of the adsorbent as well as on the mass transport process. In order to investigate the mechanism of the phenol and PHBA adsorption, the kinetic data have been
analysed by using pseudo first-order and pseudo second –order models. In order to quantify the applicability of each model, the correlation coefficient, R2, was calculated. The plots of linearized form of the pseudo first-order and pseudo-second-order kinetic equations for phenol and PHBA are shown in Figure 1. The different parameters of both models are summarized in table 5. The results showed that, the correlation coefficient values, r2 2 were found to be higher than r1 2 for both phenol and PHBA. In the view of these results, it can be said that the pseudo-second -order kinetic model provided a good correlation for the adsorption of phenol and PHBA (r22 = 0.999) onto activated carbon S23 in contrast to the pseudo-first-order model (r12 = 0.63 for phenol and 0.92 for PHBA).
Figure 1. First order (a) and second order (b) kinetics for adsorption of phenol and PHBA onto AC S23
Table 5. Pseudo-first order and Pseudo second order kinetic parameters for the adsorption of phenol and PHBA onto activated carbon S23
Pollutant Pseudo-first order Pseudo-second order qe (mg. g-1) K1 (min-1) R12 qe (mg. g-1) K2 (min-1) R22
Phenol 1.5646e-4 0.0056 0.6381 357 0.00056 0.9999 PHBA 4.3782e-5 0.0051 0.9241 434 2.9887e-4 0.9999
3.2 Equilibrium Isotherms
3.2.1 Adsorption Isotherms of Industrial Effluent
Figure 2 shows the adsorption isotherms of organic pollutants analysed as COT from the industrial effluent onto the commercial AC S23. It can be observed that the concentration of COT was reached to nearly 20 % after the adsorption. The experimental equilibrium data fitted well to the freundlich model. Fitting parameters and regression coefficients obtained are shown in Table 6.
Figure 2. Comparison of different isotherms models for COT of the industrial effluent adsorption onto S23 at temperature 25C°: Freundlich model fitting
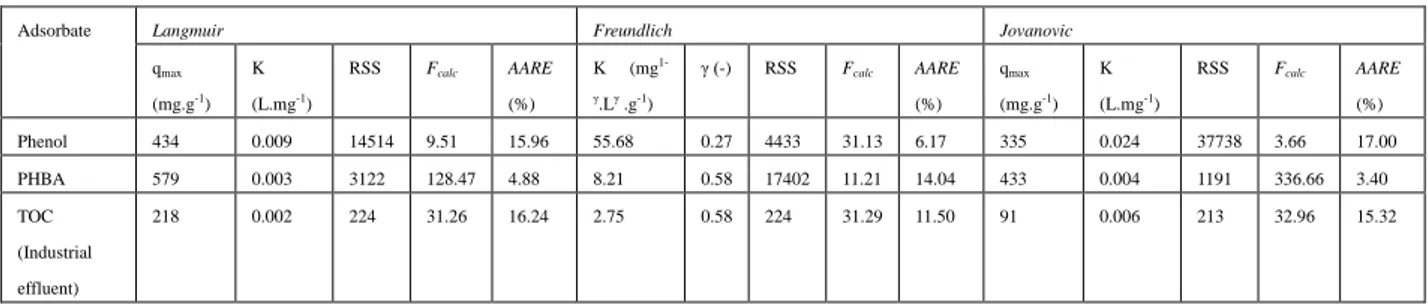
Table 6. Different parameter values of isotherm adsorption models of phenol, PHBA and TOC after the nonlinear regression analysis
Adsorbate Langmuir Freundlich Jovanovic
qmax (mg.g-1 ) K (L.mg-1 ) RSS Fcalc AARE (%) K (mg1- γ.Lγ .g-1 ) γ (-) RSS Fcalc AARE (%) qmax (mg.g-1 ) K (L.mg-1 ) RSS Fcalc AARE (%) Phenol 434 0.009 14514 9.51 15.96 55.68 0.27 4433 31.13 6.17 335 0.024 37738 3.66 17.00 PHBA 579 0.003 3122 128.47 4.88 8.21 0.58 17402 11.21 14.04 433 0.004 1191 336.66 3.40 TOC (Industrial effluent) 218 0.002 224 31.26 16.24 2.75 0.58 224 31.29 11.50 91 0.006 213 32.96 15.32
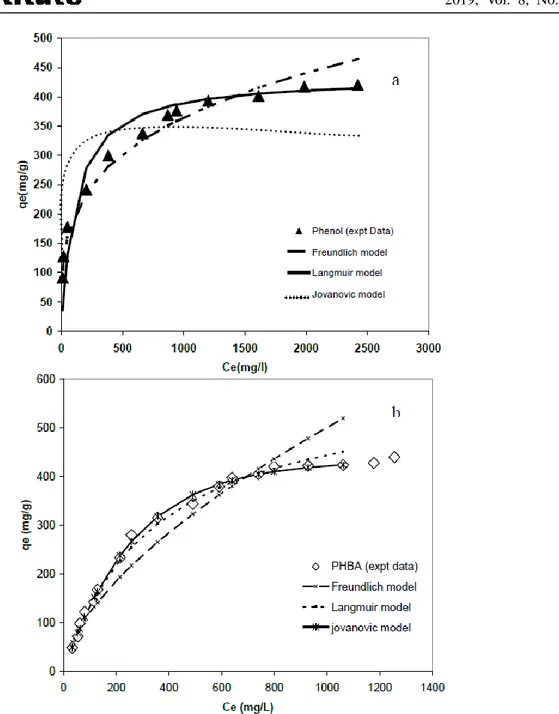
3.2.2 Phenol and PHBA Adsorption Isotherms
Figure 3 shows the adsorption of phenol and PHBA on the commercial AC S23. The data were analyzed using Langmuir, Javanovic and Freundlich equations. The results of the regression analysis of the different models evaluated are reported in Table 6. The selection of the most adequate model was performed using the Fisher’s test. The adsorption phenol equilibrium data fitted Freundlich equation with Fcalc and AARE values of 31 and 6, respectively. However the highest value of Fcalc (336) and the lowest value of AARE (3.5) confirm that the adsorption PHBA equilibrium data fitted Jovanovic model.
Figure 3. Comparison of different isotherm models for phenol (a) and PHBA (b) adsorptions onto AC S23
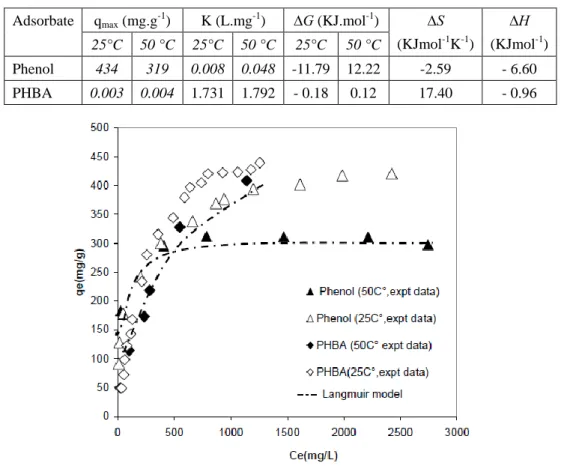
3.3 Temperature Effect
It is clear from these Figure 4 that the experimental data fitted well with Langmuir model and the equilibrium adsorption of phenol and PHBA decreases with increasing temperature as revealed by the values of qmax, for example, by increasing the temperature from 25 °C to 50
C°, the maximum adsorption capacity for phenol decreased from 434 mg g-1 to 319 mg g-1 (Table 7). It is known that AC has strongly heterogeneous surface. The heterogeneity of the AC surface stems from two sources, namely geometrical and chemical. The geometrical heterogeneity (porosity) is the result of differences in the size and shape of pores, as well as pits, vacancies and steps. Chemical heterogeneity is associated with different functional groups at a surface, and with various surface contaminants. Both the chemical and
geometrical heterogeneities contribute to the unique adsorption properties of activated carbon. The effect of carbon surface chemical composition on the adsorption of phenol decreases with rising temperature and geometrical heterogeneity determines adsorption of phenol at higher temperatures. However, at ambient temperature, the influence of surface functionalities is significant. The mechanism of phenol adsorption is also determined by the so-called ‘‘solvent effect’’. Adsorption of water by ACs together with the change in the energy of phenol–water interactions with the rise in temperature greatly changes the mechanism of phenol adsorption. (Pan et al., 2008). As shown in the table 7, the negative value of ∆G confirms the feasibility of the process and the spontaneous nature of adsorption. The negative values of ∆H were, indicating that the adsorption reaction is exothermic. This effect of temperature on the adsorption of phenol is expected for physical adsorption that is exothermic in nature in most cases (Sharma et al., 2016).
Table 7. Thermodynamic parameters for the adsorption of phenols on AC S23 Adsorbate qmax (mg.g-1) K (L.mg-1) ∆G (KJ.mol-1) ∆S
(KJmol-1K-1) ∆H (KJmol-1) 25°C 50 °C 25°C 50 °C 25°C 50 °C Phenol 434 319 0.008 0.048 -11.79 12.22 -2.59 - 6.60 PHBA 0.003 0.004 1.731 1.792 - 0.18 0.12 17.40 - 0.96
Figure 4. Adsorption isotherms of phenol and PHBA onto AC S23 at temperature 25 C°and 50 C°: Langmuir model fitting
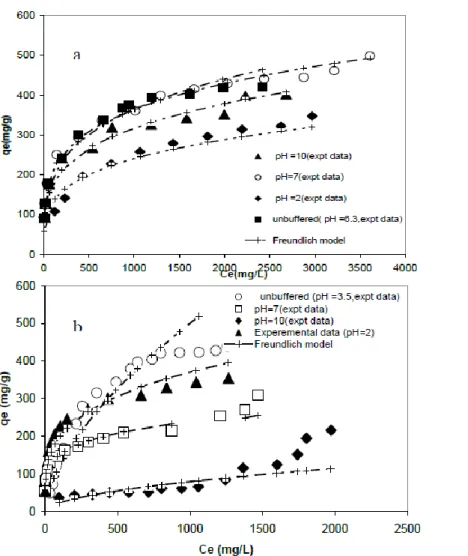
3.4 Effect of Solution pH
The pH of the solution is one of the major factors influencing the adsorption capacity of compounds that can be ionized. Acid or alkali species may change the surface chemistry of the adsorbent by reacting with surface groups. At low pH values, the surface of the activated carbon would be protonated and resulted in a stronger attraction for negatively charge
ions are negatively charged and are directly attracted to the protonated surface of activated carbon by electro-static force. Unionized phenol molecules would also be attracted, possibly, by physical force. At high pH, OH- ions would compete with the phenol molecules for sorption sites. Sorption of excess of OH– ions could convert an initial positively charged surface of activated carbon into a negatively charged surface resulting repulsion of negatively charged phenoxide ions and adsorption decreased (Machida et al., 2016). The effect of pH on the removal of the phenol and PHBA using AC S23 is presented in Figure 5. As can be seen in this figure, the adsorption amounts of phenol onto activated carbon increased at neutral solution pH 7 and nonbuffered solution, pH 5.8. At the lower pH, the functional groups on the carbon surface are in the protonated form and high electron density on the solute molecules would lead to higher adsorption. At higher pH, the phenol dissociate, forming phenolate anions, whereas surface functional groups may be either neutral or negatively charged. The electrostatic repulsion between the like charges lowers the adsorption capacities in case of the phenol. This may be due to the dependence of phenol ionization on pH of the medium. Phenols being weak acid (pKa = 9.89) will be adsorbed to a lesser extent at higher pH values due to the repulsive force prevailing at higher pH. A similar trend has been reported for the adsorption of PHBA on the activated carbons. At pH= 2.2 and 3.5, PHBA was found in the protonated form where its pH is lower than 4.8 (pka), so its higher adsorption capacity is not only due to the presence of electron attracting group –COOH but also it was adsorbed by donor- acceptor mechanism. At pH= 7, it is partially ionized, having an electron donating group O- and protons which adsorbed preferentially, so it has very weak adsorption capacity. Finally, at pH= 10, higher than pka, its adsorption capacity is lower since it is completely ionized. These results are in agreement with those reported by Gu et al., 2008 and Mohammad et al., 2016.The pKa values of phenol and PHBA at 30 °C are 9.89 and 4.8, respectively (Hameed and Rahman 2008; Li et al . 2009). When pH of solution goes beyond the pKa of phenols, phenols chiefly exist as negative phenolate ions, while they are molecules below pKa. Therefore, we consider that phenols effectively adsorbed onto adsorbent are molecules not phenolate anions. Thus, the molecular interactions including hydrogen bonding, hydrophobic interaction and Van der Waals forces are the possible factors for the adsorption of phenols. On the other hand, the higher adsorption capacity in non-buffered isotherm can be interpreted in terms of the competitive adsorption of phenol and the phosphates contained in the buffer system. According to that, when buffer solutions are used to know the pH effects, on the adsorption, the carbon adsorption capacity for the adsorbate is diminished due to the buffer solution uptake.As seen from the results that the equilibrium data for phenol and PHBA at various pH values were well represented by the Frendluich isotherm model.
Figure 5. Effect of pH on the adsorption of phenol (a) and PHBA (b) onto AC S23 at temperature 25C°: Freundlich model fitting
3.5 Effect of NaCl
Figure 6 and 7 show the adsorption behaviour of phenol and PHBA under different NaCl concentration. It is seen also that an increase in the salt concentration can increase the adsorption of phenol by activated carbon, but the increase in adsorption was less than 5% at higher phenol concentrations. The proposed mechanisms of the enhanced adsorption involve interactions between water-ion and adsorbate-ion in this system. Sodium chloride dissociates into Na+ and Cl− in aqueous solution. There is a strong electrostatic field around the anions and cations, thus, an oriented array of water molecules is formed around these ions. The existence of ions enhances the combining powers between water–water molecules and strengthens the hydrophobicity of the adsorbate in the opposite direction (Pan et al., 2008; Mohamed 2011) which is beneficial for adsorption. In addition, the water solubility of the hydrophobic compound is reduced by an increase in ionic strength. This effect is known as ‘salting-out’ (Zhang et al., 2019). The strong influence of salts on the structure of water and water solubility of the adsorbate enhances phenol adsorption onto the surface of adsorbent. It
and PHBA, the data fitted well by the Frendluich isotherm model, instead of at high NaCl concentration in the case of PHBA, the experimental data was represented well by Langmuir model.
Figure 6. Effect of NaCl concentration on the adsorption of phenol onto AC S23 at temperature 25 C° and intial pH 6.3: Freundlich model fitting
Figure 7. Effect of NaCl concentration on the adsorption of PHBA onto S23 at temperature 25C° and intial pH 3.5: Freundlich model fitting for NaCl 5 g/l and 15g/L;
Langmuir model fitting for NaCl concentration 30 g/l and 40 g/l
4. Conclusion
compounds from industrial effluents and different aqueous solutions. The pseudo- first- order and pseudo- second- order kinetic models were used to analyse the data obtained for phenol and PHBA adsorption onto activated carbon S23. The results indicated that the pseudo- second- order equation provided the better correlation for the adsorption data. The solution pH played a significant effect in the organic compounds adsorption. Activated carbon adsorption capacity increased with the decreasing in the solution pH. The adsorption is exothermic process decreased by increasing the temperature. The adsorption capacity of AC was slightly enhanced by an increase of salinity. This study is particularly important for the application of the adsorption process to saline industry wastewater treatment systems.
References
Al-Asheh, S., Banat, F., & Masad, A. (2004). Kinetics and equilibrium sorption studies of 4nitrophenol on pyrolyzed and activated oil shale residue. Environmental Geology, 45, 1109-1117. https://doi.org/10.1007/s00254-004-0969-4
Altaher, H., Al-Ouf, F., Magdy, H., & Hassan, M. (2015). Microwave against thermal treatment for manufacturing of activated carbon from agricultural wastes and its use to adsorb methylene blue- equilibrium and kinetic studies. Yanbu J Eng Sci., 11, 29-42.
Andriantsiferana, C., Mohamed, E., & Delmas, H. (2015). Sequential adsorption photocatalytic oxidation process for wastewater treatment using a composite material TiO2/activated carbon. Environ Eng Res., 20, 181-189. https://doi.org/10.4491/eer.2014.070 Banat, F., Al-sheh, S., & Al-Makhadmeh, L. (2004). Utilization of raw and activated date pits for removal of phenol from aqueous solutions. Chem Eng Technol., 27, 80-86.
https://doi.org/10.1002/ceat.200401868
Bazrafshan, E., Amirian, P., Mahvi, H., & Ansari-Moghaddam, A. (2016). Application of adsorption process for phenolic compounds removal from aqueous environments: a systematic review. Global NEST Journal, 18, 146-163. https://doi.org/10.30955/gnj.001709 Brucher, J., & Bergstrom, L. (1997). Temperature dependence of linuron sorption to three different agricultural soils. J Environ Qual., 26, 1327-1335.
https://doi.org/10.2134/jeq1997.00472425002600050019x
Gu, H., Zhou, T., Zhang, L., & Liu, F. (2008). Treatment of hyper-saline wastewater loaded with phenol by the combination of adsorption and an offline bio-regeneration system. Journal
of Chemical Technology and Biotechnology, 83, 1034-1040. https://doi.org/10.1002/jctb.1910
Hameed, H., & Rahman, A. (2008). Removal of phenol from aqueous solutions by adsorption onto activated carbon prepared from biomass material. Journal of Hazardous Materials, 160, 576-581. https://doi.org/10.1016/j.jhazmat.2008.03.028
Jaroniec, M. (1976). Statistical interpretation of the Jovanović adsorption isotherms.
Colloid and Polymer Science, 254, 601-605. https://doi.org/10.1007/BF01382578
Li, J. M., Meng, X. G., Hu, C. W., & Du, J. (2009). Adsorption of phenol, p-chlorophenol and p-nitrophenol onto functional chitosan. Bioresource Technology, 100(3), 1168-1173. https://doi.org/10.1016/j.biortech.2008.09.015
Machida, M., Goto, T., Amano, Y., & Iida, T. (2016). Adsorptive Removal of Nitrate from Aqueous Solution Using Nitrogen Doped Activated Carbon. Chemical & Pharmaceutical
Bulletin, 64(11), 1555-1559. https://doi.org/10.1248/cpb.c16-00368
Magdy, M., Altaher, H., & El Qada, E. (2018).Removal of three nitrophenols from aqueous solutions by adsorption onto char ash: equilibrium and kinetic modeling. Applied Water
Science, 26, 2-15. https://doi.org/10.1007/s13201-018-0666-1
Mohamed, E. (2011). Removal of organic compounds from water by adsorption and
photocatalytic oxidation. Thesis, University of Toulouse
Mohamed, E. F., El-Hashemy, M. A., Abdel-Latif, N. M., & Shetaya, W. H. (2015). Production of sugarcane bagasse-based activated carbon for formaldehyde gas removal from potted plants exposure chamber. J Air Waste Manag Assoc., 65, 1413-1420.
https://doi.org/10.1080/10962247.2015.1100141
Mohamed, E. F., Awad, G., Andriantsiferana, C., & El-Diwany, A. (2016a). Biofiltration technology for the removal of toluene from polluted air using Streptomyces griseus. Environ
Technol., 37(10), 1197-1207. https://doi.org/10.1080/09593330.2015.1107623
Mohamed, E. F., Sayed. A. S. A., Abdel-Latif, N. M., & Mekawy, A. (2016b). Air purifier devices based on adsorbents produced from valorization of different environmental hazardous materials for ammonia gas control. RSC Adv., 6, 57284-57292.
https://doi.org/10.1039/C6RA06630E
Mohammad, M. R., Afaj, A. H., & Mahmoud, N. M. (2016). Study of some Effecting Factors on the Removal of Phenol from Aqueous Solutions by Adsorption onto Activated Carbon. J.
Int. Environmental Application & Science, 11(2), 148-153
Navarro, A. E., Portales, R. F., Sun-Kou, M. R., & Llanos, B. P. (2008). Effect of pH on phenol biosorption by marine seaweeds. Journal of Hazardous Materials, 156, 405-411. https://doi.org/10.1016/j.jhazmat.2007.12.039
Pan, B., Pan, Bi, Zhang, W., Zhang, Q., Zhang, Q., & Zheng, S. (2008). Adsorptive removal of phenol from aqueous phase by using a porous acrylic ester polymer. Journal of Hazardous
Materials, 157(2-3), 293-299. https://doi.org/10.1016/j.jhazmat.2007.12.102
Sharma, P., Sohail, A. S., & Tripathi, N. (2016) Isotherms describing physical adsorption of Cr(VI) from aqueous solution using various agricultural wastes as adsorbents. Cogent
Engineering 3, 1186857, 1-20. https://doi.org/10.1080/23311916.2016.1186857
Srihari, V., & Das, A. (2008). The kinetic and thermodynamic studies of phenol15 sorption onto three agro-based carbons. Desalination, 225(1-3), 220-234.
Robati, D. (2013). Pseudo-second-order kinetic equations for modeling adsorption systems for removal of lead ions using multi-walled carbon nanotube. Journal of Nanostructure in
Chemistry, 3(55), 2-6. https://doi.org/10.1186/2193-8865-3-55
Ullhyan, A., & Ghosh, U. K. (2014). Removal of 2,4-dichlorophenol by simultaneous adsorption and biodegradation (SAB) using low cost adsorbent, Global NEST Journal, 16(4), 616-627. https://doi.org/10.30955/gnj.001260
Yang, W. B., Li, A. M., Zhang, Q. X., & Fei, Z. H. (2005). Adsorption of 5-sodiosulfoisophthalic acids from aqueous solutions onto acrylic ester polymer YWB-7 resin.
Sep. Purif. Technol., 46, 161-167. https://doi.org/10.1016/j.seppur.2005.05.005
Zhang, Y., Zhu, C., Liu, F., Yuan, Y., Wu, H., & Li, A. (2019). Effects of ionic strength on removal of toxic pollutants from aqueous media with multifarious adsorbents: A review.
Science of the Total Environment, 646, 265-279.
https://doi.org/10.1016/j.scitotenv.2018.07.279
Copyright Disclaimer
Copyright for this article is retained by the author(s), with first publication rights granted to the journal.
This is an open-access article distributed under the terms and conditions of the Creative Commons Attribution license (http://creativecommons.org/licenses/by/3.0/).