Decarbonization of Power Systems, Multi-Stage
Decision-Making with Policy and Technology Uncertainty
by
Nestor A. Sepulveda
B.S., Naval Electrical Engineering, Naval Polytechnic Academy, Chile, 2010 S.M., Nuclear Science and Engineering, Massachusetts Institute of Technology, 2016
S.M., Technology and Policy, Massachusetts Institute of Technology, 2016 Submitted to the Department of Nuclear Science and Engineering
in partial fulfillment of the requirements for the degree of Doctor of Philosophy in Nuclear Science and Engineering
at the
MASSACHUSETTS INSTITUTE OF TECHNOLOGY May 2020
c
○ Massachusetts Institute of Technology 2020. All rights reserved.
Author . . . . Department of Nuclear Science and Engineering
May 20, 2020 Certified by . . . . Richard K. Lester Associate Provost Professor of Nuclear Science and Engineering Thesis Supervisor Certified by . . . . Christopher Knittel Professor of Applied Economics Thesis Supervisor Certified by . . . . Juan Pablo Vielma Associate Professor of Operations Research and Statistics Thesis Supervisor Accepted by . . . .
Ju Li Professor of Nuclear Science and Engineering Chair, Department Committee on Graduate Students
Decarbonization of Power Systems, Multi-Stage Decision-Making with Policy and Technology Uncertainty
by
Nestor A. Sepulveda
Submitted to the Department of Nuclear Science and Engineering on May 20, 2020, in partial fulfillment of the
requirements for the degree of
Doctor of Philosophy in Nuclear Science and Engineering
Abstract
There is widespread agreement that “deep decarbonization” of the power sector, i.e., reduc-tion of CO2 emissions to near or below zero, will be pivotal to climate change mitigation efforts. Nevertheless, given multi-decadal time horizons, planning for decarbonization must contend with uncertainty regarding technologies costs, new technologies characteristics and availability, and policies and incentives for reducing CO2 emissions in the multi-year adap-tation process. At the same time, increasing penetration of variable renewable energy, the availability of energy storage technologies and the active participation of demand in elec-tricity systems requires the appropriate consideration of temporal and spatial resolution to properly account for the cost and value of different resources at the system level.
New approaches are required to determine a technology’s value to the power systems of the 21𝑠𝑡 century. Conventional cost-based metrics (e.g., LCOE) are incapable of accounting for the indirect system costs associated with intermittent electricity generation, in addition to environmental and security constraints. Moreover, as recent research has shown, commonly used abstraction methods (sample hours, days or weeks selection methods) can provide inaccurate results by undervaluing some resources and overvaluing others. Hence, there is a need to account for greater detail at the operational level while also accounting for multi-decadal scenarios and imperfect information regarding costs, technologies and policies, all within a framework that is able to capture the value-cost trade-off dynamics of electricity resources.
This work develops a methodology to properly account for the value-cost dynamics at the system level for decarbonization of power systems. Using this methodology, it then explores two key questions for policy and decision makers. First, we study the role of firm low carbon resources for deep decarbonization of power generation. We find that availability of firm low-carbon technologies – including nuclear, natural gas with carbon capture and sequestration, and bioenergy – reduces electricity costs by 10-62% across fully decarbonized cases. Then, we study the role of long duration energy storage (LDES) technologies for deep decarbonization. We find that the total system of LDES must fall below 40 [$/kWh] for LDES technologies to reduce system cost by more than 10%, even in our best case scenario. Finally, we expand our methodology into a multi-year capacity expansion planning frame-work for power systems that is able to solve for the optimal investment strategy/pathway with respect to future policies such as CO2 limits and/or renewable energy mandates while accounting for detailed operation at an hourly resolution over a full year as well as high-level uncertainty (e.g. policy commitment, technology availability, etc). In its original form
the multi-year capacity expansion problem with hourly detail is computationally intractable using current methods and computational resources due to the increased number (millions) of variable and constraints that are involved in the problem. Our framework turns the problem into a computationally tractable one. This is accomplished by means of three de-composition methods at different levels and the integration of such methods into a single computational framework (FLIP). Stochastic Dual Dynamic Programming is used to break down the problem at the year level iteratively passing information forwards and backwards across different years; Benders Partitioning is used to separate each yearly problem into a master investment problem and an operational problem passing information upwards and downwards between the two levels; and Dantzig-Wolfe decomposition is used to separate the year-long operational problem into a simplified operational problem and many opera-tional sub-problems (e.g. weekly) passing information across problems to coordinate the year coupling constraints (e.g. CO2 policy) iteratively to find the optimal operation. This
integrated framework requires solving orders of magnitude greater numbers of problems that are orders of magnitude smaller in size and complexity (number of variables and constraints down to thousands or hundreds from millions). At the same time, the framework allows for parallelization at different levels of the problem, allowing the user to harness high perfor-mance computing resources with greater flexibility. The framework is implemented using the Julia general purpose programming language and its mathematical programming extension JuMP.
Thesis Supervisor: Richard K. Lester Title: Associate Provost
Professor of Nuclear Science and Engineering Thesis Supervisor: Christopher Knittel Title: Professor of Applied Economics Thesis Supervisor: Juan Pablo Vielma
Acknowledgments
I would like to thank my advisors Richard Lester, Christopher Knittel, and Juan Pablo Vielma for their support to get me to the point where I am writing these words. I am very grateful to Richard Lester for being a great mentor, always putting my personal develop-ment and goals first, and supporting me during important career decisions over the last many years. I am grateful to Chris Knittel for inviting me to become part of the CEEPR community which I have enjoyed very much and for being supportive of my research. I am grateful to JP Vielma for the many hours (and patience) he dedicated in his office to teach me “hardcore” OR methods and for being supportive of my ideas and research. I am thankful to Scott Kemp for chairing my defense, for motivating the research question that started this journey many years ago and for being supportive of my research goals. I am very grateful to my current and former collaborators: Jesse Jenkins, Aurora Edington, Fernando de Sisternes, Dharik Mallapragada, Aaron Schwartz; and my office mates: Lucas Rush, Robbie Stewart, and Stephen Lam (aka Steveee); this journey would have been very different without you all joining me, thanks. I would like to thank the NSE Department. Special thanks to some unknown faculty in the admissions committee in 2013 for offering me admission (still wondering how I made it) with a PhD letter when I applied for a Mas-ters, that was the beginning of a chain of events that brought me here. Also big thanks to Brandy Baker, Peter Brenton, Rob Allison, and so many others that make NSE the great home department that it is; and thanks to the faculty for being flexible letting some outliers like myself find their way. During this many years we have been very lucky to have friends to support me and my wife. I am very grateful for my classmates at NSE, we had to endure a lot together. I am also very thankful for my Chilean family at MIT their encouragement and friendship were key in getting to this point. I would like to thank the Chilean Navy for supporting me at the beginning of this journey; and my superiors for understanding me when I told them that I saw purpose in continuing it. I am very grateful to our families, we would not be here without their love and constant support. Finally, and most of all, I would like to thank my wife, Sole (or Maria as some of you might know her), who has supported me through this marathon while giving us our beloved daughter Anto (and so much more).
This doctoral thesis has been examined by a Defense Committee as follows:
Professor Richard K. Lester . . . . Thesis Supervisor Associate Provost, Professor of Nuclear Science and Engineering
Professor Christopher Knittel . . . . Thesis Supervisor Professor of Applied Economics MIT Sloan School of Management
Professor Juan Pablo Vielma . . . . Thesis Supervisor Associate Professor of Operations Research and Statistics MIT Sloan School of Management
Professor R. Scott Kemp . . . . Chairman, Defense Committee Associate Professor of Nuclear Science and Engineering
Contents
1 Introduction 33
1.1 The Role of Power Systems in Decarbonization . . . 33
1.2 Cost-Based versus Value-Cost Mental Models . . . 35
1.3 Sequential Adaptation . . . 39
1.4 Thesis Overview . . . 41
2 Technology Valuation for Decarbonization Efforts 45 2.1 Methodology to capture value-cost trade-off . . . 45
2.2 Notation . . . 48
2.2.1 Indices and Sets . . . 48
2.2.2 Decision Variables . . . 49
2.2.3 Parameters . . . 49
2.3 Problem formulation . . . 51
2.3.1 Indices and Sets . . . 51
2.3.2 Objective Function . . . 52
2.3.3 Constraints . . . 53
2.4 Problem Matrix Notation . . . 63
3 The Role of Firm Low-Carbon Electricity Resources 69 3.1 Introduction . . . 70
3.2 Experimental Setup . . . 73
3.2.1 General Description . . . 73
3.2.2 Economic and Technical Assumptions . . . 76
3.2.3 Regional Data . . . 79
3.3 Results . . . 83
3.3.1 Core Cases . . . 83
3.3.2 Sensitivity Cases . . . 87
3.4 Discussion . . . 92
4 The Role of Long-Duration Energy Storage 95 4.1 Introduction . . . 96
4.2 Long-duration Energy storage Implementation . . . 99
4.2.1 Decision Variables . . . 99
4.2.2 Parameters . . . 100
4.2.3 Objective Function . . . 100
4.2.4 Investment Related Constraints . . . 101
4.2.5 Economic Dispatch Constraints . . . 102
4.3 Experiment . . . 103
4.4 Inputs and Assumptions . . . 108
4.4.1 Economic and Operational Parameters . . . 108
4.4.2 Variable Renewable and Demand Assumptions . . . 110
4.5 Results . . . 112
4.5.1 LDES System Value . . . 114
4.5.2 LDES Effect On The Capacity Mix . . . 122
4.5.3 LDES Design Results . . . 135
4.6 Discussion . . . 146
5 Forward Looking Investment Planning (FLIP) 153 5.1 Introduction . . . 154
5.2 Linear Optimization Review . . . 155
5.2.1 Domain Representation . . . 155
5.2.2 Duality Theory . . . 156
5.2.3 Problem Structures . . . 158
5.2.4 Dynamic Programming . . . 160
5.3 Problem description and formulation . . . 163
5.3.1 Multi-year problem description . . . 163
5.4 Decomposition Methods . . . 173
5.4.1 Benders Partitioning (BP) . . . 173
5.4.2 Dantzig-Wolfe Decomposition (DW) . . . 177
5.4.3 Stochastic Dual Dynamic Programming (SDDP) . . . 182
5.5 Algorithm Development . . . 191
5.5.1 Splitting By Year . . . 192
5.5.2 One-Year Problem Split by Sub-Periods . . . 199
5.5.3 Three-Level Decomposition . . . 219
5.6 Implementation lessons . . . 224
5.6.1 Numerical issues . . . 224
5.6.2 Parallelization issues . . . 225
6 The Role of Sequential Adaptation 227 6.1 Introduction . . . 227
6.2 Experiment . . . 228
6.2.1 The Planning Horizon . . . 228
6.2.2 Capital Cost Over Time . . . 230
6.2.3 Operational Cost and Parameters . . . 232
6.2.4 System Pre-Existing Conditions . . . 234
6.2.5 Evolution of the Demand . . . 234
6.3 Results . . . 236
6.3.1 Myopic versus Foresight . . . 236
6.3.2 Policy Uncertainty . . . 240 6.4 Discussion . . . 243 7 Conclusions 245 7.1 Summary . . . 245 7.2 Contributions . . . 249 7.3 Future Work . . . 250
List of Figures
0-1 Value-Cost Methodology Overview . . . 25
0-2 Graphical Abstract The Role of Firm Low-Carbon Resources [50] . . . 26
0-3 Graphical Abstract The Role of Long Duration Energy Storage . . . 28
0-4 High-Level 3-Level Nested Decomposition . . . 29
1-1 Forecast average wholesale price during PV production as a function of in-creasing solar PV penetration[52] . . . 37
1-2 Impact of different penetrations on system value (SV) of onshore wind, CCS, and grid-level energy storage capacity. [19] . . . 38
3-1 Taxonomy of resources in a low carbon power system [50] . . . 71
3-2 Regional data (New England) used to characterize the Northern System . . . 80
3-3 Regional data (ERCOT) used to characterize the Southern System . . . 81
3-4 Average cost of electricity under different technology assumptions and CO2 emission limits for the Northern and Southern systems[50] . . . 85
3-5 Least-cost capacity mix in the Northern and Southern systems for different carbon emission limits[50] . . . 86
3-6 Energy shares of least-cost portfolio in the Northern and Southern systems by technology group under different carbon emissions limits[50] . . . 88
3-7 Average cost of electricity under different technological assumption scenarios, and CO2 emissions limits for the northern and southern systems with different DSR scenarios and the interconnected system[50] . . . 89
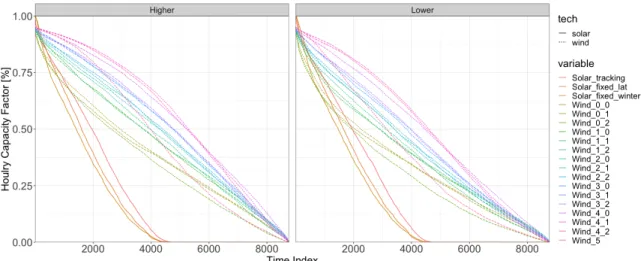
3-8 Effect on capacities and energy shares of demand side resources (DSR 5 vs DSR 1) and interconnection (20% vs 10%) as a function of emissions limit[50] 91 4-1 Duration Curves of VRE Hourly Profiles under Base Weather Conditions . . . 111
4-2 Duration Curves of VRE Hourly Profiles under Higher and Lower Weather Conditions . . . 112 4-3 Comparison of “Base” and “Electrification for Deep Decarbonization” Load
Profiles . . . 113 4-4 Intersection between LDES Technology Space and Future Projections in Table
4.3 by [15] . . . 114 4-5 Electricity Cost Reduction as Function of LDES Total System Cost . . . 115 4-6 Southern System: Percentage Cost Reduction as Function of LDES Parameter
Combination Compared to Reference Cases (Scenarios 1-3 Table 4.6) . . . 116 4-7 Northern System: Percentage Cost Reduction as Function of LDES Parameter
Combination Compared to Reference Cases (Scenarios 4-6 Table 4.6) . . . 118 4-8 Northern System with Electrified Load: Percentage Cost Reduction as
Func-tion of LDES Parameter CombinaFunc-tion Compared to Reference Cases (Scenar-ios 7-9 Table 4.6) . . . 121 4-9 Northern System: Effect on Avg. Cost of Electricity due to Changes in
Weather (VRE Availability) Conditions . . . 122 4-10 firm low-carbon capacity Reduction as Function of LDES Total System Cost . 123 4-11 Southern System: Percentage Firm Capacity Reduction as Function of LDES
Parameter Combination Compared to Reference Cases (Scenarios 1-3 Table 4.6) . . . 124 4-12 Northern System: Percentage Firm Capacity Reduction as Function of LDES
Parameter Combination Compared to Reference Cases (Scenarios 4-6 Table 4.6) . . . 125 4-13 Northern System with Electrified Load: Percentage Firm Reduction as
Func-tion of LDES Parameter CombinaFunc-tion Compared to Reference Cases (Scenar-ios 7-9 Table 4.6) . . . 127 4-14 Northern System: Effect on firm low-carbon capacity due to Changes in
Weather (VRE Availability) Conditions . . . 128 4-15 Southern System: Percentage Li-ion Power Capacity Reduction as Function
of LDES Parameter Combination Compared to Reference Cases (Scenarios 1-3 Table 4.6) . . . 129
4-16 Southern System: Percentage Li-ion Energy Capacity Reduction as Function of LDES Parameter Combination Compared to Reference Cases (Scenarios 1-3 Table 4.6) . . . 130 4-17 Northern System: Percentage Li-ion Power Capacity Reduction as Function
of LDES Parameter Combination Compared to Reference Cases (Scenarios 4-6 Table 4.6) . . . 131 4-18 Northern System: Percentage Li-ion Energy Capacity Reduction as Function
of LDES Parameter Combination Compared to Reference Cases (Scenarios 4-6 Table 4.6) . . . 132 4-19 Northern System with Electrified Load: Percentage Li-ion Power Reduction
as Function of LDES Parameter Combination Compared to Reference Cases (Scenarios 7-9 Table 4.6) . . . 133 4-20 Northern System with Electrified Load: Percentage Li-ion Energy Reduction
as Function of LDES Parameter Combination Compared to Reference Cases (Scenarios 7-9 Table 4.6) . . . 134 4-21 Electricity Cost Reduction as Function of LDES Total System Cost . . . 135 4-22 Southern System: LDES duration (Energy Capacity/Discharge Capacity) in
hours for optimal deployment of LDES . . . 137 4-23 Northern System: LDES duration (Energy Capacity/Discharge Capacity) in
hours for optimal deployment of LDES . . . 138 4-24 Northern System with Electrified Load: LDES duration (Energy
Capac-ity/Discharge Capacity) in hours for optimal deployment of LDES . . . 139 4-25 Northern System: Effect on LDES duration due to Changes in Weather (VRE
Availability) Conditions . . . 140 4-26 Northern System: Effect on LDES duration due to Changes in Weather (VRE
Availability) Conditions . . . 141 4-27 Southern System: Distribution of Discharge and Charge Power Capacities
Normalized by Peak Demand . . . 143 4-28 Northern System: Distribution of Discharge and Charge Power Capacities
Normalized by Peak Demand . . . 143 4-29 Northern System: Distribution of Discharge and Charge Power Capacities
4-30 Northern System with Electrified Load: Distribution of Discharge and Charge
Power Capacities Normalized by Peak Demand . . . 145
5-1 Large-Scale Problem Structures Matrix 𝑀 [8] . . . 159
5-2 Discretization scheme to calculate the Value Function Ψ𝑡 in Dynamic Pro-gramming . . . 162
5-3 Schematic Matrix Structure of Problem (5.11) . . . 171
5-4 Schematic Matrix Structure of Problem (5.11) . . . 172
5-5 Matrix structure in Problem (5.13) . . . 174
5-6 Matrix structure in Problem (5.19) . . . 178
5-7 Approximation scheme to calculate the Value Function Ψ𝑡 in Dual Dynamic Programming . . . 184
5-8 Matrix structure in Problem (5.33) . . . 186
5-9 High-Level 3-Level Decomposition Approach . . . 191
5-10 Matrix Structure Diagram Sub-Problem Stage ϒ𝑡 . . . 194
5-11 General Structure Yearly-Split Decomposition . . . 197
5-12 Forward Pass Structure . . . 197
5-13 Backward Pass Structure . . . 198
5-14 Matrix Structure ϒ of Static Single-Year Problem . . . 200
5-15 Matrix Structures Investment-Only and Operational-Only Problems . . . 202
5-16 Master Operational Problem Matrix Structure . . . 207
5-17 Pricing Operational Sub-Problem Matrix Structure for Sub-Period 𝑤 . . . 209
5-18 General Structure Intra-Year Decomposition . . . 215
5-19 Investment Step Structure . . . 215
5-20 Operational Step Structure . . . 216
5-21 Sub-Operational Step Structure . . . 218
5-22 Three-Level Nested Decomposition General Structure . . . 221
5-23 Three-Level Nested Decomposition Forward Pass . . . 222
5-24 Three-Level Nested Decomposition Backward Pass . . . 223
6-1 Multi-Year Decision Process and CO2 Trajectory, without Policy Uncertainty 229 6-2 Multi-Year Decision Process and CO2 Trajectory, with Policy Uncertainty . . 230
6-3 Solar PV - Utility Capex Projections Over Time from [40] for the Years 2017 to 2050 . . . 231 6-4 Demand Data from 2020 to 2050 Every 5 Years . . . 235 6-5 Myopic Investment Plan (2020-2050) and Static Final Plan (2050-S) No CCS
Available . . . 237 6-6 FLIP Investment Plan (2020-2050) and Static Final Plan (2050-S) No CCS
Available . . . 238 6-7 Myopic Investment Plan (2020-2050) and Static Final Plan (2050-S) CCS
Becomes Available in 2030 . . . 239 6-8 FLIP Investment Plan (2020-2050) and Static Final Plan (2050-S) CCS
Be-comes Available in 2030 . . . 239 6-9 FLIP Investment Plan (2020-2050) CCS Becomes Available in 2030 Without
Savage Value . . . 241 6-10 FLIP Investment Plan (2020-2050) CCS Available full Decarbonization (60%
Chance) . . . 241 6-11 FLIP Investment Plan (2020-2050) CCS Available Decarbonization Dropped
(40% Chance) . . . 242 6-12 Economic Cost of Uncertainty . . . 243
List of Tables
2.1 Model’s General Structure and Reference to Equations . . . 47
2.2 Model Indices . . . 48 2.3 Model Sets . . . 49 2.4 Model Variables . . . 49 2.5 Model Parameters . . . 49 3.1 Technological Assumptions . . . 74 3.2 Technological Scenarios . . . 75
3.3 Demand Side Resource Scenarios . . . 75
3.4 Interconnection Scenario Assumptions . . . 75
3.5 Operational Cost Assumptions . . . 77
3.6 Technical Assumptions Thermal Generator . . . 78
3.7 Technical Assumptions VRE Generation and Storage . . . 78
3.8 Technical Assumptions Thermal Generator . . . 78
4.1 New Model Variables . . . 99
4.2 New Model Parameters . . . 100
4.3 Future Costs for Long Duration Energy Storage Technologies[15] . . . 103
4.4 LDES Technology Space . . . 104
4.5 Scenario Space . . . 105
4.6 Base Cases Definitions . . . 106
4.7 Base Cases Results . . . 107
4.8 Technical Assumptions Thermal Resources . . . 108
4.9 Technical Assumptions: Non-Thermal Resources . . . 108
4.11 Fuels Assumptions . . . 110 4.12 Reduced Cost Multivariate Regression On Min-Max Normalized Descriptors . 119 5.1 Relation between primal and dual variables and constraints . . . 157 6.1 Economic Parameters Planning Horizon . . . 229 6.2 Technologies Cost Parameters for Cost Trajectories Capex𝑡 = Capex0 + 𝛽 · 𝑡 231
6.3 Operational Cost Assumptions . . . 232 6.4 Technical Assumptions Thermal Generator . . . 233 6.5 Technical Assumptions VRE Generation and Storage . . . 233 6.6 Technical Assumptions Thermal Generator . . . 233 6.7 Brownfield Capacity Conditions for 2020 . . . 234 6.8 Demand Series Descriptors by Year . . . 236
Executive Summary
The electric power sector is widely expected to be the linchpin of efforts to reduce greenhouse gas (GHG) emissions. Virtually all credible pathways to climate stabilization entail twin challenges for the electricity sector: cutting emissions nearly to zero (or even net-negative emissions) by mid-century, while also expanding to electrify and consequently decarbonize a greater share of global energy use.
There is nevertheless considerable debate and uncertainty about the best pathways to reach near-zero emissions power systems and the relative importance of various available and potential electricity resources. Given the multi-decadal time horizons inherent in de-carbonization, much of this debate arises from deep uncertainty regarding: eventual low-carbon technology cost, availability, feasibility (economical, technical and political) and performance; the evolution of electricity demand; and the stringency or format of policies driving decarbonization.
Increasing demand and changing patterns of electricity consumption and generation are further complicating the transition to a sustainable energy system, requiring new methods to inform decision and policy-makers. Existing decision-making tools and technology valuation metrics are mainly cost-based and focus on the individual technology, comparing technologies on an annualized average cost of production –e.g., Levelized Cost of Electricity, Levelized Cost of Storage, etc. New approaches are required to determine a technology’s value in the power systems of the 21𝑠𝑡 century. A shortcoming of cost-based methods is their inability to account for technological value and the trade-offs between value and cost in order to properly inform decision-makers. As previous research has shown, technologies exhibit a declining marginal value to the system as their penetration in the system increases; but at the same time due to learning effects, among other factors, they also exhibit decreasing cost with increased penetration. It therefore becomes important to capture the interactions of
these two competing effects in system planning for decarbonization.
In light of recent cost improvements and the rapid expansion of wind power and solar photovoltaics, many researchers have explored the opportunities and challenges associated with achieving very high shares of these VRE resources in power systems. Power systems with high VRE shares require sufficient capacity from reliable electricity sources that can sustain output in any season and over long periods (weeks or longer). Some of this research has excluded firm low-carbon resources ex ante – resources such as nuclear, geothermal, biomass, and fossil fuels with carbon capture and storage– in part because of the societal challenges or current costs associated with some of these resources. Other studies partially or fully replace firm generation with one or more energy storage media capable of sustained output over weeks or longer and suitable for low annual utilization rates. No such energy storage options exist at large scale today, however. Given the challenges now facing available firm low-carbon resources, it is tempting for policymakers, socially conscious businesses, and researchers to bet exclusively on today’s apparent winners: solar photovoltaics (PV), wind, and battery energy storage.
In Chapter 2 this thesis develops its own methodology that models investments and operation of power systems at the hourly level over a full year subject to specific policies, chronological variability of load and renewable energy availability, operational constraints of thermal generators and system flexibility requirements, and transmission network represen-tation. Figure 0-1 shows an overview of the methodology where both the long-term invest-ment problem and the short-term operation problem are co-optimized in a single monolithic problem. By incorporating detailed operational and cost information in a unified framework for investment decisions subject to policy constraint (e.g., energy targets and CO2 limits) we are able to endogenously account for the value cost trade-off and dynamics in the decision making process, with resources being deployed at the level that their marginal cost equals their induced marginal benefit in the system. This allows us to better assess the impact at the system level of having or not having a technology option available. Additionally, we are able to examine how this dynamics changes as function of other exogenous factors such as expected declines in capital costs, as well as energy policy commitments. Chapter 2 explains the process for taking the capacity expansion problem from the energy expert domain – that is, the constraint-by-constraint formulation with “power systems meaning” (e.g., demand balance or ramping limits constraints) that we call “Energy Expert Form” –
Figure 0-1: Value-Cost Methodology Overview
to the mathematical expert domain – that is, the mathematical formulation with matrices and vectors that have no clear physical meaning (we call it “Operations Research Expert Form”). This transformation is key for understanding the underlying problem structure and for the development of more advanced methods as is done in this research.
In Chapter 3 the value-cost trade-off methodology is used to assess the role and value of firm low-carbon resources in decarbonization of power generation. We investigate the role of firm low-carbon resources in decarbonizing power generation in combination with variable renewable resources, battery energy storage, demand flexibility, and long-distance transmission. We evaluate nearly 1,000 cases covering varying CO2 limits, technological un-certainties, and geographic differences in demand and renewable resource potential. Figure 0-2 presents a graphical abstract of our analysis where we have proposed a new taxonomy of resources with three classes: (i) Fuel Saving Variable renewables (Solar PV, Onshore Wind, etc), (ii) Fast Burst Energy or Power Constrained Resources (Battery Storage, Demand Re-sponse, etc), and (iii) Firm Low-Carbon Resources (Nuclear, Natural Gas with CCS, etc).
We find that the availability of firm low-carbon technologies – including nuclear, natural gas with carbon capture and sequestration, and bioenergy – reduces electricity costs by 10-62% across fully decarbonized cases. For carbon emission limits below 50 gCO2/kWh, these resources lower costs in the vast majority of cases. Additionally, as emissions limits are tightened, the optimal installed capacity of several resources changes non-monotonically. This underscores the need to evaluate near-term policy and investment decisions based on their impact on long-term decarbonization, rather than interim goals, as well as the need to develop methods that can account for the sequential nature of the decision process. Our findings also show that the deployment of all resources is strongly affected by uncertain technology parameters. This emphasizes the importance of a broad research portfolio and flexible policy support that expands rather than constrains future options. As shown in Figure 0-2, we also find that firm low-carbon resources not only reduce system cost but can
also hedge risk in decarbonization strategies by narrowing the range of possible outcomes in the event that expected cost declines in other technologies do not materialize. We observe this benefit even when the current costs of firm low-carbon resources are assumed to remain constant.
In Chapter 4 the methodology is used to assess the role and value of long duration energy storage (LDES) technologies in decarbonization of power systems. Using extensive paramet-ric analysis, we identify combinations of several cost and efficiency characteristics (or “LDES design space” combinations) that would be necessary for long duration energy storage tech-nologies to reduce system cost when competing against firm low-carbon generation sources (nuclear, natural gas with CCS, hydrogen combustion) in decarbonized electricity systems. We use the term “Long Duration Energy Storage” (LDES) to refer to various technologies that are expected to be economically and technically suitable for storing energy in sufficient amounts to sustain electricity production during discharge over periods of days or weeks. LDES thus offers a potential solution for managing the variability of wind and solar gen-eration over long time scales that may reduce or obviate the need for firm gengen-eration. We explore the current objectives of Long Duration Energy Storage research and development programs along with current appraisals of technology prospects to define the “LDES Space”. Our “design space” encompasses domains of performance that are consistent with projections for existing storage technologies as well as domains that are currently infeasible but that could be the focus of new technology development efforts in the near future.
Figure 0-3 shows a graphic summary of our analysis. “LDES total system cost” is the resulting combination of the selected energy capacity capital cost [$/kWh], the selected charge power capacity capital cost [$/kW] weighted by the system’s maximum duration – energy capacity divided by discharge power capacity – and the selected discharge power capacity capital cost [$/kW] weighted by the system’s minimum time to full charge – energy capacity divided by charge power capacity. We find that LDES total system cost below 40 [$/kWh] are required for LDES technologies to help reduce electricity cost more than 10% in the best case scenario. LDES parameter combinations in the domain regions currently infeasible (no prospect technology currently exists) can help reduce up to around 50% of electricity cost. However, a maximum of 35% electricity cost reduction is identified in domain regions of future projections (technologies currently under development). Additionally, we find that complete substitution of firm low-carbon capacity could be potentially achieved
for LDES total system costs of 30 [$/kWh] or less, if nuclear is the only firm low-carbon technology that is available. However, the LDES total system cost would need to fall below 10 [$/kWh] to eliminate all firm low-carbon options from the power system. Finally, we find that the LDES storage duration requirement exceeds 100 hours in LDES systems that have the highest impact in terms of overall electricity cost reduction and firm low-carbon substitutability.
Figure 0-3: Graphical Abstract The Role of Long Duration Energy Storage
Figure 0-3 illustrates the range of results for a given value of the LDES system total cost. This distribution is a function of the competing low-carbon firm technologies that are assumed to be available and the efficiencies for charging and discharging. We find that discharge efficiency improvements have an impact on LDES system performance that is twice as large as charge efficiency improvements. The main driver of LDES system value and system total cost is the assumed capital cost for energy capacity of the system.
multi-year dynamic methodology that can account for sequential decision-making, foresight and high-level policy and/or technological uncertainty, while preserving the year-long hourly de-tail at the operational level for each year. In order to develop a multi-year methodology we combine our static methodology with concepts of dynamic programming. We build from the mathematical problem structure derived in Chapter 2 to analyze the matrix structure of the multi-year problem. We then make use of advanced optimization concepts to de-velop a 3-level nested decomposition framework, the Forward Looking Investment Planning (FLIP) framework, that transforms the computationally intractable multi-year problem into a tractable problem. Figure 0-4 shows the FLIP framework.
Figure 0-4: High-Level 3-Level Nested Decomposition
As shown in Figure 0-4 FLIP breaks the problem into different sub-problems at differ-ent levels, integrating them to build up an overall solution. We accomplish this by inte-grating into one framework three decomposition methods, namely, Benders Decomposition (BP), Dantzig-Wolfe Decomposition (DW) and Stochastic Dual Dynamic Decomposition (SDDP/DDP). This allows us to divide our problem at the level of individual years us-ing SDDP/DDP; then, to divide the yearly problems into a set of investment-only and operations-only problems using BP; and then, to divide the operations-only problems at the sub-period level (e.g., weeks) using DW. All this is done while maintaining coupling requirements within the year and across years in the system and as part of our solutions.
The result is that we must solve not one, but hundreds of smaller and easier problems iter-atively to converge to the same solution that the original multi-year problem would provide if computationally tractable. In this thesis we develop the math and optimization concepts that guarantee that our framework will converge to the optimal solution of the original in-tractable problem. Furthermore, the FLIP framework allows the user to use computational parallelization within and across computers making it possible to solve increasingly complex problems in high-performance computer clusters such as the Engaging cluster at MIT.
In Chapter 6 we apply FLIP to a number of initial case studies meant to demonstrate its utility and provide initial insight into the potential value as well as possible new analyses that would inform decarbonization of power systems using this framework. We assess the role of “sequential adaptation” – that is, the effect on the investment plan by taking a dynamic approach where decision are affected by investments in previous periods, instead of a static one that only models the final stage – by comparing results or investment plans for decarbonization obtained on a test cases using a “static” strategy (only the final stage or end of the planning horizon is simulated, e.g., 2050), a “dynamic myopic” strategy (each stage is solve sequentially and use as initial conditions for the next stage, but no information about future stages is used) and a dynamic strategy with foresight (each stage is solve sequentially accounting for the impact on future stages). We build a test system using New-England like data with load profiles for each year evolving over time due to electrification of other energy uses. We include existing capacity in the system and account for their remaining lifetime, forcing retirements at the of it. Additionally, we look at the results of incorporating high-level uncertainty in the decarbonization policy in our test system. We find that in the dynamic strategy with foresight FLIP allows the capacity expansion problem to learn about future decarbonization goals adapting the investment strategy for early stages with less stringent constraints accordingly – for example deploying renewable resources in combination with battery storage earlier in the planning horizon. Additionally, when comparing the stage at the end of the planning horizon obtained with the dynamic strategy with foresight to the results obtained with the static strategy we see that the results come very close. On the other hand, investment plans differ considerably when comparing the stage at the end of the planning horizon obtained with the dynamic myopic strategy to the results obtained with the static strategy, pointing to the relevance of including imperfect future information in the optimization.
Finally, we analyze how adding high-level uncertainty in the decarbonization commit-ment – that is, the commitcommit-ment can be dropped with some probability in the future – affects investment trajectories and electricity cost. We find that the lack of lead time of deployment – that is, the time between investment decision are made and resources become available in the system – makes the capacity expansion problem more flexible that it should be as the investment mix can adapt rapidly, reducing the effect of uncertainty. Additionally, we find that assumptions on the treatment of capital invested in assets whose lifetime ends beyond the planning horizon (e.g., nuclear plant with 40 years of lifetime deployed in 2040 when the planning horizon ends in 2050), greatly changes investment trajectories and the role of uncertainty. These final results show clear future steps in our for the research beyond this thesis.
Chapter 1
Introduction
1.1
The Role of Power Systems in Decarbonization
The electric power sector is widely expected to be the linchpin of efforts to reduce greenhouse gas (GHG) emissions. Virtually all credible pathways to climate stabilization entail twin challenges for the electricity sector: cutting emissions nearly to zero (or even net-negative emissions) by mid-century, while expanding to electrify and consequently decarbonize a much greater share of global energy use [25].
Studies considering economy-wide GHG reduction goals consistently envision the power sector cutting emissions further and faster than other sectors of the economy, achieving close to zero (or net negative) emissions in 2050. Because electricity is technically easier and less costly to decarbonize than other sectors, economy-wide studies rely upon expanded generation of carbon-free electricity to meet greater shares of energy demand for heating, industry, and transportation. Across global decarbonization scenarios produced by 18 mod-eling groups, for example, electricity demand increases 20%–120% by 2050 (median estimate of 52%) and 120%–440% by 2100; electricity supplies 25%–45% of total energy demand by mid-century and as much as 70% by 2100. In the United States, electricity use could in-crease 60%–110% by 2050 as electricity (and fuels produced from electricity, e.g., hydrogen) expand from around 20% of final energy demand at present to more than 50% by 2050.[25] Scholars agree that the electricity sector must not only decarbonize but also steadily increase its end-use market share through mid-century and beyond. It follows that a failure to deeply decarbonize the power sector would imperil climate mitigation efforts across the broader economy. At the same time, costly routes to decarbonization that substantially
increase the price of electricity would make low-carbon electricity a less attractive substitute for oil, natural gas, and coal in transportation, heating, and industry. Finding feasible and affordable routes to decarbonize the power sector thus takes on outsized importance in global climate mitigation efforts.
In [25] authors review and distill insights from 40 such studies published since the most recent Intergovernmental Panel on Climate Change review in 2014. Despite differing meth-ods, scopes, and research questions, several consistent insights emerge from this literature. The studies collectively outline and evaluate two overall paths or policies to decarbonize electricity: one that relies primarily (or even entirely) on variable renewable energy sources (chiefly wind and solar power) also called “Renewable Standards” –supported by energy stor-age, greater flexibility from electricity demand, and continent-scale expansion of transmission grids; and a second path that is inclusive of a wider range of low-carbon resources –including wind and solar as well as resources such as nuclear, geothermal, biomass, and fossil fuels with carbon capture and storage (CCS)– also called “Clean Energy Standards”. Whichever path is taken, authors find strong agreement in the literature that reaching near-zero emis-sions is much more challenging—and requires a different set of low-carbon resources—than comparatively modest emissions reductions (e.g., CO2 reductions of 50%–70%). This is chiefly because plans for achieving the more modest goals can readily employ natural gas-fired power plants to replace coal plants and maintain the system’s flexibility and reliability, whereas pushing to near-zero emissions requires replacing the vast majority of fossil fueled power plants or equipping them with CCS.
In light of recent cost improvements and the rapid expansion of wind power and solar photovoltaics, many have explored opportunities and challenges associated with achieving very high shares of these VRE resources in power systems. While overgeneration arises during periods of abundant supply, periods of scarce wind or solar production are the flip side of the variability challenge. Prolonged periods of calm wind speeds lasting days or weeks during winter months with low solar insolation are particularly challenging for VRE dominated systems. These sustained lulls in available wind and solar output are too long to bridge with shorter-duration batteries or flexible demand. Power systems with high VRE shares consequently require sufficient capacity from reliable electricity sources that can sustain output in any season and for long periods (weeks or longer). Some of these studies have excluded firm low-carbon resources ex ante – resources such as nuclear, geothermal,
biomass, and fossil fuels with carbon capture and storage– in part because of the societal challenges or current costs associated with some of these resources. Other studies partially or fully replace firm generation with one or more energy storage media capable of sustained output over weeks or longer and suited to low annual utilization rates. No such energy storage options exist at large scale today, however. Even at $100 per kWh of installed energy capacity (less than a third of today’s costs), enough Li-ion batteries to store one week of United States electricity use would cost more than $7 trillion, or nearly 19 years of total United States electricity expenditures. Scenarios that eschew firm generation therefore must rely upon one or more long-term energy storage technologies with an order-of-magnitude lower cost per kWh, such as thermal energy storage, production of hydrogen from electrolysis and storage in underground salt caverns or pressurized tanks, or conversion of electrolytic hydrogen to methane. Considerable uncertainty remains about the real-world cost, timing, and scalability of these storage options.
Given the long-lived nature of power sector capital equipment and the long gestation period for R&D efforts, it is critical to examine the distinct challenges inherent to deep decarbonization today; a policy of “muddling through” is unlikely to produce optimal out-comes. Given the challenges now facing available Firm Low-Carbon Resources, it is tempting for policymakers, socially conscious businesses, and research efforts to bet exclusively on to-day’s apparent winners: solar photovoltaics (PV), wind, and battery energy storage. This research evaluates whether or not that would be a winning strategy by first analyzing the role of firm low-carbon resources in deep decarbonization of power generation, and then studying the potential impact that order-of-magnitude cheaper “seasonal” storage technologies could mean for deep decarbonization efforts.
1.2
Cost-Based versus Value-Cost Mental Models
As mentioned already, in light of recent cost improvements and the rapid expansion of wind power, solar photovoltaics, and Li-ion battery storage it is tempting to bet exclusively on today’s apparent winners: solar photovoltaics (PV), wind, and battery energy storage. The argument is as follows: as solar and wind scale up, they ride down the experience curves, further reducing cost. Eventually they become cost competitive with other resources like coal and natural gas based on the average cost of electricity per MWh produced. Increasing
competitiveness increases deployment, further reducing cost; further deployment follows. Existing decision-making tools and technology valuation metrics are mainly production cost-based and focus on the individual technology. The Levelised Cost of Electricity (LCOE) is an intuitive metric for technology-specific cost, aggregating the investment and operational cost per unit of energy generated in $/MWh. This metric was practical in a 20𝑠𝑡 century electricity system, containing exclusively dispatchable power plants. Today, however, the LCOE has lost its meaning as it does not account for asset operability, price, or production variability, nor the impact that a plant’s operation has on the electricity system in terms of reliability and operability as a whole (e.g., necessary back-up capacity, balancing and inertial services, reduced utilisation factors and increased emissions for other power plants). It is becoming clear that such services and technology features provide value to the power system but are not captured by existing valuation tools that are purely based on technology-specific production cost.
Here we develop an alternative approach that we will refer to as the “Value-Cost Model”. Rather than comparing different resources based on production cost (LCEO), the “Value-Cost Model” compares the marginal cost of each resource to the marginal value that the same resource provides to the system if is deployed. In order to set up this model it is important to understand that electricity resources provide decreasing marginal value. Take solar, for example. As solar penetration grows, its value to the electricity system decreases [52]. One way to see this is by observing the wholesale market price of electricity when solar generation is highest. The more solar energy that feeds into the grid, the lower the wholesale price will be during periods of peak solar production, as more supply chases demand. In the short term, this has little impact on competitiveness. Most solar projects are insulated from wholesale market prices because they have long-term fixed-price power purchase agreements. However, in the long term, as solar penetration increases, regulators and utilities around the world are likely to align solar compensation more closely with wholesale market pricing [52]. As shown in Figure 1-1, studies simulating the wholesale markets in Texas and Germany have revealed that at penetrations of roughly 15% (measured in kWh of generated electric-ity), solar’s value – measured as the average wholesale price that the solar generators see in the market– to the grid would decline by about half, compared with its value at zero penetration. Of studies simulating the California grid, one examines “value deflation” at a 30% solar penetration, forecasting that solar would lose over two-thirds of its value. Thus,
the installed cost of solar must continue to fall substantially to enable 30% penetration [52].
Figure 1-1: Forecast average wholesale price during PV production as a function of increasing solar PV penetration[52]
This effect is also true for wind power. Wind is not quite as coincident with demand, so its price-suppression effect is somewhat less concentrated, but it exists. Energy storage can help reduce this decreasing marginal value effect specially for variable renewable generation by moving energy from hours of excess or low-value energy (low prices) to hours of shortage or high-value energy (high prices). However, energy storage itself is a victim of the very same effect [13]. The first MWh of energy storage deployed in the system will be used to move in time the marginal unit of energy with the highest value. The next MWh of energy storage will be used to move the second-highest, and so on and so forth. In the end storage will be deployed in the system until the marginal cost of storage equals the marginal value of the unit of energy that will be shifted in the system. Once again, since the every unit of energy that is shifted has lower value than the previous one, storage costs must continue to decline in order to achieve high penetration levels. In [19] the authors investigate the system value (SV) of on-shore wind, natural gas with carbon capture and sequestration and Li-ion battery storage. Their results show that this marginal decreasing value effect is true for all technologies present in the system, as shown in Figure 1-2. Furthermore, in their analysis the authors show that the value of a technology is not only a function of the level of capacity availability or penetration level, but is also strongly dependent on the system design, other available technologies, and the system constraints such as carbon targets or
security requirements within which it is operating.
The “HiNuk” and “LoNuk” scenarios refer to a 50% increase and decrease in available nuclear capacity, re-spectively. Scenarios “HiRES” and “LoRES” are defined by a 80% increase and a 50% decrease of intermittent renewable (onshore and offshore wind) capacity.
Figure 1-2: Impact of different penetrations on system value (SV) of onshore wind, CCS, and grid-level energy storage capacity. [19]
In a theoretical world, decision-makers would deploy a technology if its system value is greater than its cost. This new deployment would reduce the technology’s system value, but at the same time it would reduce its cost (riding down the experience curve). Deployment should continue for as long as the system value is greater than cost and stop at the technology deployment level where these two curves intersect , i.e., marginal system value is equal to the marginal cost of deployment.
However, the real world is not that simple. The cost reduction behavior will be deter-mined by technological factors like technology maturity, materials cost, labor cost, among other factors outside of the power system. The system value behavior will be determined by power system specific factor like geography, deployment of other competing and com-plementary technologies, etc. Moreover, the analysis that decision-makers must carry out involves many technologies with changes occurring simultaneously in the system – increased penetration of VRE with increased penetration of battery storage for example– with the value and cost dynamics inter-linked for all technologies changing endogenously.
Proper characterization of the value-cost dynamics is then key for a well-informed decision-making process. Technologies that might look promising from a purely production cost-based perspective might present short-lived value in the system with “optimal” penetrations (de-ployment at which value and cost are equal) lower than expected. The other way around is also true. Technologies that look too costly from a purely production cost-based perspective might present long-lived value in the system with ‘optimal” penetrations higher than
ex-pected. The challenge is that though cost can be exogenously approximated, ultimately, the incremental system value of a technology is a function of the prevalent system design and constraints and must be endogenously determined. Therefore, a centrepiece of value-based technology assessment methods are electricity system models which account for system inte-gration effects and related technology behaviour. The degree to which system requirements, environmental targets, and technical variety and detail are present in the model formulation must then be adequate for the decision-making or policy question.
For decarbonization and increasing penetration of variable renewable generation and battery storage it is essential to include enough operational detail in the model formula-tion. The reason for this is the need to capture challenges like the variable nature of wind and solar power, the different value sources of energy storage (energy, capacity deferral, network deferral, etc), the technical constraints of thermal plants (cycling, ramping limits, etc) and the synergies between different resources at the operational level. Power systems value technical characteristics (flexibility, location, uncertainty, ability to provide services, etc) differently depending on the system’s characteristic, consumption profiles and policies in place (CO2 target, Clean Energy Standard or Renewable Standard). To overcome the
challenges in characterizing the relationship between the two moving targets, value and cost, for decarbonization of power systems with increasing penetration of variable renewable en-ergy this research develops its own methodology that models investments and operation of power systems at the hourly level for the whole year subject to specific policies, chronologi-cal variability of load and renewable energy availability, operational constraints of thermal generators and system flexibility requirements, and transmission network representation.
1.3
Sequential Adaptation
Decarbonization of power systems must deal with considerable debate and uncertainty about the best pathways to reach near-zero emissions power systems and the relative importance of various available and potential electricity resources. Given the multi-decadal time horizons inherent in decarbonization, much of this debate arises from deep uncertainty regarding: eventual low-carbon technology cost, availability, feasibility (economical, technical and po-litical) and performance; the evolution of electricity demand; and the stringency or format of policies driving decarbonization.
Given the multi-decadal time horizons long-term planning must contend with increas-ingly challenging large-scale problems that can quickly become computationally intractable. Current approaches for long-term planning of power system consist mainly of two types: the first approach is comprised of models that simulate long-term planning over decades by simplifying the operational detail of the system by sub-sampling “representative” time periods (hours or days) of the year reducing considerably the scale of the problem, but at the same time losing much of the important details that drive system requirements like flexibil-ity or the need for short and long term storage devices. The second type is the “snap-shot” approach which, in order to properly account for operational details driving investment de-cisions, models only a single future year of interest (e.g. 2050) without intermediate steps, thereby providing an idea of what the system should look like but no clue as to how to get there. These two approaches each fall short in informing decarbonization efforts since on the one hand they lack enough detail to generate reliable investment plans and on the other they provide only the end-goal with no insight as to when the investments should take place.
The delayed deployment of low-carbon energy technologies can impede energy system decarbonization or set us on the wrong track to achieve the mitigation goal. However, devel-oping decarbonization plans requires the use of imperfect future information and expected technology development while accounting for uncertainty in both technology realizations and policy commitments. “Myopic adaption” – that is, adaptation planning in chunks of only a few years into the future– has been shown to produce more expensive and less efficient results [20]. Furthermore, not properly accounting for operational challenges and requirements of power systems by excessive simplification of the system’s features can generate strategies that will completely miss the goal.
New methods that can manage multi-decadal time horizons while accounting for detailed operation of the system and high level uncertainty are required. However, such methods face computational tractability issues. Including greater detail and an increased number of years within the same problem, quickly makes the problem insoluble with current computational resources and solvers. This thesis takes on the challenge of developing such new methods, combining optimization methods within a unified framework allowing us to harness compu-tational flexibility and scalability while capturing the effects of greater operational details of power systems in multi-year planning.
1.4
Thesis Overview
The remaining of this thesis is organized as follows:
Chapter 2 develops a static “snap-shot” methodology for power system planning with policy constraints and detailed operation. The methodology models investments and oper-ation of power systems at the hourly level for the whole year subject to specific policies, chronological variability of load and renewable energy availability, operational constraints of thermal generators and system flexibility requirements, and transmission network represen-tation. By incorporating detailed operation and cost in a unified framework for investment decisions subject to policy constraint (e.g., energy targets, CO2limits, etc) we are able to
en-dogenously account for the value-cost trade-off and dynamics in the decision making process with resources being deployed to the level at which their marginal cost equals their induced marginal benefit in the system. This allows us to better assess the system-level impact of having or not having a technology option available. Additionally, we are able to examine how this dynamic is affected by other exogenous factors like expected capital cost declines and energy policy commitments. The chapter also develops the basic understanding needed to transform the capacity expansion problem from its constraint-by-constraint formulation with “power systems meanings” such as demand balance or ramping limits – we refer to this as the “Energy Expert Form”– into a mathematical form with matrices and vectors that have no clear physical meaning – we refer to this as the “Operations Research Expert Form”– that is key for understanding the underlying problem structure and for developing more advanced methods as is done in Chapter 5.
Chapter 3 presents an analysis of the role and value of firm low-carbon resources in decarbonizing power generation. We investigate the role of firm low-carbon resources in decarbonizing power generation in combination with variable renewable resources, battery energy storage, demand flexibility, and long-distance transmission. We evaluate nearly 1,000 cases covering varying CO2 limits, technological uncertainties, and geographic differences in
demand and renewable resource potential.
Chapter 4 presents an analysis of the role and value of long duration energy storage (LDES) technologies in decarbonizing power systems. Using extensive parametric analysis, we identify combinations of several cost and efficiency characteristics (or “design space” combinations) that would be necessary for long duration energy storage technologies to
reduce system cost when competing against firm low-carbon generation sources (nuclear, natural gas with CCS, hydrogen combustion) in decarbonized electricity systems. We use the term “Long Duration Energy Storage” (LDES) to refer to various technologies that are expected to be economically and technically suitable for storing energy in sufficient amounts to sustain electricity production during discharge over periods of days or weeks. LDES thus offers a potential solution for managing the variability of wind and solar generation over long time scales that may reduce or obviate the need for firm generation. We explore the current objectives of Long Duration Energy Storage research and development programs along with current appraisals of technology prospects to define the “LDES Space”. Our “design space” encompasses domains of performance that are consistent with projections for existing storage technologies as well as domains that are currently infeasible but that could be the focus of new technology development efforts in the near future.
Chapter 5 of this thesis expands the static methodology developed in Chapter 2 into a multi-year dynamic methodology that can account for sequential decision-making, foresight and high-level policy uncertainties, while preserving the year-long hourly detail at the op-erational level for each year. In order to develop a multi-year methodology we combine our static methodology with concepts of dynamic programming. We build from the mathemati-cal problem structure derived in Chapter 2 to analyze the matrix structure of the multi-year problem. We then make use of advanced optimization concepts to develop a 3-level nested decomposition framework, the Forward Looking Investment Planning (FLIP) framework, that transforms the computationally intractable multi-year problem into a tractable prob-lem.
Chapter 6 applies FLIP to a number of initial case studies meant to demonstrate its utility and provide initial insight into the potential value as well as possible new analyses that would inform decarbonization of power systems using this framework. We assess the role of “sequential adaptation” – that is, the effect on the investment plan by taking a dynamic approach where decision are affected by investments in previous periods, instead of a static one that only models the final stage – by comparing results or investment plans for decarbonization obtained on a test cases using a “static” strategy (only the final stage or end of the planning horizon is simulated, e.g., 2050), a “dynamic myopic” strategy (each stage is solve sequentially and use as initial conditions for the next stage, but no information about future stages is used) and a dynamic strategy with foresight (each stage is solve sequentially
accounting for the impact on future stages).
Finally, Chapter 7 summarizes the work done, presents the contributions made in this research and provides insight into future work.
Chapter 2
Technology Valuation for
Decarbonization Efforts
This thesis develops a methodology that models investments and operation of power systems at the hourly level for a full year subject to specific policies, chronological variability of load and renewable energy availability, operational constraints of thermal generators and system flexibility requirements, and transmission network representation. By incorporating detailed operation and cost in a unified framework for investment decisions subject to policy constraint (e.g., energy targets, CO2 limits, etc) we are able to endogenously account for the value-cost trade-off and dynamics in the decision making process with resources being deployed to the level at which their marginal cost equals their induced marginal benefit in the system. We also develop the mathematical notation and base knowledge to explore the mathematical structure of problem and develop more complex methods later on in this dissertation.
2.1
Methodology to capture value-cost trade-off
Existing decision-making tools and technology valuation metrics are mainly cost-based and focus on the individual technology. The Levelised Cost of Electricity (LCOE) is an intuitive metric for technology-specific production cost, aggregating the investment and operational cost per unit of energy generated in $/MWh. This metric was practical in a 20𝑠𝑡 century electricity system, containing exclusively dispatchable power plants. Today however, the LCOE has lost its meaning as it does not account for asset operability, prices and production
variability, nor the impact that a plant’s operation has on the electricity system in terms of reliability and operability as a whole (e.g., necessary back-up capacity, balancing and inertial services, reduced utilisation factors/increased emissions for other power plants). It is becoming clear that such services and technology features provide value to the power system but are not captured by existing valuation tools purely based on cost.
Rather than comparing different resources to one another based on cost (LCEO), the “Value-Cost Model” compares the marginal cost of each resource to the marginal value that the same resource provides to the system if is deployed. Technologies that might look promising from a purely cost-based perspective might present short-lived value in the system with “optimal” penetrations below expectations, and the other way around. The challenge is that although cost can be exogenously approximated, ultimately the incremental system value of a technology is a function of the prevalent system design and constraints and must be endogenously determined. Therefore, a centrepiece of value-based technology assessment methods are electricity system models which account for system integration effects and interrelated technology behaviour. The degree to which system requirements, environmental targets, and technical variety and detail are present in the model formulation must then be adequate for the decision-making or policy question.
For decarbonization and increasing penetration of variable renewable generation and battery storage it is essential to include enough operational detail in the model formulation. The reason for this is the need to capture challenges like the variable nature of wind and solar power, the different value sources of energy storage (energy, capacity deferral, network deferral, etc), the technical constraints of thermal plants (cycling, ramping limits, etc) and the synergies between different resources at the operational level. Systems value technical characteristics (flexibility, location, uncertainty, ability to provide services, etc) differently depending on the system’s characteristics, consumption profiles and policies in place (CO2
target, Clean Energy Standard or Renewable Standard).
The methodology developed in this chapter tractably includes the operational details of thermal units and unit commitment constraints in a capacity planning optimization on a multi-zonal framework, while subject to CO2 emissions constraints or other policies and
hourly detail at the operational level. The methodology allows for the simultaneous co-optimization of four interlinked power system decision layers:
2. Optimal generation dispatch, 3. Optimal power flow between zones,
4. Clustered unit commitment operations [43]
Figure 2.1 presents a high level description of the methodology structure, where the objective is to minimize the annualized investment and operational cost (fixed and variable O&M, fuel cost and cycling cost) while subject to system constraints involving: (i) demand balance to match demand and the operation of the system resources at every hour; (ii) policy constraints driving investments to accomplish some goal like a renewables mandate or CO2
goal; (iii) investment related constraints for retirements and maximum new deployments, among others; (iv) the economic dispatch matching supply and demand at minimum cost possible, while imposing operational constraints like ramping limits and minimum stable limits of operations, and also setting limits on the power flows across zones; (v) unit com-mitment constraints setting the limits in the cycling of assets in the system; (vi) resource specific constraints like flexible demand or other devices; and (vii) non-negativity constraints requiring that all variables, except the power flow variables, must to be non-negative.
Table 2.1: Model’s General Structure and Reference to Equations Minimize Investment costs + Fixed & Variable Operational costs (2.1)
s.t.: Demand Balance Constraints (2.2)
Policy Constraints (2.3-2.4)
Investments Related Constraints (2.5) Economic Dispatch Constraints (2.7-2.9) Unit Commitment Constraints (2.10-2.12) Technology Specific Constraints (2.13-2.14) Non-Negativity Constraints (2.15)
We use an optimization-based method to capture the value/cost trade-off given the mathematical nature of optimization problems. These optimisation-based formulations are part of a larger class of energy system models, which also include simulation, energy market and qualitative analyses [19]. A key characteristic of optimization problems is that modifying the problem to include additional variables (investment options with associated operational variables and constraints, in our case) to increase “decision flexibility” will result in a problem
with a solution that can only have an improved or equal objective value than the original problem. That is, in the minimization context new decision variables will be used if and only if the incurred cost associated with those decisions reduces total system cost (objective function) by an amount equal to or greater than the incurred cost. A general principle of optimality is that adding options (variables) to an optimization problem will only affect the solution if the new options can improve the objective function; and the new options will be used to the extent that the improving effect on the objective function is exhausted. Given that (i) the system value (SV) quantifies the value of a technology to the power system as the reduction in total system cost caused by the deployment of the technology; and (ii) the objective function shown in Figure 2.1 endogenously accounts for the cost and decisions of new investments; then the general principle of optimality ensures that our methodology will produce investment strategies where the value to the system of each technology available has been exhausted and the marginal value equates the marginal cost of deployment.
The following sections introduce the notation, the problem formulation and problem matrix form.
2.2
Notation
2.2.1 Indices and Sets
Table 2.2: Model Indices
Notation Description
ℎ ∈ 𝐻 where ℎ denotes an hour and 𝐻 is the set of hours in a sub-period 𝑤.
𝑤 ∈ 𝑊 where 𝑤 denotes a sub-period and 𝑊 is the set of sub-period within the year. 𝑧 ∈ 𝑍 where 𝑧 denotes a zone/node and 𝑍 is the set of zones/buses in the network.
𝑙 ∈ 𝐿 where 𝑙 denotes a line and 𝐿 is the set of transmission lines in the network. 𝑔 ∈ 𝐺 where 𝑔 denotes a technology cluster and 𝐺 is the set of available resources. 𝑠 ∈ 𝑆 where 𝑠 denotes a segment of consumers and 𝑆 is the set of all consumers segments.
![Figure 0-2: Graphical Abstract The Role of Firm Low-Carbon Resources [50]](https://thumb-eu.123doks.com/thumbv2/123doknet/14669096.556383/26.918.231.684.340.804/figure-graphical-abstract-role-firm-low-carbon-resources.webp)
![Table 3.5: Operational Cost Assumptions Technology Overnight Cost [$/kW] Fixed O&M cost [$/MW-yr] Variable O&Mcost [$/MWh] Start-up Cost [$/per MW Cap] Asset Life Time [years] Solar b Table 3.1 $13,300 - - 20 Wind b Table 3.1 $52,400 - - 20 4-Hour](https://thumb-eu.123doks.com/thumbv2/123doknet/14669096.556383/77.918.144.786.419.738/table-operational-assumptions-technology-overnight-fixed-variable-mcost.webp)
![Figure 3-4: Average cost of electricity under different technology assumptions and CO 2 emission limits for the Northern and Southern systems[50]](https://thumb-eu.123doks.com/thumbv2/123doknet/14669096.556383/85.918.142.786.194.935/average-electricity-different-technology-assumptions-emission-northern-southern.webp)
![Figure 3-5: Least-cost capacity mix in the Northern and Southern systems for different carbon emission limits[50]](https://thumb-eu.123doks.com/thumbv2/123doknet/14669096.556383/86.918.143.780.308.825/figure-capacity-northern-southern-systems-different-carbon-emission.webp)
![Figure 3-8: Effect on capacities and energy shares of demand side resources (DSR 5 vs DSR 1) and interconnection (20% vs 10%) as a function of emissions limit[50]](https://thumb-eu.123doks.com/thumbv2/123doknet/14669096.556383/91.918.141.785.303.828/figure-effect-capacities-energy-resources-interconnection-function-emissions.webp)


![Figure 4-4: Intersection between LDES Technology Space and Future Projections in Table 4.3 by [15]](https://thumb-eu.123doks.com/thumbv2/123doknet/14669096.556383/114.918.143.767.596.780/figure-intersection-ldes-technology-space-future-projections-table.webp)
