Design Optimization and Analysis of Coated Particle Fuel Using
Advanced Fuel Performance Modeling Techniques
By
Chaiyod Soontrapa
B.S., Economics, Mathematics, and Physics Carnegie Mellon University, 2001
MASSACHUSETTS INSTEI :
OF TECHNOLOGY
MAR 2 8 2006
LIBRARIES
Submitted to the Department of Nuclear Science and Engineering In Partial Fulfillment of the Requirements for the Degree of
ARCHVES
Master of Science in Nuclear Science and Engineering at the
Massachusetts Institute of Technology September 2005
(© 2005 Massachusetts Institute of Technology. All Rights Reserved.
}~~~~~~~~~~~~~~~~~~~~~~~ _
Signature of Author
-Department of Nuclear Since and Engineering September 2005
Certified by
Ronald G. Ballinger Professor of Nuclear Engineering and Materials Science and Engineering
Certified by
~~
l/~
·
/~~
~
Mujid
~
S.
Kazimi
TEP rosor of Nuclear Engineering
Accepted by
Accepte
by
t rJeffrey
A.
Coderre
Associate Professor of Nuclear Science and Engineering Chairman, Department Committee on Graduate Students
Design Optimization and Analysis of Coated Particle Fuel Using
Advanced Fuel Performance Modeling Techniques
By
Chaiyod Soontrapa
Submitted to the Department of Nuclear Science and Engineering in September 2005, in partial fulfillment of the requirements for the degree of Master of Science in Nuclear Science and Engineering
at the Massachusetts Institute of Technology
Abstract
Modifying material properties provides another approach to optimize coated particle fuel used in pebble bed reactors. In this study, the MIT fuel performance model (TIMCOAT) was applied after benchmarking against the experiment results. The optimization study focuses on the fracture toughness of silicon carbide and Bacon anisotropy factor (BAF) of pyrocarbon. The variations on the silicon carbide toughness show that higher fracture toughness leads to a lower fuel failure probability, as expected. However, the results from the BAF variations reveal that a higher BAF lowers a fuel failure probability. This quite contradicts the generally believed notion that a higher BAF would increase fuel failures. In addition to the fuel design optimization, the failure characteristics of coated particle fuel are explained and the key factors influencing such characteristics are identified.
Thesis Supervisor: Ronald G. Ballinger
Table of Contents
Chapter 1: Introduction and Review ... 5
1.1 Overview of High Temperature Gas-Cooled Reactors ... 5
1.2 Coated Fuel Particles ... 7
1.3 Failure mechanisms of coated fuel particles ... 15
1.4 Thesis Objective ... 20
Chapter 2: MIT Fuel Performance Model ... 21
2.1 General Description of the MIT Fuel Performance Model ... 21
2.2 Execution of Modeling Program ... 24
2.2.1 Input Description ... 24
2.2.2 Simulation Type ... 29
2.2.3 Output Description ... 32
Chapter 3: Benchmarking the MIT Model against the NPR Experiment Results .... 36
:3.1 Review of NPR Irradiation Program ... 36
:3.2 Benchmarking in This Optimization Study ... 41
3.3 Summary ... 47
Chapter 4: Optimization of Fuel Particles using the MIT Fuel Performance Model 48 4.1 General Comments ... 48
4.2 Optimization Based on Bacon Anisotropy Factor of Pyrocarbon... 52
4.3 Optimization Based on Stress Intensity Factor of Silicon Carbide... 58
4.4 Failure characteristics of fuel particles ... 62
4.5 Summary ... 76
Appendix A Appendix B Appendix C Appendix D References
The general input files for the NPR1 simulations ... 78
The irradiation history files for the NPR1 simulations ... 87
The input files for the MPBR1 cases ... 112
The input files for the MPBR2 cases ... 132
Chapter 1
Introduction and Review
High temperature gas-cooled reactor (HTGR) technology has recently received much attention worldwide. The technology provides an alternative source for future energy needs. A renewed interest in the HTGR technology largely grows out of its uniquely passive and inherent safety to retain radioactive fission products even at very high temperatures. With this high degree of safety, the modern HTGRs are designed to reside in more compact units that drive down the construction time and cost.
Consequently the HTGRs become more affordable to many developing countries where economic growths drive up energy demand.
1.1 Overview of High Temperature Gas-Cooled Reactors
The HTGR technology has dated back to the time when the first man-made sustained fission chain reaction took place in a pile of graphite. This event was an inspiration for the first experimental and production reactors. Since then the HTGR research program has undergone development processes in several countries including the United Kingdom, Germany, and the United States. As a result, variations in HTGR research and development have taken place in these countries.
The developments in the HTGR technology have focused on two different core designs: prismatic and pebble bed. Both reactor designs utilize the multi-coated fuel concept. This fuel scheme consists of fuel in micro-spheres coated with multiple ceramic
layers. In the prismatic fuel design, coated fuel micro-spheres mixed with graphite are bonded together and shaped into small cylindrical fuel compacts. These fuel rods reside inside the channels of hexagonal graphite blocks. The channels are not only for fuel insertions. Some channels serve as cooling passages while the others function as the locations for absorber and control material. An assembly of the hexagonal blocks forms a reactor core for a conventional stationary system such as the modular gas-turbine helium-cooled modular reactor (GT-MHR) [8]. This stationary system needs to be refueled periodically by replacing depleted compacts with the fresh fuel.
Unlike its counterpart, a pebble bed reactor has a continuous refueling system. The pebble bed reactor design uses fuel pebbles to generate power. Each pebble is in a
spherical shape with a size of a tennis ball and contains approximately 15,000 coated fuel particles within graphite matrix inside the pebble. It takes about 380,000 pebbles to run a typical 120 MWe reactor core. Fresh fuel pebbles are loaded on the top of the core. During an operation they move continuously down the core and exit at the bottom of the core. Then each pebble is checked for its integrity and bumrnup. Based on this inspection, an irradiated pebble is either re-circulated in the core again or replaced by a fresh fuel pebble.
The advanced design of the pebble bed system increases the level of safety and efficiency. Typically a pebble bed reactor utilizes helium as a coolant. Its conversion from thermal to electric powers goes up to 45% compared to about 33% for light water reactors. As a reactor coolant circulates through the spaces between fuel pebbles, it carries heat along with it. The coolant then transfers the heat at a heat exchanger which heats up a steam or gas to run a turbine system. In some cases the hot gas is supplied
directly to a power conversion system in a direct cycle. When in operation a pebble bed reactor core runs at a much higher temperature than a conventional light water reactor. It can extract higher mechanical power from the same amount of thermal energy.
When temperatures in pebble bed reactors rise, the more rapid motions of the atoms in the fuel increase the probability of neutron capture by U-238 atoms through an effect known as Doppler broadening. This reduces the number of neutrons available to cause U-235 fission, reducing the power output by the reactor. This natural negative feedback places an inherent upper limit on the temperature of the fuel without any operator intervention.
1.2 Coated Fuel Particles
Each fuel pebble is a 6cm sphere made of pyrolytic graphite with approximately 15,000 fuel spheres inside the containment layer of a pebble. These spheres are coated particles with nuclear fuels as their kernels. The kernels contain oxides of uranium, thorium, or plutonium and are enclosed by four containment layers. A low density porous pyrolytic carbon (PyC) buffer layer first surrounds the kernel. Then a triple-layered coating follows. This structural coating consists of a silicon carbide layer (SiC) sandwiched between two dense PyC layers designated as the inner PyC (IPyC) and outer PyC (OPyC) layers. This design of fuel particles is termed TRISO fuel particles (tri-isotropic PyC(/SiC/PyC structural layers). Figure 1-1 shows actual coated fuel particles.
[(A) kerneli
Buffer laver P% C ayers SiC( layer
Figure 1-1 Coated fuel particles
Coating of each layer is accomplished in a fluidized bed coater. The coating chamber is made of a graphite tube that can be maintained at a desired temperature level by electrical heating. Fluidizing gases enter the bottom of the coating chamber via a feeding nozzle. The flow rate of the fluidizing gas is appropriately adjusted to float and randomly shuffle the bed of particles in the chamber. A too high flow rate can throw particles out through the opening at the top of the chamber. This will result in coating defects.
Besides the fluidizing gases, coating gases also enter at the bottom of the chamber through a set of gas distribution nozzles. The coating gases are hydrocarbons such as methane (CH2), acetylene (C2H2) and propylene (C3H6) for the PyC layers and
methyltrichorosilane (CH3SiCl3) for the SiC layer. During the coating process, the
particles floating in the chamber are continuously agitated as the fluidizing gases such as hydrogen and argon in a mixture of the coating gases flushing in. The chamber wall heats up the gas mixture so that coating agents in the gas mixture decompose themselves and form coalescence before attaching to the fuel particle surfaces. As all particles freely
levitate inside the chamber, each particle will receive coating over time with about the same amount of material.
The coating for each layer can be done either continuously or interruptedly.
Continuous operating means when one layer is finished, another layer will be coated right after that. By doing so, the particles stay in the same chamber and wait for a new set of parametric adjustments (feed gases, flow rates, and temperature as a function of time). The continuous coating method greatly reduces introduction of foreign objects into the coatings. It also improves adhesion between two coatings. One drawback is that during the continuous operation defective particles cannot be removed until the operation is completed. However, the defective particles can be screened out at the end of the complete coating process. In contrast, the interrupted process allows layer-by-layer inspection before a start of a new layer coating. Such inspection may damage newly finished layers or permit impurities into the coatings. Therefore greater care is required for the interrupted coating.
As mentioned earlier, each fuel particle contains a kernel enclosed by four layers. From the inside out the four layers are
* Buffer layer
* Inner pyrocarbon layer * Silicon carbide layer * Outer pyrocarbon layer
Buffer Layer
The buffer layer serves three main purposes:
1. Fission Product Recoil Attenuation. The buffer layer prevents the impacts of the fission products generated from the fuel kernel to the inner pyrocarbon layer. During fission reactions, the fuel kernel ejects the fission products at high velocities. While having high kinetic energies, the fission products repeatedly bounce around whenever they hit the nearby material and give up some kinetic energies after each impact within the buffer layer. Eventually the buffer layer will be able to capture those recoils or slow them down significantly before they reach out the inner pyrocarbon layer. As a result the inner pyrocarbon layer can avoid heavy damage from the recoils.
2. Void Volume. The porous buffer layer absorbs various fission gases emitted from the irradiated fuel kernel. It also stabilizes the pressure arising from the fission gas buildup. 3. Sacrificial Layer. When the fuel kernel swells due to irradiation, the buffer layer gives the expanded fuel kernel extra volume.
Generally, for the buffer layer, the layer thickness turns out to be the most important property. If the buffer layer is too thin or missing, it can cause dramatic internal pressure increase and leads to premature failures of fuel particles. However, since the buffer layer has a low thermal conductivity compared to the thermal
conductivities of other layers, a very thick buffer layer can cause an undesired temperature rise in the fuel kernel. An increase in temperature will accelerate the diffusion of fission gas releases through the coatings. Since the core temperature limits are imposed to control these release rates.
The strength of the buffer layer is not considered to be an important design factor. In fact it is acceptable that the buffer layer exhibits deformation and shrinkage or even cracking to some degree as long as it isolates the fuel kernel from the inner pyrocarbon layer. However, crack paths through the buffer layer will expose the inner pyrocarbon layer to the fission recoils and introduce serious recoil damage.
Inner Pyrocarbon Layer
The inner pyrocarbon layer performs the following functions:
1. It protects the fuel kernel from chlorine compounds (HC1) used during the coating process of the silicon carbide layer. If chlorine can infiltrate to the fuel kernel, it will react with uranium. The resulting chlorides ingress through the fuel kernel contaminate the coating layers they come in contact with. When fissioning, these uranium compounds will emit fission products that damage the layers.
2. It helps smooth out the surface area of the silicon carbide layer during the silicon carbide coating. The buffer layer alone is too porous and hence will create roughness on the silicon carbide surface. The rugged surface on silicon carbide would become the potential sources of sharp crack openings for easy crack paths.
3. It can retard transport of the fission products to silicon carbide layer. The layer also confines most of the gas, fission product and, especially carbon monoxide (CO) that heavily attacks the silicon carbide layer at high temperatures.
4. It induces compression in the silicon carbide layer, and hence lengthens the life of fuel particles.
Silicon Carbide Layer
The silicon carbide layer has two important functions:
1. It acts as a pressure vessel to accommodate internal fission gas releases. 2. It serves as the main barrier to fission products.
The silicon carbide layer exhibits an excellent tensile strength given that its layer surfaces are sufficiently smooth. In addition most metallic fission products find the silicon carbide to be impermeable. In fact the strength and its distribution of silicon carbide remain as the only serious concerns for fuel particle design purposes. Other physical properties such as density, grain size, and grain orientation do not factor much in the design purposes. Chemical vapor deposition (CVD) of silicon carbide from
methyltrichorosilane (CH3SiCl3) at about 1500 °C at appropriate conditions results in a
density of about 3.20 g/cm3 which approaches its theoretical density of 3.21 g/cm3. However, there is no conclusive evidence that the fuel particle irradiation performance depends on these properties.
Although silicon carbide performs well at a low operating temperature (-1000 °C), high operating temperatures make silicon carbide susceptible to the environment. When the temperature rises above 1250 °C, fission products begin to heavily attack the silicon carbide layer. Palladium and lanthanides (cesium and strontium, for examples) are known as the key attackers at accident temperatures (-1600 - 1800 °C). In fact lanthanides are found active even at low temperatures, but the fuel kernel can retain lanthanides in oxide forms. Being a noble metal, palladium cannot be confined within the kernel in the oxide form, so palladium can reach the silicon layer and start degrading the layer. Additionally silver (Ag- 11 Om) has been found to migrate out of the silicon
carbide layer. It is used to be believed that diffusion drives the silver migration, but the new evidence points toward silver transport through micro cracks in the silicon carbide layer [4]. At temperatures beyond 2000 °C, silicon carbide decomposes and loses its integrity. Therefore, due to the issues at high temperatures, the normal irradiation temperatures are capped below 1300 °C with a maximum of 1600 °C in transient and
accident conditions.
During irradiation the interactions between the silicon carbide layer and the pyrocarbon layers can activate failure of the silicon carbide layer. Irradiation causes
shrinkage in the pyrocarbon layers and both inner and outer pyrocarbon layers are then in tension. This puts the silicon carbide layer in compression. As long as the silicon
carbide is in compression, the likelihood of silicon carbide failure will be small. The compression in the silicon carbide layer increases the chance that a fuel particle will not fail because the silicon carbide layer is the strongest layer among all layers. Thus, for design purposes, two important points are needed to be considered:
1. The pyrocarbon layer must keep the silicon carbide layer in compression as long as possible.
2. As a result from the previous point, the pyrocarbon layers must be intact as long as possible. When cracks occur in the pyrocarbon layers, the pyrocarbon layers can no longer keep the silicon layer in compression. The stresses in the silicon carbide layer reverse themselves from compression to tensile. Once the silicon carbide layer cracks, the fuel particle is at risk for failure.
The outer pyrocarbon layer is the final layer on the coated fuel particle. It has the following duties:
1. It serves as the final barrier to fission products generated by the fuel kernel.
2. It protects the silicon carbide layer from mishandlings during processes and handlings before irradiation.
3. It compresses the silicon carbide layer during irradiation
4. It isolates the silicon carbide layer from external chemical reactions. 5. It provides a bonding surface for matrix material during fuel fabrication.
The basic properties of the outer pyrocarbon layer are similar to those of the inner pyrocarbon layer. The only difference exists in the permeability of the two layers. The inner pyrocarbon layer takes a role to protect the fuel kernel from chlorine generated during the coating of the silicon carbide layer. The outer pyrocarbon layer takes part in bonding a fuel particle to the matrix material. So the surface of the outer pyrocarbon must be porous enough for the intrusion of the matrix material. However, if the outer pyrocarbon layer contains too many pores, too strong interlocking will take place due to favorable intrusion of the matrix material into those asperities. The heavy bonding between the outer pyrocarbon and matrix material will crack the outer pyrocarbon layer due to the shrinkage of pyrocarbon during irradiation.
To summarize, the layers surrounding the fuel kernel serve two distinct purposes. When a fuel kernel releases radioactive gases, mostly xenon, the porous PyC layer absorbs them. This function also helps retaining fission gases within a reactor core and can provide heat as the energy. The TRISO layers function as containment layers, especially the SiC layer. The SiC layer does not burn and has very high fracture
toughness. The high-density nonporous PyC layers bounding the SiC layer form the barriers to fission products released during fission reactions while the SiC layer acts as the main pressure vessel.
1.3 Failure Mechanism of Coated Fuel Particles
The failures of the coated fuel particles have been observed and studied [7]. The list below shows the important phenomena that cause coated fuel particles to fail.
1. Pressure vessel failure caused by internal gas pressure
2. Pyrocarbon layer cracking and/or debonding due to irradiation induced shrinkage that ultimately leads to the failure of the SiC layer
3. Fuel kernel migration (amoeba effect), which leads to interactions with the coating layers
4. Fission product/coating layer chemical interactions 5. Matrix/OPyC interaction
6. As-manufactured defects produced during fabrication of fuel particles or during pressing of fuel compacts/spheres
7. Thermal decomposition of the SiC layer at very high temperatures 8. Enhanced SiC permeability and/or SiC degradation (high burnup considerations)
9. Chemical attack
10. Reactivity insertion (accident)
1.3.1 Pressure vessel failure
Under irradiation fuel kernels continuously generate fission gases. As a result the pressure slowly builds up inside the fuel particle. In addition if the kernels are made of UO2, oxygen released from the kernels will react with pyrocarbon to form carbon
monoxide, another source of internal pressure. Usually buffer layers inside the fuel particles are designed to be thick enough to absorb these gases. However, it is possible that a very small number of fuel particles have buffer layers that are too thin or do not have buffer layer at all. Therefore quality control during the production can prevent pressure vessel failure.
1.3.2 Pyrocarbon layer cracking and/or debonding
At low fluence the pyrocarbon layers shrink in both radial and tangential
directions. As fluence reaches approximately 2 x 1025 n/m2, the pyrocarbon layers begin to swell in the radial direction but continue to shrink in the tangential direction. The shrinkage behavior of pyrocarbon helps suppress tensile stresses in the silicon carbide layers. However, too much shrinkage can exceed the tensile stresses of the pyrocarbon layers. As a result, cracks occur in pyrocarbon layers, and they can lead to very high local stress concentrations in the silicon carbide layers, causing the silicon carbide layers to fail. Pyrocarbon shrinkage can also result in the pyrocarbon layers debonding from the silicon carbide layers. At higher burnups, highly localized tensile stresses may occur in the silicon carbide layers within the area of debonding because the pyrocarbon layers are no longer there to suppress the tensile stresses.
1.3.3 Fuel kernel migration (amoeba effect)
In the presence of thermal gradients and at temperatures above 1000 °C, the fuel kernels can move up the gradients toward the inner pyrocarbon layers in UO2fuel. This
is solely due to the mass transport of carbon down the gradients. If very large thermal gradients persist, the fuel kernels will eventually penetrate the coating layers, causing the fuel particles to fail. Usually the equilibrium among carbon, uranium dioxide, and carbon monoxide keep the fuel kernels in place. However, when thermal gradients arise, carbon is prompted to migrate. Pebble bed reactors do not encounter this fuel kernel migration as frequent as prismatic reactors due to the lower power densities (hence less thermal gradients) in the pebble bed reactor cores.
1.3.4 Fission product/coating layer chemical interactions
The fission product attacks on the fuel coatings depend on temperature and temperature gradient as well as the degree of initial enrichment which determines the fission product inventory. Generally prismatic reactors encounter the fission attack problem more frequent than pebble bed reactors due to the higher power densities in prismatic fuel. The elements such as silver and palladium can migrate to the outer pyrocarbon layers and sometimes get released into the environment. Recent study suggests that silver transports through micro cracks in the pyrocarbon layers [4].
1.3.5 Matrix/OPyC interaction
The interaction between the matrix material and the outer pyrocarbon layer caused the failures in the early irradiation in the United States [7]. Intrusions from the
low viscosity graphite matrix into the pyrocarbon layers induced cracking and debonding of the outer pyrocarbon layer from the silicon carbide layer. Sharp cracks initiated at the intrusion points resulted in easy cracking. Since pyrocarbon shrinks at low neutron fluence, the strong bonding between the matrix and the outer pyrocarbon layer due to the embedded intrusions in the layer induced debonding of the outer pyrocarbon layer from the silicon carbide layer.
1.3.6 As-manufactured defects
Reportedly as-manufactured defects are the most common cause of particle abnormalities [7]. Fuel particles may be missing the entire coatings, leaving only fuel kernels. Fuel particles may also be found with heavy metal contamination (such as iron) on the outside of the silicon carbide layers. Contamination and defects contribute to an increase in fission product releases during irradiation.
1.3.7 Thermal decomposition of the SiC layer at very high temperatures
Experimental data indicates that at accident temperatures above 1600 - 1800 C, silicon carbide suffers from thermal decomposition [7]. As a result the release rate of the fission products dramatically increases at the very high temperature range. The study also shows that thermal decomposition depends on both time and temperature. As fuel is irradiated at a very high temperature for a long period of time, fission product release rate becomes much greater. However, decomposition alone may not dictate how silicon carbide behaves at very high temperatures as corrosion may also be a factor.
1.3.8 Enhanced SiC permeability and/or SiC degradation (high burnup considerations)
The degradation or enhanced permeability of silicon carbide hinders attempts to push a bumLup as high as possible. When exposed at high fluence (> 4.6 x 1025 n/m2) and
high burnup (> 14%) during the irradiation tests, pebbles emitted the extraordinary amount of fission products compared to similar pebbles underwent the less severe irradiation conditions [7]. Among the other released fission products, cesium significantly weakens the silicon carbide layers, causing the fuel particles to fail.
1.3.9 Water and air ingress (accident)
During an accident, water and air (especially oxygen) may come in contact with the fuel. A break in one of the water coolant loops would allow water to enter the
primary system. Water can expose the fuel kernels to the environment as it leaks into the fuel particles and brings out the retained fission products to the environment. Water does not dissolve much of the pyrocarbon layers at high temperatures when the accident occurs. Thus the release of the fission product is relatively modest. Oxygen, however, actively reacts with the pyrocarbon layers and exposed fuel kernels. A break in one of cooling ducts can result in an air ingress event. The resulting oxides corrode the coating layers and fission product releases take place.
1.3.10 Reactivity insertion (accident)
A coated fuel particle can withstand energy below 1000 - 2000 J/gram range. During an accident, a sudden increase in energy deposition will cause a series of events
such as overheat and overpressure that lead to a failure. Energies much higher than 1000 - 2000 J/gram range can damage the fuel kernel.
1.4 Thesis Objective
This thesis aims to study the effect of the material properties of fuel particles, particularly the Bacon anisotropy factor (BAF) and fracture toughness of silicon carbide on the failure probability of coated fuel particle fuel. Although Wang has proposed a step-by-step optimization, his results focused on optimization of particle dimensions [1]. This study keeps particles dimensionally unchanged, but focuses more on the variations of the BAF and silicon carbide's fracture toughness. The quality control during the fuel production very much affects these fuel material properties.
Chapter 2
MIT Fuel Performance Model
TIMCOAT is an advanced fuel performance model for coated particle fuel used in HTGRs [1]. It was developed by Jing Wang at the Massachusetts Institute of
Technology. The model development process involved two major modeling tasks: (1) modeling the mechanical and chemical behaviors of the fuel, and (2) modeling the
environment during fuel irradiation. The current version of the model deals only with the modeling of the mechanical behavior of the coated particle fuel. Future versions of the model will integrate the modeling of the chemical interactions to the current mechanical code.
2.1 General Description of the MIT Fuel Performance Model
TIMCOAT can model fuel performance for both types of fuel systems: prismatic blocks and moving pebbles. For a prismatic reactor core, TIMCOAT only needs time dependent histories of fuel particles as inputs. As fuel particles stay bonded together in fuel rods contained in hexagonal graphite blocks, every fuel particle in a core essentially runs through the same irradiation history. For a pebble bed reactor, the multipass fueling system adds another dimension of complexity in modeling. As fuel is recycled through the core several times before the final discharge, each subsequent pass of one pebble does not depend on the previous passes it has made through the core. A recycled pebble will be extracted from the bottom of the core and fed back in at the top of the core. Therefore
the location of the fuel pebble within a single pass is determined in a random manner based on the location of initial entry into the top of the bed.
Besides its unique feature regarding refueling scheme in pebble bed reactors, TIMCOAT departs from a traditional simple pressure vessel model to predict particle failures. Since the silicon carbide layer remains in compression at least for the early
stage of irradiation, the simple pressure vessel model will neglect the localized stresses in the silicon carbide during this period. According to the simple pressure vessel model, failure occurs only when the tensile stress in a layer exceeds the layer's facture stress. Yet, in experiments, fuel particles fail at an early irradiation period. Alternatively TIMCOAT considers the introduction of a sharp crack at the interface between the pyrocarbon and silicon carbide layers. The crack can initiate a local stress concentration factor that may lead to a locally concentrated high tensile stress even though the net section circumferential stress in the layer stays compressive.
The model in TIMCOAT first considers all of the factors resulting in deformation of a fuel particle. Such factors include irradiation-induced dimensional change,
irradiation-induced creep, thermal expansion, and internal pressure buildup from fission gases. The code then translates all of these factors into stress and strain distributions in a fuel particle. Using the stress and strain distributions as inputs, the fuel failure model in the TIMCOAT model calculates the given inputs against strengths of fuel particle layers.
It then determines whether there is a failure in the fuel particle.
A fuel particle fails whenever its SiC layer breaks. Since SiC is much stronger than PyC, it can be assumed that when the SiC layer breaks, the other two PyC layers must also break. During irradiation in a core, both PyC layers are in tension and the SiC
layer is held in compression by the shrinkage of PyC layers. Eventually when pressure due to fission gas becomes high enough, it can force the SiC layer into tension. As a result the SiC layer breaks and the particle fails.
In several cases the failure occurs at a much earlier irradiation dose. Instead of an internal pressure buildup, the SiC layer breaks due to local tensile stresses at the PyC crack tip/SiC interface. As mentioned earlier, the PyC layers are put in tension during irradiation due to shrinkage. When tensile stresses overcome PyC strengths, the PyC layers break., This initiates local tensile stresses at the PyC/SiC interface. If these local stresses exceed the fracture toughness of SiC, they will be able to crack the SiC layer open without any aid from an internal pressure.
Apart from the failure model in the TIMCOAT model, another important module in the model is to sample fuel particles and place them in a core. In reality it is
impossible to verify each individual fuel particle that all of the fabrication requirements are met. At best a manufacturer can inspect the outside dimensions of fuel particles. However, it cannot check the layer thicknesses, fuel kernel diameter, and other physical and mechanical properties of fuel particles. To do so, the manufacturer must perform a destructive inspection. Therefore, before the program does the sampling, the property distributions of fuel particles must be given as inputs. The upper and lower values of each material property must be specified in the distribution. So there exists a finite range of each material property and the triangular distribution is suitable for this.
In addition to sampling physical properties of fuel particles, the TIMCOAT model needs to sample where a pebble to be fed at the top of a core. Each pass through the core is independent of previous and subsequent passes. Therefore this process is totally
random. The model then requires realistic power and neutron flux distributions in a core. This way the model can map out the paths that each pebble takes and its power history. Since each pebble enters the core at a random place, this generates a unique power history for each individual pebble.
2.2 Execution of Modeling Program
When executed, TIMCOAT first greets a user with a welcome message. When the user clicks the "START" button the welcome window, another window will pop up and ask for an initial input file. At this point all input files must be in the same directory as the TIMCOAT program. A future version of TIMCOAT may allow the user to browse for input files. After the user enters the initial input file, the user will have three
simulation options to choose from (more details on the three types of the simulations below). After the simulation option window, the user interface returns to a more traditional MS-DOS window. Each simulation type shows a slightly different interface window. The TIMCOAT running window will close itself when calculations are
completed. TIMCOAT will place all of the output files in the same directory of the main TIMCOAT program. Again a future version of TIMCOAT may allow users to specify output directories. Figure 2-1 shows the running process of TIMCOAT.
of fuel performance model TIMCOAT [1]
NMC Outer Loop
Power Distribution in the Reactor Core
1,000,000 times
Sample a pebble/fuel particle
_ a
Randomly re-circulate the pebble
4- I A I I
L-LWI.LL 46
t=t oerdest neutron f Get power density, neutron flux
- ... .. '
T distribution in the Debble and
Accumulate fast neutron fluence .Y r j . Mechanical model N 2.2.1 Input Description
TIMC(OAT requires a general input file before a specified simulation option reads in extra input files pertaining to its modeling requirements. More details on the extra input files specific to the simulation options are described in Section 2.2.2. The example of the general input file below represents the general input file for the NPR1-A8 case [1].
MC inner loop 6 -10 times... 6 - 10 times Failure model Mechanical Chemical Stresses FP distribution Strength Pd & Ag ~ ~.~~ ... ... ~v~~~~~~--F g~ S - --- --- __ '2. I Figure 21 1, lowchart I I..
$INPUT
CORE_HEIGHT = 10.0D0, ! core height (m) CORE_RADIUS = 1.75D0, !core radius(m) P_CORE = 250.0D0, ! core power (MWth)
QPPP_AVG = 3.65186D6, ! averaged power density (W/mA3) T_IRR = 845.0D0, ! irradiation temperature (degree C)
IRRTIME = 170.0D0, !irradiation time(Day)
T_GASIN = 450.0D0, ! coolant inlet temperature (degree C) T_GASOUT = 850.0D0, ! coolant outlet temperature ( degree C)
MFHE = 118.0D0, ! helium mass flow rate (kg/s) PEBRADIUS = 3.0D-2, ! pebble radius (m)
PFZRADIUS = 2.5D-2, ! pebble fuel zone radius (m) NPEBBLE = 360000, ! number of pebbles in core NPARTICLE = 11000, ! number of particles per pebble
DT = 1.728D5, ! time step size (s)
OUTTIME = 1.728D5, ! time pebble is taken out of the core in each cycle (s) EOLBUP = 0.74D0, ! EOL bumrnup (FIMA)
EOLFLU = 2.4D0, ! EOL fluence (10^21 n/cm2) SHUFFLE = 10, ! number of fueling cycles FUELTYPE = 'UCO', ! fuel kernel type CURAT = 0.36D0, ! Carbon to Uranium ratio OURAT = 1.51D0, ! Oxygen to Uranium ratio U235ENR = 93.15D0, ! U235 enrichment (%)
U235VAR = 0.01D0, ! standard deviation on U235 enrichment (%) KERND = 10.52D0, ! kernel density (g/cm^3)
KERNDVAR = 0.01D0, ! standard deviation on kernel density (g/cm^3) KERNT = 11.03D0, ! kernel theoretical density (g/cmA3)
KERNDIA = 200.0D0, ! kernel diameter (micron)
KERNVAR = 5.2D0, ! standard deviation on kernel diameter (micron) BUFFD = 0.9577D0, ! buffer density (g/cm^3)
BUFFDVAR = 0.05D0, ! standard deviation on buffer density (g/cm^3) BUFFT = 2.25D0, ! buffer theoretical density (g/cm^3)
BUFFTHK = 102.0D0, ! buffer thickness (micron)
BUFFVAR = 10.2D0, ! standard deviation on buffer thickness (micron) IPYCBAFOI = 1.05788D0, ! IPyC as-fabricated BAF
IPYCBAFVAR = 0.00543D0, ! standard deviation on IPyC as-fabricated BAF IPYCCRATE = 1.5D0, ! IPyC coating rate (micron /min)
IPYCLC = 29.98D0, ! IPyC crystallite length (micron) IPYCD = 1.923D0, ! IPyC density (g/cm^3)
IPYCF = 24.0D0, ! IPyC characteristic strength (MPa. micronA3/modulus) IPYCM = 9.5D0, ! IPyC Weibull modulus
IPYCTHK = 53.0D0, ! IPyC thickness (micron)
IPYCVAR = 3.68D0, ! standard deviation on IPyC thickness (micron) OPYCBAFOI = 1.05154D0, ! OPyC as-fabricated BAF
OPYCBAFVAR = 0.00622D0, ! standard deviation on OPyC as-fabricated BAF OPYCCRATE = 3.0D0, ! OPyC coating rate (micron /min)
OPYCLC = 29.98D0, ! OPyC crystallite length (micron) OPYCD = 1.855D0, ! OPyC density (g/cm^3)
OPYCF = 20.0D0, ! OPyC characteristic strength (MPa.mA3/modulus) OPYCM = 9.5D0, ! OPyC Weibull modulus
OPYCTHK = 39.0D0, ! OPyC thickness (micron)
OPYCVAR = 4.01D0, ! standard deviation on OPyC thickness (micron) SICTHK = 35.0D0, ! SiC thickness (micron)
SICVAR = 3.12D0, ! standard deviation on SiC thickness (micron) SICF = 9.0D0, ! SiC characteristic strength (MPa.mA3/modulus) SICKIC = 3500.0D0, ! SiC fracture toughness (MPa. micron1^l/2) SICKVAR = 530.72D0, ! standard deviation on SiC fracture toughness SICM = 6.0D0, ! SiC Weibull modulus
PAMB = 0.10D0, ! ambient pressure (MPa)
TITLE ='Capsule NPR-1 #A8 specifications_MC sampling', ! particle description OSPEC = 'NPRI_8s', ! output file name
DEBUG = .TRUE., ! flag for debugging
ISEED = 30285171, ! initial seed for random number generator
NBURP = 10000, ! send intermediate outputs for every NBURP sampled particles NCASES = 1000000, ! number of particles to be sampled
NOMINAL = .FALSE., ! flag turning on/off Monte Carlo sampling
DIFFUSION = .FALSE., ! flag turning on/off diffusion model for gas release HISTOGRAM = .TRUE., ! flag turning on/off histogram outputs
USERSEED = .FALSE., ! flag determining whether ISEED from users is used SEND
2.2.2 Simulation Type
TIMCOAT provides three types of simulations for users: 1. Simulation in pebble bed reactor environments
2. Simulation of irradiation tests
3. Simulation under constant irradiation conditions
Each type of the simulations requires a different set of inputs (more details on the inputs are provided below). The users can also tell TIMCOAT whether or not they want some certain output files.
2.2.2.1 Simulation in pebble bed reactor environments
In this option TIMCOAT simulates a real environment in a reactor core. It models the refueling scheme for a typical pebble bed reactor. A user must provide the steady state power and fast neutron flux distributions specific to the reactor that the user wants to study. In addition TIMCOAT needs two input files to configure the reactor core: blocks.dat and channels.dat. The file "blocks.dat" specifies the axial position and fast neutron flux of each block in a reactor core. The file "channels.dat" sets the radial and axial positions of the channels in a reactor core. Table 2-2 lists the parameters in a general input file that are only specific to this simulation type. The other two simulation types do not use these parameters during modeling.
Table 2-1 The parameters specific to the pebble bed simulation option
-Parmete ' ' '' " '....' ' . : , ''- '':5, ." ' ' ,''""''. Explanat'' "' ' '". ;'. '. ::... ' '', ": ," ': " ... ','' ' '' .: ' , .': ' , , ': ." ''
~~~~~~~~~~~~~~~~~:....'':::-'' " .... .... . :. .... .. L
Pai A~~~~~~~~~~~~~~~~~~~~~ CORE_HEIGHT core height (m)
CORE_RADIUS core radius(m)
P_CORE core power (MWth)
QPPPAVG averaged power density (W/m3)
IRRTIME irradiation time(days)
T_GASIN coolant inlet temperature (°C) T_GASOUT coolant outlet temperature (°C)
MF_HE helium mass flow rate (kg/s)
PEBRADIUS pebble radius (inm)
PFZRADIUS pebble fuel zone radius (m)
NPEBBLE number of pebbles in core
NPARTICLE number of particles per pebble
DT time step size (s)
OUTTIME time pebble is taken out of the core in each cycle (s)
SHUFFLE number of fueling cycles
2.2.2.2 Simulation of irradiation tests
In this option TIMCOAT requires an irradiation history to run a simulation. TIMCOAT does not need to know a configuration nor a type of a reactor in order to run the simulation. All simulated particles will have the same irradiation history. The
example of the irradiation history below represents the irradiation history file for the NPR1-A8 case (up to 45.02203 days).
Time (days) EFFD (days) Irr. Temp. (C) Fluence (x1021n/cm2) Burnup (%FIMA)
0.00000 0.00000 882.90155 0.00000 0.00000 1.85022 1.85022 893.26425 0.00387 1.31814 3.70044 3.70044 893.26425 0.00774 2.63627 5.85903 5.85903 893.26425 0.01225 4.17409 7.70925 7.70925 889.11917 0.01612 5.49223 9.86784 9.86784 889.11917 0.02064 7.03005 11.71806 11.71806 889.11917 0.02451 8.34819 13.87665 13.87665 891.19171 0.02902 9.88601 15.72687 15.72687 895.33679 0.03289 11.20415 17.88546 17.88546 901.55440 0.03741 12.74197 20.44800 20.44800 907.77202 0.04277 14.56913 33.56800 20.44800 810.36269 0.04277 14.56913 34.22907 21.10907 872.53886 0.04413 14.96325 .35.46256 22.34256 887.04663 0.04668 15.70109 37.31278 24.19278 889.11917 0.05050 16.80784 39.16300 26.04300 884.97409 0.05433 17.91460 39.77974 26.65974 897.40933 0.05560 18.28351 41.32159 28.20159 901.55440 0.05879 19.20581 .42.55507 29.43507 907.77202 0.06134 19.94365 ,45.02203 31.90203 907.77202 0.06644 21.41932
2.2.2.3 Simulation under constant irradiation conditions
This option does not require any extra input file other than a general input file. So it becomes the simplest simulation as the general input file lays out irradiation conditions. The parameter T_IRR sets an irradiation temperature. The parameter IRRTIME tells how long an irradiation takes. The parameters EOLFLU and EOLBUP specify end-of-life fluence and end-of-end-of-life burnup, respectively. A fast neutron flux is calculated by
EOLFLU EOLBUP
and a burnup rate is given by
IRRTIME IRRTIME
2.2.3 Output Description
Users can set flag to a set of parameters in the general input file in order to control the output files TIMCOAT generates. Table 2-3 shows a list of the important output-controlling parameters in the general input file.
Table 2-2 The important output-controlling parameters in TIMCOAT
Parameter Description Flag
NOMINAL Turning on/off Monte Carlo sampling * .TRUE. * .FALSE. RUNIRR Turning on/off fuel failure evaluation * 'FAILURE'
* 'STRESS'
I DEBUG Turning on/off debugging * TRUE.
* .FALSE. HISTOGRAM Turning on/off histogram outputs * .TRUE.
TIMCOAT creates the general output file in a ".out" file. There are three sections in the general output file. The first section contains the echo of the input parameters a user entered in. The second section shows the failure details documented every NBURP particles for each layer in the fuel particles. The final section presents detailed statistics on the stresses and failures of the particles.
TIMC OAT will perform failure evaluation only if the parameter RUNIRR is set to 'FAILURE'. If RUNIRR is set to 'STRESS', it will only calculate stresses within the coating layers without applying the fuel failure model. When choosing to study fuel particle failures, users can decide whether or not they want to look at designated fuel particles with the specified physical properties given by the general input file. They also have a choice of doing fuel particle sampling with the specified distributions of the particles' physical properties. When the parameter NOMINAL is set to .TRUE.,
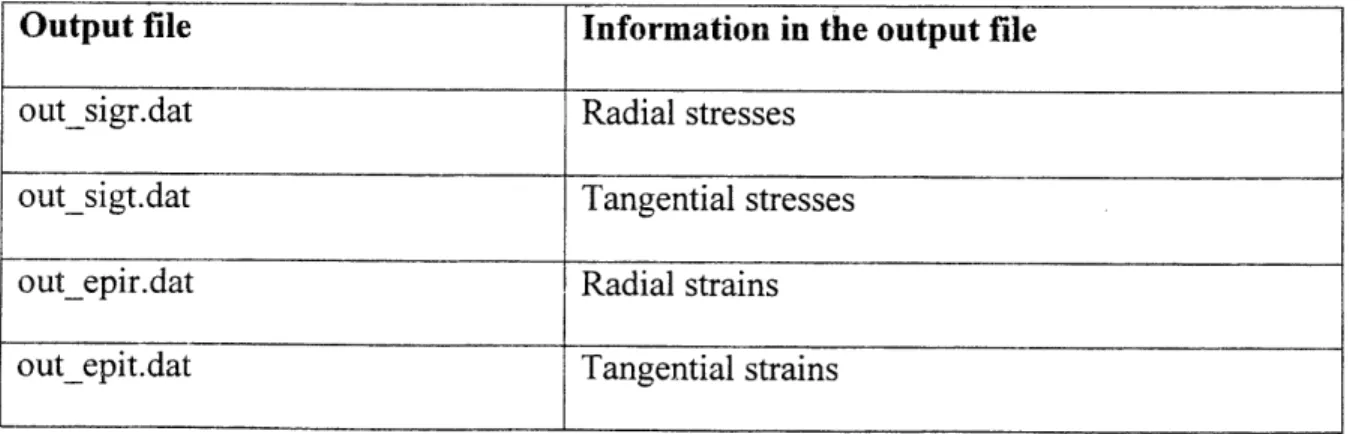
TIMCOAT will not run Monte Carlo sampling. Instead it will provide users with several output files containing useful information. Table 2-4 lists the additional output files when NOMINAL = 'TRUE'.
Table 2-3 The additional output files when NOMINAL = 'TRUE'
Output file Information in the output file
outsigr.dat Radial stresses
outsigt.dat Tangential stresses
outepir.dat Radial strains
In addition if the parameter NOMINAL is set to .TRUE. while TIMCOAT runs a simulation in pebble bed reactor environments, more extra output files are added to the list. The list of these additional output files is shown in Table 2-5.
Table 2-4 The additional output files for pebble bed reactor simulations when
NOMINAL = 'TRUE'
Output file Information in the output file out_core.dat Actual irradiation history of a particle outtemp.dat Temperature distribution in a particle test.dat Detailed passes of a pebble through a core
If TIMCOAT runs a simulation of an irradiation test with NOMINAL set to TRUE., TIMCOAT will produce a file called "irrhistory.out" in addition to the six common output files. The file "irrhistory.out", as its name suggests, contains the irradiation history of a simulated particle. However if TIMCOAT simulates constant irradiation conditions and NOMINAL is set to .TRUE., TIMCOAT will give out another output file called "captest.out" to add to the current list of the six common output files. The file "captest.out" reports the irradiation history of a simulated particle at constant
The parameters DEBUG and HISTOGRAM also introduce the other supplemental output files. If DEBUG is set to .TRUE., an output file with a ".dbg" extension will be generated. This file reveals intermediate calculations which are normally skipped in the general output file. The debug file allows user to look for errors while programming or modifying the code. When HISTOGRAM is set to .TRUE., TIMCOAT creates an output file with a ".his" extension. The file provides four failure histograms for each of the three layers and a fuel particle as a whole. Each histogram has counting bins corresponding to time, stress, fluence, and burnup. The number of bins is specified by the parameter NHIS. The data range for time goes from 0 to TIMELIMIT. Stress values range from SIG_LOWER to SIG_UPPER. Fluence and burnup has a range of 0 to EOLFLU and a range of 0 to EOLBUP, respectively. Each particle failure will be placed into a corresponding bin for if it belongs to the data range of time, stress, fluence, and burnup.
Chapter 3
Benchmarking Against the NPR Experiment Results
Benchmarking against the actual experiment results ensures the validity of TIMCOAT. The experiments on the New Production Modular High Temperature Gas Cooled Reactor (NP-MHTGR) provide the excellent data which are suitable to be
compared with the simulations from TIMCOAT. This chapter starts with the summary of the experiment program on NP-MHTGR in Section 3.1. Then Section 3.2 covers the
details of the benchmarking TIMCOAT simulations against the NP-MHTGR fuel in this study. Finally Section 3.3 provides the discussions on the benchmarking results.
3.1 Review of the NPR Irradiation Program
In the 1980's the Oak Ridge National Laboratory (ORNL) began experiments in support of the development of the New Production Modular High Temperature Gas Cooled Reactor (NP-MHTGR). The fuel prototype used in this program was similar to typical TRISO fuel particles. It consists of spherical coated particles suspended in
graphite cylinders with 12.5mm in diameter and 49.5mm in height. Nevertheless there exist the following differences between them:
* The fuel kernel of the NP-MHTGR consisting of highly enriched UCO is smaller in diameter, only about 200 micron.
* To reduce the damage during compaction of fuel particles, a low density protective PyC layer (PPyC) was added to the outer surface of OPyC layer.
* Seal coats, extra dense thin PyC layers, were added to both sides of PPyC and between the buffer and IPyC layers.
The main purpose of this experimental program was to provide fuel performance data. The fuel performance was monitored by measuring Krypton gas (Kr-85m) releases during the irradiation. The fuel performance measure was characterized by the Release-to-Birth ratio (R/B), a ratio between the measured fission gas release rate and the
calculated fission gas birth rate. An increase in the readings of the R/B ratio of Kr-85m would indicate fuel failure.
The experimental program used a special test fuel called the Performance Test Fuel (PTF). By May 1991, General Atomics and its subcontractors had manufactured the PTF, and the resulting coated particle fuel achieved the best quality ever produced in the United States [5]. The PTF consisted of three fuel capsules with a number of compacts in each capsule. The three fuel capsules were labeled NPR1, NPR2, and NPR1A. The data from the NPR1 capsule was used in the study of maximum service life conditions of temperature, burnup, and fast neutron fluence. The NPR2 capsule provided the data for the study of core average fuel temperatures. The NPR1A capsule served as a backup test capsule for Capsule NPR1. The NPR1 and NPR2 capsules were irradiated in the High Flux Isotope Reactor (HFIR) at Oak Ridge National Laboratory (ORNL). The Capsule NPR1A was irradiated in the Advanced Test Reactor (ATR) at the Idaho National Engineering and Environmental Laboratory (INEEL).
The NPR1 and NPR2 capsules shared an identical design but the NPR1A capsule had another different design. The NPR1 and NPR2 capsules each had 16 fuel compacts with H-451 graphite fuel enclosures. The fuel particle arrangement in each compact
nicely compensated for the axial cosine-shaped flux distribution in HFIR. As a result, each individual compact generated a relatively uniform heat flux. The design for the NPR1 and NPR2 capsules is shown in Figure 3-1. The NPR1A capsule contained 20 compacts of 1.7 cm in diameter. Each compact in the NPR1A capsule sat on top of another to form a stack of 122 cm long. The fuel stack was put in a graphite sleeve before inserting into a stainless steel capsule. Figure 3-2 shows the design of the NPR1A capsule. Top of capsule Compact A1 Compact A2 Compact A3 Compact A4 HFIR horizontal -- - - --midplane Compact A5 Compact A6 Compact A7 Compact A8 ... , Compact B1 Compact B2 Compact B3 Compact B4 _ _Compact B5_ Compact B6 Compact B6 Compact B7 Compact B8 Bottom of capsule
Figure 3-1 Schematic of NPR1 and NPR2 Capsules [6]
tube inlet Thermocouple leads 11 17
I is _
'9 ndi R *.I Is_ gI
N %W N 14 i1 Bl . GanI .0
Fu 4 W Fuel < NiIQ
0N i R IW fiT @i!
f gt | RAO&I b ek Insat. rMonftoI
Gas tube outl
Graphite sleeve Thermocouple leads
TC
Stainless steel
capsule-Helium-neon gas gap
0.1 in.-F-el = 3610 particles
per compact
(0132 g U-235/compact)
(Schematic not to scale)
- TOp of caps TC Lervels TC .*-.... ... ... Bottom (B) . BottomI... .f.a. - -BEottomn f capsule
Figure 3-2 Drawing of NPR1A Capsule [5]
Both the NPR1 and NPR2 capsules were irradiated for eight cycles in the HFIR. Figure 3-3 shows the cross section of the HFIR core at its horizontal mid-plane. The NPR1 capsule was irradiated at the positions VXF-5 for three cycles, RB-7A for four
cycles, and RB-7B for one cycle. The dotted arrow in Figure 3-3 indicates the irradiation path for the NPR1 capsule. The NPR2 capsule was irradiated at the positions VXF-18 for three cycles and RB-3A for five cycles. The solid arrow in Figure 3-3 depicts the
irradiation path of the NPR2 capsule. Placing the capsules in the VXF positions resulted in a higher burnup than placing them in the RA and RB positions. The RA and RB positions were closer to the core, so the capsules at these positions experienced relatively high fast neutron flux but low thermal neutron flux. The capsules in the VXF positions were far from the reactor core and encountered relatively more thermal neutron flux.
PN TA VABLE kCILITY kL Y SMALL REMOVABLE K < BERYLLIUM . FACILITY
INNER FUEL ELEMENT -OUTER FUEL ELEMENT
/CONTROL
REGION -- /
CONTROL REGION
-Figure 3-3 Cross section view of the HFIR core at the
INCHES
horizontal midplane [6]
The irradiation of the NPR1 capsule happened between July 25, 1991 and May 29, 1992. During the first 120 full power days, no fuel particle failure occurred as the
Kr-85 R/B ratio stayed low at 1.0x 1 0-8. However, on January 2, 1992, the first failure had been detected as the Kr-85m R/B ratio jumped to 1.7x 10- 7 at a 1.7x 10²¹-peak fluence.
The Kr-85m R/B ratio kept rising until it tailed off at 1.0x 10⁻⁴. The number of particle
failures could be approximated as (1.0x10- 4- 1.0x10⁻⁸) / (1.7x10
- 1.0x10⁻⁸) = 625. The activity spikes recorded by the ionization chambers indicated that 526 fuel particles failed.
The irradiation of the NPR2 capsule took place between August 1991 and May 29, 1992. On February 11, 1992, the first fuel particle failure was registered as the Kr-85 R/B ratio rose to 7.0x10⁻⁷at a peak fluence of 1.7x10²¹ neutrons/cm2. The R/B ratio
continued to increase until it reached the final value of 2.Ox 10- 5. The approximated number of fuel particle failure was 135.
The irradiation of the NRR1A capsule started on October 2, 1991 and ended earlier than scheduled due to the unexpectedly high failure rate. The irradiation was terminated after 64.2 full power days. The particle fuel first failed on December 12, 1991 when the Kr-85 R/B ratio increased from 5x 10⁻⁹to 3.8x 10⁻⁷ after 42 full power days.
Upon the termination of the NPR1A irradiation, the Kr-85m R/B ratio increased to 1.79x 10- 5. The number of fuel particle failures was approximately equal to (1.79x 10 -5x 10-9) / (3.8xlO- 7- 5x 10⁻⁹) = 48.
3.2 Benchmarking in This Optimization Study
Before applying TIMCOAT in the optimization study, TIMCOAT itself must be validated. Although Wang has already presented the benchmarking against the
modifications in its material database. This thesis presents the re-benchmarking against the very same set of the NPR1 experimental data that Wang used. This will further ensure that the current version of TIMCOAT is legitimate to model fuel performance.
To predict the particle failures for the NPR1 compact, the TIMCOAT simulations under Option 2 (simulations for irradiation tests) were run. Alternatively, Option 3: Simulation under constant irradiation conditions could also be used. However, the predict results would not reflect the actual irradiation histories for the NPR1 capsule. The NPR1 capsule contained 16 compacts labeled Al to A8 and B1 to B9 (refer to Figure
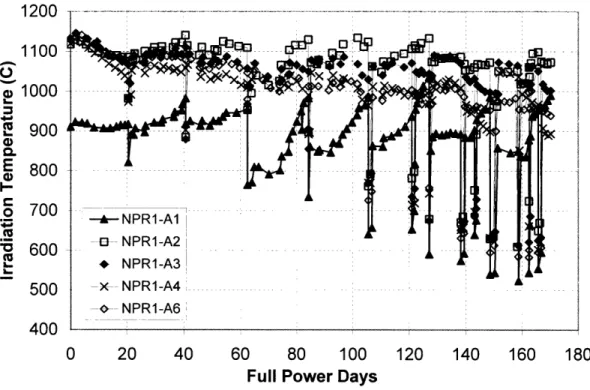
3-1). Each of these compacts was loaded with essentially the same quality of fuel particles. Based on the compact arrangement in the capsule, the compacts Al and B1 stayed at the same level and opposite of each other, so they undergo the same irradiation conditions as well as the rest of the pairs A2-B2, A3-B3 and so on. Therefore it suffices to model only the eight compacts Al to A8 as the failure results should be very similar for the compact group B 1 to B8. Figures 3-4A and 3-4B show the irradiation histories for the NPR1 compacts.
The NPR1 benchmarking comprises of eight simulations, one for each A compact. It requires eight general input files and eight irradiation history files. The general input and irradiation history files are included in Appendixes A and B respectively. The various input parameters are shown in Tables 3-1 and 3-2.
1200 1100 2 1000 E 900 Q0 E 800 I--o 700 ._ 'o 600 L. 500 400 0 20 40 60 80 100 120 140 160 180
Full Power Days
Figure 3-4A Irradiation temperature histories for selected NPR1 compacts
.4 "1nr I /UU 1100
j
- e1000 X 900 E 800 -o 700 4._ O 600 500 400 0 20 40 60 80 100Full Power Days
120 140 160 180
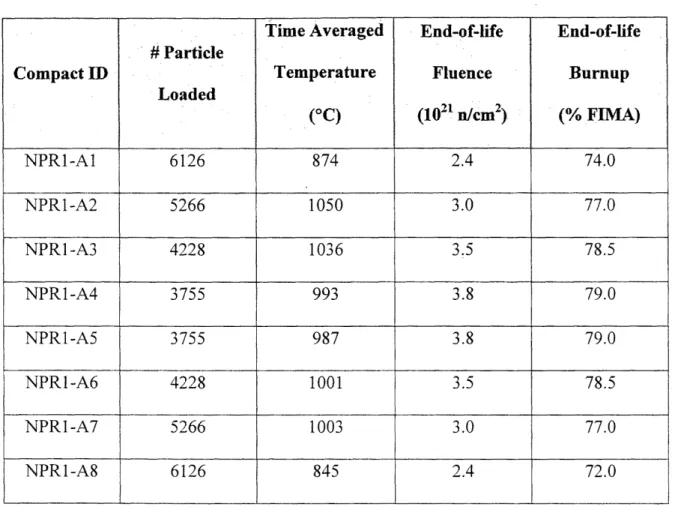
Table 3-1 Properties of each compact in the NPR1 capsule
Time Averaged End-of-life End-of-life
# Particle
Compact ID Temperature Fluence Burnup
Loaded (°C) (102 n/cm2) (% FIMA) NPR-Al 6126 874 2.4 74.0 NPR -A2 5266 1050 3.0 77.0 NPR -A3 4228 1036 3.5 78.5 NPR1-A4 3755 993 3.8 79.0 NPR -A5 3755 987 3.8 79.0 NPR-A6 4228 1001 3.5 78.5 NPR -A7 5266 1003 3.0 77.0 NPR1-A8 6126 845 2.4 72.0 _ ~ ~. . .
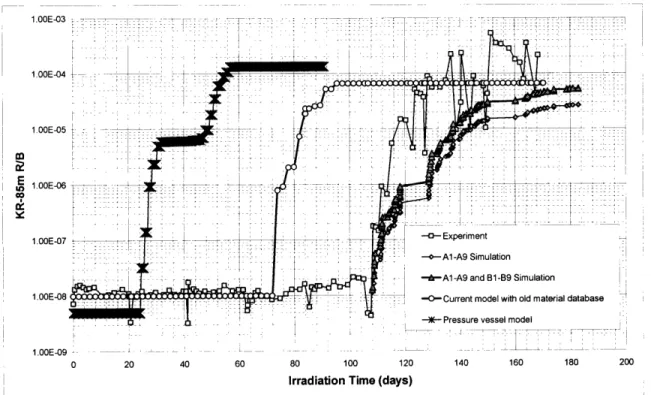
As mentioned earlier, the Kr-85m R/B ratio is an indicator of the particle failure in the NPR1 capsule experiment. TIMCOAT provides the results from the particle failure
modeling in term of probability. Equation 3-2 converts the resulting probabilities into the Kr-85m R/B values.
Nfailure = NiPi
Kr-85m R/B = Nfailure x R/Bone failure + R/Bbackground
(3-1)
(3-2) where
Nfailure
Ni
= the number of fuel particle that failed
R/Bonefailure = the release of Kr-85m for one particle failure (1.7 x 10⁻⁷ for NPR1)
R/Bbackground = the background radiation (1.0 x 10⁻⁸ for NPR1)
Table 3-2 Input parameters for the NPR1 simulation
Para :meter .. ... .':..
Fuel Type
C:U Ratio, O:U Ratio Ambient Pressure (MPa) U235 Enrichment (%) Kernel Diameter (m) Buffer Thickness (m) IPyC Thickness (m) SiC Thickness (pm) OPyC Thickness (pm) Kernel Density (g/cm3) Buffer Density (g/cm3) IPyC Density (g/cm3) OPyC Density (g/cm3) IPyC BAFo OPyC BAFo IPyC ca0 (MPa.m3/p ) :?. e ".,i Valu?.:°::ieZ.. !t UCO 0.36, 1.51 0.1 93.15 200 102 53 35 39 10.51 0.96 1.923 1.855 1.05788 1.05154 23.6*
Stanard iti":
:
''' ~'4c .4'' ' ~~~~:oy~~. ''.i.~~, ~i]~~~ ~..~ei!..
... .... .. ... .... .... .. .. ... . 0.01 5.2 10.2 3.68 3.12 4.01 0.01 0.05 0.00543 0.00622 9.5 () Distribution Type Triangular Triangular Triangular Triangular Triangular Triangular Triangular Triangular Triangular Triangular Weibull
Figure 3-5 shows the comparison between the failure prediction made by TIMCOAT and the actual experiment results. The failure prediction nicely represents the lower bound of the actual experiment results. This is expected because the current version of TIMCOAT has not yet incorporated chemical modeling. Future version of TIMCOAT with the fully integrated mechanical and chemical models should yield a much better failure prediction.
1.OOE-03 : . - . . , 1.00E-04 . ... 0 2 '0 40 60 80 : 1 00 12 0 10 10 18 20 0 i0 ;: : :: i f
a-i:
-:
:-:i~' i#^0 V0 E 1.00E-056 ;L = X0't-'; ti-C z,, _;0;-X Dkit
0 : iilc;
r -[
Fige -0o - T :| c r
twi
t act e Experimentsimuatio: of : - : the : NPR cal--A9Simulation.
460E 0 -< < ^ A-A9andEl-B9Simula
: D 0 . . : . . . Pressure vessel model
L _ . t!7 L
tD,
.:r -: , - , , TT
.,z7T7 T 71.00E-09 - : ' L ! ;::: _ _ _
0 20 40 60 80 100 120 140 160 180 200
Irradiation Time (days) ,.
Figure 3-5 The comparison between the actual experiment data and TIMCOAT
3.3 Summary
Re-benchmarking the predicted failure results against the actual experiment results confirms the validity of the current version of TIMCOAT in predicting fuel performance. Users should feel confident in running TIMCOAT to study performance of coated particle fuel under irradiation. Results from simulations can aid the users to envision how fuel particles behave during irradiation. Further improvement of
TIMCOAT includes fully integrated chemical modeling and thus promises much more accurate failure predictions.
Chapter 4
Optimization of Fuel Particles using the TIMCOAT Model
Fuel particle optimization means seeking a set of material parameters for fuel particles to minimize the failure probability. As mentioned earlier, overpressure rupture
of the SiC layer and cracking of PyC cause the failure in a fuel particle. Thus the failure probability in a fuel particle can be reduced by minimizing the internal pressure within a fuel particle and minimizing the cracking probability in the PyC layers. Design criteria can be set such that (1) the maximum stresses in the PyC layers are minimized, (2) the strengths in the PyC layers increase, and (3) the SiC layer remains compressive at all times.
4.1 General Comments
Many approaches can be taken in optimizing the fuel performance. While this thesis offers another approach based solely on two important material properties, namely the anisotropy of the pyrolytic carbon layers and fracture toughness of the silicon carbide layer, Wang chooses the optimization procedure based on the parametric study [1]. Table 4-1 shows the results of his study on the relationship between the material parameters and stresses that cause failure. Most of the input parameters in the table are material
properties. However, one parameter called BAF0 (zero subscript denoting initial) deserves some attention.
The Bacon Anisotropy Factor (BAF) measures the degree of anisotropy in graphite (the pyrocarbon layers). Naturally carbon layers in the crystallites tend to lie
parallel to the deposition plane. Anisotropy develops as a majority of the crystallites deposit in the same orientation. Thus, a high degree of preferred orientation of a deposit is associated with a high degree of anisotropy. As a result, the carbon deposit, as an aggregate, is isotropic in average. This is due to random orientations of individual crystallites in bulk graphite. A typical BAF value for the pyrocarbon layers ranges from
near 1.0 (isotropic) to slightly above 1.1 (anisotropic). The production limit on the BAF ranges from 1.00 to 1.30 as seen from Table 4-1.
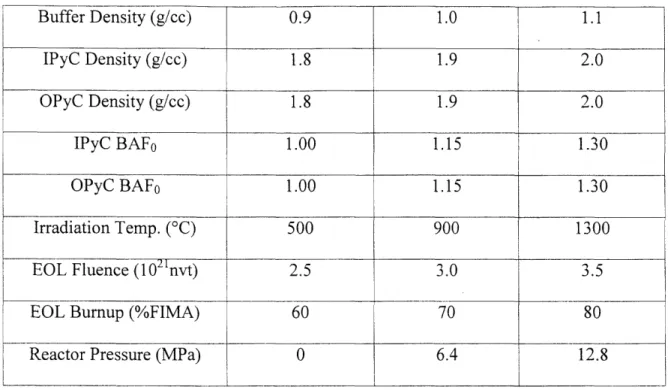
Table 4-2 shows how stresses change with the material parameters. In order to design a parameter configuration for a fuel particle, the relationship between stresses in different layers must be known. At a first glance, the study suggests that the SiC layer thickness must be kept as thin as possible while the outer PyC layer thickness must remain as thick as possible. Based on the data in Table 4-1, the SiC and outer PyC layer thicknesses must be set at 20 tm and 80 tm respectively.
Table 4-1 The ranges of the design inputs in current manufacture.
Parameter Low Nominal High
Kernel Dia. (m) 100 400 700 Buffer Thickness (m) 40 120 200 IPyC Thickness (m) 20 40 60 SiC Thickness (m) 20 40 60 OPyC Thickness (m) 20 50 80 U235 Enrichment (%) 4 93 96 Kernel Density (g/cc) 10.4 10.5 10.6
Buffer Density (g/cc)
Table 4-2 Stress changing direction as parametric values increase
IParameter | Max IPyC Stress Min SiC Stress Max OPyC Stress
Irradiation
T (C)
+
- -_+
+
SiC Thickness (pm) + + + IPyC Thickness (pm) + + OPyC Thickness (m) Kernel Diameter (m) + + Buffer Thickness (m) + + IPyC BAFo + OPyC BAFo + IPyC Density (g/cm3) + + -OPyC Density (g/cm3) + IPyC Density (g/cc) OPyC Density (g/cc) IPyC BAFo OPyC BAFo Irradiation Temp. (C) EOL Fluence (102'nvt) EOL Burnup (%FIMA) Reactor Pressure (MPa)1.8 1.8 1.00 1.00 500 2.5 60 0 1.9 1.9 1.15 1.15 900 3.0 70 6.4 2.0 ?.O 1.30 131 0 1300 3.5 80 12.8 0.9 1.0 1.1
(+ = increase - = decrease + - = increase then decrease - + = decrease then increase)
Wang proposed the following optimization procedure:
1. Specify irradiation temperature for a given environment. If there is flexibility in the operating temperature limit, it is desirable to go for a higher temperature from mechanical fuel performance viewpoint. Higher temperature helps materials relax and results in lower stresses.
2. Minimize SiC Thickness and maximize OPyC Thickness. This is based on the parametric study (see Table 4-2).
3. Minimize IPyC Thickness and maximize Kernel Diameter, and keep end-of-irradiation stress in SiC non-positive at the same time. Generally stresses in the inner PyC layer are higher than stresses in the outer PyC layer. So the inner PyC layer is more liable to failure.
4. Scan Buffer Thickness for the minimum of maximum IPyC stress, and again keep end-of-irradiation stress in SiC non-positive. There is a strong dependency
between the kernel diameter and the buffer layer thickness. Since the kernel diameter has been set in Step 3, the buffer layer thickness must be scanned in the whole range.
5. Increase IPyC BAF0from its lower bound for maximum gap between IPyC
strength and maximum IPyC stress, and then choose IPyC Density according to BAF(-Density correlation. The idea behind this is that the inner PyC layer is less
likely to fail when the gap between its strength and stress is widened. Repeat Step 5 for OPyC layer.
4.2 Optimization Based on Bacon Anisotropy Factor of Pyrocarbon
The BAF affects certain properties of the pyrocarbon layers. The strengths of the PyC layers increase with BAF, but high BAF will also accelerate shrinkage of the PyC layers, the cause of local tensile stresses in the layers. For this last reason, most people prefer a low BAF in the PyC layers. In this thesis the BAF is varied from 1.02 to 1.20 for all cases of the modular pebble bed reactors. There are two reactor designs: Old Design (MPBR1) and New Design (MPBR2), and two fuel designs: As Designed (DS) and As Fabricated (MS). Therefore four cases are available, designated as MS MPBR1, DS MPBR1, MS MPBR2, and DS MPBR2. Tables 4-3 and 4-4 show the input parameters for the reactor and fuel designs. The MPBR2 design is larger and capable of generating more power than the MPBR1 design. As a result, their power histories are different. The power histories of a typical fuel particle are illustrated in Figure 4-1. If the modelsamples one million particle cases, there will be one million power histories. Each fuel particle (if not failed) is recycled ten times in MPBR1 and six times in MPBR2 and the corresponding irradiation time are around 750 days in MPBR1 and 1000 days in MPBR2.
Given that MPBR2 generates more power than MPBR1, a particle will experience higher neutron fluence in MPBR2 core than in MPBR1 core. Roughly the end-of-life fluence in MPBR1 and MPBR2 are 1.9x 10²¹ neutrons/cm2 and 2.8x 10²¹ neutrons/cm2, respectively. Figure 4-2 shows the fast neutron fluence of a nominal LEU-TRISO particle in MPBRs.
Table 4-3 Specifications of VSOP Modeled MPBR Cores
Parameter MPBR1 MPBR2
Core Height (m) 10.0 11.0
Core Radius (m) 1.75 1.85
Thermal Power (MW) 250 400
Coolant Helium Helium
Core Inlet Temperature (C) 450 500
Core Outlet Temperature (C) 850 900
Average Power Density (MW/m3) 3.652 4.777
Max. Power Peaking Factor 5.27 2.74
Min. Power Peaking Factor 4.44E-5 2.70E-5
Coolant Mass Flow Rate (kg/s) 118.0 154.6
No. Pebbles in Core 360,000 451,600
No. Particles per Pebble 11,000 15,000
Pebble Cycling Times 10 6
No. VSOP Blocks 57 93
No. VSOP Batches per Block 11 (10 effective*) 7 (6 effective*)
Pebble Fuel Zone Radius (mm) 25.0 25.0
Pebble Radius (mm) 30.0 30.0

![Figure 3-1 Schematic of NPR1 and NPR2 Capsules [6]](https://thumb-eu.123doks.com/thumbv2/123doknet/14688800.560827/38.918.259.658.401.1004/figure-schematic-npr-npr-capsules.webp)
![Figure 3-2 Drawing of NPR1A Capsule [5]](https://thumb-eu.123doks.com/thumbv2/123doknet/14688800.560827/39.918.234.707.126.832/figure-drawing-of-npr-a-capsule.webp)