HAL Id: hal-01869264
https://hal.archives-ouvertes.fr/hal-01869264
Submitted on 6 Sep 2018
HAL is a multi-disciplinary open access
archive for the deposit and dissemination of
sci-entific research documents, whether they are
pub-lished or not. The documents may come from
teaching and research institutions in France or
abroad, or from public or private research centers.
L’archive ouverte pluridisciplinaire HAL, est
destinée au dépôt et à la diffusion de documents
scientifiques de niveau recherche, publiés ou non,
émanant des établissements d’enseignement et de
recherche français ou étrangers, des laboratoires
publics ou privés.
a hybrid image-based and synthetic geometric model
Clara Jaquet, Laurent Najman, Hugues Talbot, Leo Grady, Michiel Schaap,
Buzzy Spain, Hyun Kim, Irene Vignon-Clementel, Charles Taylor
To cite this version:
Clara Jaquet, Laurent Najman, Hugues Talbot, Leo Grady, Michiel Schaap, et al.. Generation of
patient-specific cardiac vascular networks: a hybrid image-based and synthetic geometric model. IEEE
Transactions on Biomedical Engineering, Institute of Electrical and Electronics Engineers, 2019, 66
(4), pp.946-955. �10.1109/TBME.2018.2865667�. �hal-01869264�
Generation of patient-specific cardiac vascular
networks: a hybrid image-based and synthetic
geometric model
Clara Jaquet*, Laurent Najman*, Hugues Talbot*, Leo Grady**, Michiel Schaap**, Buzzy Spain**, Hyun Jin
Kim**, Irene Vignon-Clementel***, Charles A. Taylor**
1
*ESIEE, Universit´e Paris Est, **HeartFlow Inc., ***Inria & Sorbonne Universit´e
Abstract—Objective: In this paper, we propose an algorithm for the generation of a patient-specific cardiac vascular network starting from segmented epicardial vessels down to the arterioles. Method: We extend a tree generation method based on satis-faction of functional principles, named Constrained Constructive Optimization (CCO), to account for multiple, competing vascular trees. The algorithm simulates angiogenesis under vascular vol-ume minimization with flow-related and geometrical constraints adapting the simultaneous tree growths to patient priors. The generated trees fill the entire left ventricle myocardium up to the arterioles.
Results: From actual vascular tree models segmented from CT images, we generated networks with 6000 terminal segments for 6 patients. These networks contain between 33 and 62 synthetic trees. All vascular models match morphometry properties previ-ously described.
Conclusion and significance: Image-based models derived from CT angiography are being used clinically to simulate blood flow in the coronary arteries of individual patients to aid in the diagnosis of disease and planning treatments. However, image resolution limits vessel segmentation to larger epicardial arteries. The generated model can be used to simulate blood flow and derived quantities from the aorta into the myocardium. This is an important step for diagnosis and treatment planning of coronary artery disease.
Index Terms—Arterial morphometry, Constrained Construc-tive Optimization, Coronary arteries, Patient-specific modeling.
I. INTRODUCTION
I
N the last two decades, advances in the medical imaging field have enabled detailed in vivo studies of the human coronary arteries in health and disease [1]. However the res-olution limitations of available noninvasive medical imaging devices (CT, MRI, etc) have prevented the detection of vessels below the epicardial level. At present only ex-vivo acquisition protocols such as using cryomicrotomes have made it possible to segment the microvasculature [6], a procedure that cannot be applied on a living human heart. Consequently computer generated vascular models have been proposed to simulate and study the flow distribution down to the microvasculature level.Copyright (c) 2017 IEEE. Personal use of this material is permitted. However, permission to use this material for any other purposes must be obtained from the IEEE by sending an email to pubs-permissions@ieee.org. Corresponding author : Clara Jaquet (clara.jaquet@esiee.fr). This research work was supported by HeartFlow Inc. An abstract version of this work was reported in [8].
Many generated models are derived from anatomical data. They use the Strahler ordering and connectivity matrix defined by Kassab et al. from porcine hearts [14]. Vascular trees were first generated in 2D, involving only length and diameter by Mittal et al. [17]. Kaimovitz et al [9] adapted vascular net-works to the 3D ventricle geometry, with simulated annealing and additional heart mapping strategies. Smith et al. proposed an extension of a segmented epicardial network, from a canine epicardial dataset [22]. These models are composed respectively of one, two, and several generated trees.
Other vessel tree generation methods aim to satisfy func-tional principles. They all share the assumption that flow is evenly distributed into the perfused volume. The global optimization method introduced by Georg et al. in 2010 [5] defines random points in the perfused volume and generate the intermediate vasculature that minimizes the total vascular volume. The optimization produces suboptimal global struc-tures, and goes on until all random points are connected. Another tree generation approach was presented, by Tawhai et al. [23] and validated for bronchial airway models. This approach uses a Monte Carlo recursive algorithm, which constrains bifurcation angles and segment lengths. The single tree generation methods [5] and [23] have been validated only for convex shape territories and do not rely on fluid dynamic laws. In contrast, the Constraint Constructive Optimization (CCO) method proposed by Schreiner et al. [19] relies on hemodynamic principles, and was adapted to the concave shape of the left ventricle [20]. The CCO method consists of a single tree angiogenesis simulation governed by minimizing a target function: the total tree volume. CCO was recently extended to work on neural trees at the surface of the heart by Ulysses et al. [24]. Another recent method has been proposed by Keelan et al. [15], that also handles non convex territory for vascular networks. It minimizes pumping power and blood volume with a simulated annealing approach to generate left and right coronary models. This method is convenient for generating a whole vasculature, but uses no prior information on the epicardial network that can be extracted from cardiac CT.
Methods derived from anatomical data are based on animal studies and not human data, thus we cannot ensure they are representative of patient morphometry. In addition, with the aim of deriving a functional analysis from the generated vascular network, it seems more coherent to rely on functional
principles for its construction. To generate a patient-specific model we must use all available priors, in particular the segmented epicardial arteries. Extension of this image based model requires a multi-tree network generation method.
In this paper, we extend the CCO method to account for multiple, competing vascular trees, emerging from actual vascular tree models segmented from CT images. The gener-ated trees fill the entire left ventricle myocardium up to the arterioles. We demonstrate this method by generating networks with 6000 terminal segments for 6 patients and analyze the resulting trees by comparing morphometry properties to those previously described in the literature.
II. METHODS
A. Assumptions
Here we describe the assumptions and parameters we used to build our vascular trees. The tree is constituted of cylindrical segments. It begins with a root segment, and all downstream end segments are called terminal segments. The produced tree is binary and its total number of segments is calculated from the number of terminal segments nterm:
ntot= 2nterm− 1 (1) The terminal segments correspond to arteriole level, feeding a modeled micro-vasculature. The whole tree and non-modeled micro-vasculature are embedded into a determined volume referred to as the perfusion territory.
The blood is modeled as an incompressible, homogeneous Newtonian fluid, under a steady state. It is approximated as fully developed, unidirectional, axisymmetric flow in cylindri-cal geometry under laminar flow conditions. The resistance R and the pressure drop∆p of a segment j are defined according to Poiseuille’s solution by:
Rj= 8µ π lj r4 j (2) ∆pj = Rjqj (3) with µ the viscosity, and l, r, q respectively the segment length, radius and flow. The total resistance of the tree is calculated recursively by tree decomposition into segments, considering parallel and serial arrangements. The flows at all terminal segmentsqtermare equal, and delivered into the micro-circulation. Because of flow conservation, the sum of theqterm corresponds to the perfusion flow at the root qperf.
The tree is subjected to Murray’s law [18], with a power law coefficient γ set to 3.
r0γ= r γ 1+ r
γ
2 (4)
The law is derived from ideal conditions, and in reality theγ observed in coronaries varies between 2 for large vessels and 3 for small ones [25],[27],[13],[16], [26]. Since we generate vessels below the CT resolution of the segmented network, we use a value of 3, corresponding to a range from small arteries down to arterioles.
B. CCO algorithm
The CCO algorithm combines computational fluid dynamics laws, network geometry and topology optimization to simulate vascular network growth. Below we summarize the algorithm proposed by Schreiner [20] which is the basis of our method. 1) Tree growth: In Schreiner’s method the tree is con-strained into a growing perfusion territory, and the target function minimizes the total tree volume, which is calculated considering the segments cylindrical shape:
tv= π ntot X j=1 ljr2 j (5)
Knowing the final volume of perfusion territory vperf the micro-circulatory black box volume µbox [19], i.e. average perfusion territory of each terminal segment, is defined:
µbox= vperf/nterm (6) Before each new added segment, the current perfusion territory volume vk is incremented by µbox to simulate tissue growth concomitant with vascular growth. All segments are stretched correspondingly to this volume inflation.
Segments are added one by one and subject to both local optimization (at the single bifurcation scale) and global op-timization (at the tree scale), as detailed below. A random location, new loc, is picked under geometrical and physi-ological constraints to be used as a candidate for segment extremity. Its connection is tested with neighboring segments: the two points defining the neighboring segment andnew loc are joined at a bifurcation point. Each connection is subject to a local optimization: the bifurcation point location minimizes the bifurcation volume under the constraints of determinant flow, following Kamiya’s work [11]. Since the segment joining the bifurcation point tonew loc is a terminal segment, by defi-nition it carries a flowqterm. After adding the new bifurcation, the tree flow is incremented by qterm and the hydrodynamic resistance of the tree must be adjusted by recursively traversing all subtrees, and propagating a radius rescale up the tree. The optimal connection is then selected among all connections as the one minimizing the target function (total tree volumet), to achieve the global optimization process.
2) Territory specificity: In the original CCO method [19] the perfused volume is assumed convex and homogeneously filled. In a subsequent article [20], Schreiner et al. adapt the growth specifically to the left ventricle wall shape, which is a non-convex territory, and induce a perfusion gradient.
To achieve adaptation to a non-convex territory, they define a function similar to an electrical potential to represent a non convex domain between two isosurfaces [20]. Ranging from 0, the outer surface, to 1, the inner surface of the ventricle wall, the function w(~x), provides a continuous and differentiable interpolation of the domain. Schreiner uses this spatial information during tree growth to confine the generated bifurcations inside the perfusion domain. In addition, the per-fusion density can vary according to this potential: the density of arterioles follows an increasing gradient from epicardium to endocardium. We compute the domain function w(~x) with
a discrete Poisson solver called the random walker algorithm [7].
To reproduce the vessel distribution wrapping the ventricle surface before penetrating the myocardium layers, Schreiner uses the principle of staged growth defined by Karch [12]. The first segments generated are constrained to a hypersurface corresponding to the epicardial layer. Then, in a second stage, the vascular growth is extended inside the myocardial volume of the whole left ventricle, called hereafter the ventricular vol-ume. During this second stage, the target function is weighted with the domain function w:
tv,s= π ntot
X s=1
lsr2sw( ~ms) (7)
withms~ the segment midpoint. In addition, to model a higher arteriole density in the endocardium layer as observed by Buss [2], the new terminal segment locations are subject to a distribution test. This test ensures that the density of accepted points increases closer to the endocardium layer. As in [20], we use a factor of 3 between epicardium and endocardium.
C. CCO Forest: Extension of CCO to multiple trees
To produce a patient specific vascular network, we aim at extending the downstream vasculature of a segmented model holding multiple epicardial coronaries. Hence the method is required to generate several vascular trees inside the same territory. In order to generalize the angiogenesis to multiple trees, such as in a physiological process, these trees should grow in a simultaneous manner. This contemporaneous growth intrinsically induces competition between trees.
Here we propose an innovative method enabling growth of several competing trees within the same perfusion territory. We call the association of F trees inside a single perfusion territory a forest. We seek to minimize its total volume defined by: Tv = F X i=1 tiv (8)
The forest growth is built following principles similar to CCO: segments are added one by one to the forest, and territory growth is concomitant to tree growth. These trees grow in a competitive process depending on their relative inlet flow. From here on, variables relative to a forest start with a capital letter, and those relative to single trees start with a lowercase letter.
1) Forest initialization: First, we define the forest param-eters. Vperf and Nterm are respectively the perfusion territory volume and the total number of terminal segments that the forest needs to reach. During forest growth we calculateKterm, the total number of terminal segments belonging to all the trees, and we end growth when it is equal toNterm. Each tree is initialized with a root radius rroot, and a target inlet flow qtarg that the tree has to reach at the end of the forest growth. We can calculate the total forest flow Qperf that has to be reached at the end of the forest growth, and considering an
homogeneous distribution, the flow at each terminal segment of the forestQterm is estimated:
Qperf = F X i=1 qtargi (9) Qterm= Qperf/Nterm (10) In a similar fashion as CCO algorithm, the micro-circulatory black boxvolume is calculated with:
VM box= Vperf/Nterm (11)
As in the CCO algorithm, each tree is initialized with a random first segment, the root segment. The positioning of the root segment can be critical to promote tree growth, particularly so for close neighbors. We constrain the maximum root segment length to be proportional to the flow ratio between the tree and its closest neighbor. The maximum length criterionli
max for each root segment is: limax= dicn qitarg qcn targ+ qtargi (12) In this formula,di
cnis the distance to the closest neighbor tree, qi
targ is the target flow of the considered tree, and qcntarg is the target flow of its closest neighbor. With this constraint, tree roots cannot block the future territory of their neighbors.
2) Forest growth: When growing several trees in the same territory, a competition takes place. In order to obtain a coherent distribution, we influence this competitive process with relative tree flow.
For each tree we know the target flowqtargthat the tree has to reach at the end of forest growth, and the flow at each step of the forest growthqKterm. We identify the largest flowq
b targ carried by the tree of indexb.
During growth, each tree growth speed depends on its relative flow, meaning its flow relative to the largest tree flow. Trees are not allowed to grow when their current relative flow does not correspond to the final forest flow distribution. After each added segment, for all trees i we calculate the relative flow at stepKterm:
χiKterm= q
i Kterm/q
b
Kterm (13)
and compare it with the target relative flow: χi
targ= qtargi /qtargb (14) If χi
targ > χiKterm, the tree is ”activated”, meaning it can
get new connections. Otherwise, its growth is temporarily suspended. An exception is made for the largest flow tree, which is only constrained by its target flowqb
targ.
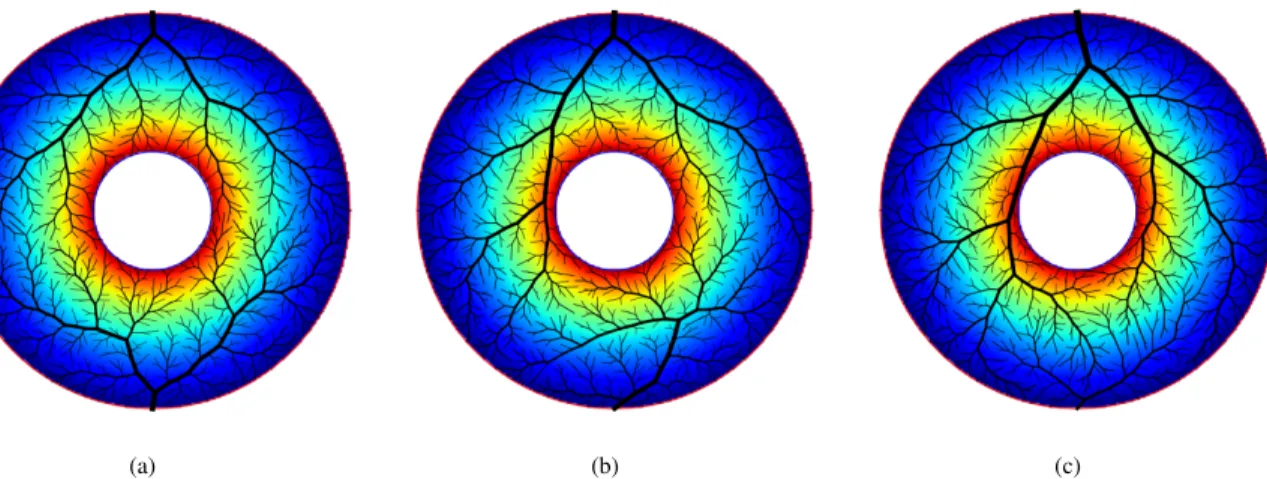
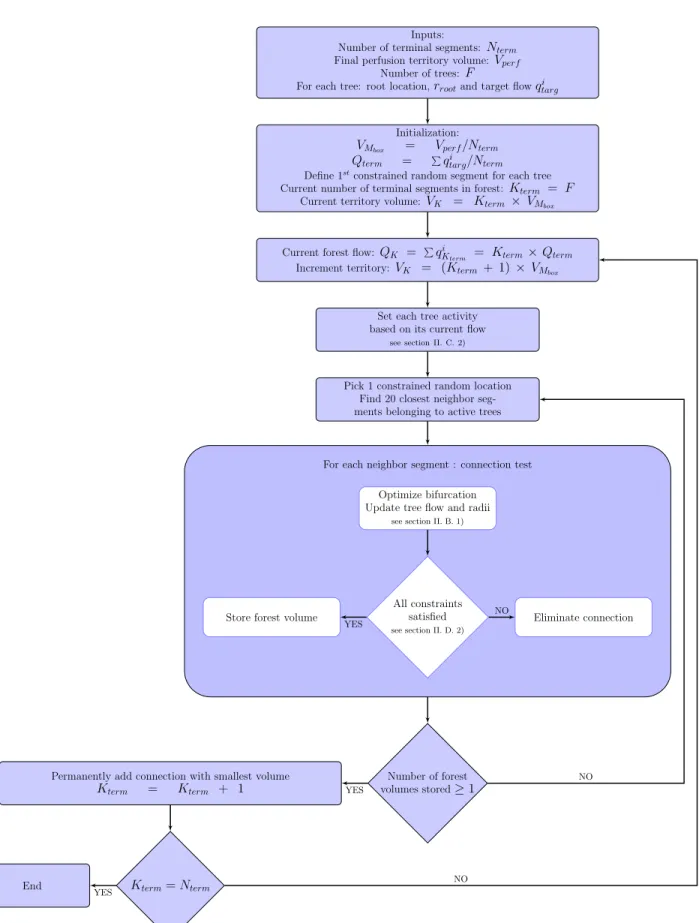
The method is described in the flow chart Fig. 2. As a proof of concept we computed this multiple speed growth for 2 trees within a 2D, non-convex, simple geometry territory, see Fig. 1. Physiological parameters used were in a similar range as Schreiner ’s et al [19].
These simulations correspond to 3 different flow distribu-tions, which are tested with 3 different random seeds. The average attained flows over the 3 different random seeds are
(a) (b) (c)
Fig. 1: Example of forest growth proof of concept in simulated 2-D non convex territories, with varying flows. (a) : equal target flow. (b): upper tree flow twice the bottom tree flow. (c): upper tree flow 9 times the bottom tree flow. The colormap represents the potential function from 0 (blue) to 1 (red).
presented in table I. Also, in this table we present an estimation of tree perfusion territory calculated from a discrete Voronoi tessellation, also known as skeleton by influence zone [21], using terminal segment locations as markers. With this method we observe an average relative error of 2× 10⁻³between target and attained flow for all trees. The area of the per-fused territory is proportional to tree flow with a correlation coefficient of 0.991.
This simultaneous tree growth method works for two or more competing trees, which is an important improvement with respect to the original CCO technique. In particular it can be used to extend the segmented coronary model, as we discuss in the next section.
D. CCO forest adapted to patient data
The primary goal of the proposed methods to create hybrid image-based and synthetic geometric trees is to extend the segmented epicardial model originating from human cardiac CT image data. To generate this patient-specific hybrid model, for each patient we start with a segmentation of the heart, its chambers and coronary arteries visible in the image data. Of these we use the left ventricle, left atrium, epicardial coronary arteries, and the volume containing all these elements: the whole heart segmentation. In addition, to initialize the forest we need to estimate flow and radius at each segmented vessel outlet and at some sections along the segmented vessels.
To generate the downstream vasculature, we apply a patient-specific CCO forest. From here on, segmented epicardial coro-naries are referred as vessels while the generated vasculature from forest growth is referred to as segments.
1) Patient priors: We select F points on the coronary vessels that correspond to the root location for the forest trees. These root points are distributed at each vessel tip, as well as along the vessels according to Kassab’s connectivity matrix [14] and patient-specific branch patterns. Because we focus on trees growing inside the left ventricular volume, we only use the root points located within 10 mm from the left ventricle.
Each root point is associated with a root radius rroot and a target flow value qtarg to initialize the forest. For a root point located at a vessel tip, the root radius corresponds to the vessel radius, ensuring continuity. For a root point located along a vessel, the root radius is derived from the Strahler order of the connectivity matrix and parent diameter. Since the segmented coronary model includes vessels down to a diameter of 1.2 mm, no root point above Strahler order 9 is distributed along the vessels to ensure that only vessels below the image resolution are added to the lateral surfaces of the patient-specific model. The total baseline flow Qperf is estimated from the left ventricle mass. Target flow for each tree is determined based on the root radius:
qitarg= (ri root)2.7 F P i=1 (ri root)2.7 Qperf (15)
The left ventricle segmentation corresponds to the final perfusion territory, with a volume Vperf, perfused by the forest trees. Most coronary vessels of interest lie on the left ventricle, but some are not directly on its surface because of fat and connective tissue. Therefore we consider an enclosing perimeter to work in: the whole heart segmentation. The random walk functions are calculated in both the heart and left ventricle segmentations. Because we grow trees within these two compartments, our potential function ranges from 0 to 2. The heart function ranges between 0, on surface, and 1, at left ventricle border. The left ventricle function ranges between 1, for the epicardium, and 2, for the endocardium. The sum of these functions is used as the potential for the forest growth.
Segment growth is constrained to the heart volume, but not initially to the ventricle volume. In order to prevent segments crossing over the ventricle blood pool, we connect the blood pools of the ventricle and the atrium with a geodesic dilation [21] inside the heart. During growth, each new segment cross-ing this forbidden territory is eliminated from the candidate list.
Inputs:
Number of terminal segments:Nterm
Final perfusion territory volume:Vperf
Number of trees: F
For each tree: root location,rrootand target flowqtargi
Initialization:
VMbox = Vperf/Nterm
Qterm = Pqitarg/Nterm
Define 1stconstrained random segment for each tree
Current number of terminal segments in forest: Kterm = F
Current territory volume:VK = Kterm × VMbox
Current forest flow: QK = PqiKterm = Kterm× Qterm
Increment territory:VK = (Kterm + 1)× VMbox
Set each tree activity based on its current flow
see section II. C. 2)
Pick 1 constrained random location Find 20 closest neighbor seg-ments belonging to active trees
Optimize bifurcation Update tree flow and radii
see section II. B. 1)
All constraints satisfied
see section II. D. 2)
Eliminate connection Store forest volume
For each neighbor segment : connection test
Number of forest volumes stored≥ 1 Permanently add connection with smallest volume
Kterm = Kterm + 1 Kterm= Nterm End YES NO YES YES NO NO
TABLE I: Measures on CCO Forest results
Simulation 1 Simulation 2 Simulation 3 tree 1 tree 2 tree 1 tree 2 tree 1 tree 2 Target flow (%) 50 50 66.7 33.3 90 10 Attained flow (%) 50.1 49.9 66.7 33.3 90.03 ± 0.05 9.97 ± 0.05 Territory (%) 55.6 ± 0.8 44.4 ± 0.8 67.5 ± 0.8 32.5 ± 0.8 89.0 ± 0.4 10.9 ± 0.4
2) Patient-specific constraints: As in Schreiner’s method, the growth is divided into 2 stages: in the first one, the territory is limited to a thin region near the left ventricle surface, whereas the second stage takes place in the whole ventricle volume. We expect more segments in the volume than over the surface. In our experiments, we empirically switch from stage 1 to stage 2 whenKterm= 1
6Nterm.
Since overlapping segments are not physiologically plausi-ble, during both stages, segments may not intersect with any tree segment or vessel or cross under vessels, i.e. between the vessel path and endocardium.
a) Stage 1 constraints: During the modeled growth on the ventricle surface, the tree growth speed is flow dependent, as described in section II-C2. The candidate locationnew loc is randomly picked on the ventricle surface. The bifurcation point resulting from the local optimization process is projected on the surface of the epicardium. The segments are constrained within the epicardial layer, defined as a domain derived from the potential values: w(~x) < 1.3.
To achieve coherence and continuity between the vessel and synthetic networks, a constraint is applied on the angle between the vessel direction and the vector stemming from the tree root to the new tested location, called vessel-to-tree angle. Since an angle equal to or greater than 90◦ is not optimal in a volume-minimizing network, we empirically set the maximal angle to 80◦. Any connection with a vessel-to-tree angle above this threshold value is eliminated from the candidate list. Because the first stage is subjected to many constraints (surface territory, angle and flow constraints), the angle and flow constraints are progressively relaxed (in 5% increments) if no new connection has been found after 100 iterations.
b) Stage 2 constraints: During this second stage, to ensure filling the whole ventricle, the angular constraint is eliminated, and segments can now cross below vessels as long as bifurcations are entirely located inside the inner half of the left ventricle.
However, since three-dimensional space offers much more freedom with the location of new segments, the growth speed cannot be constrained anymore with the hypersurface method described in II-C2: the resulting growth would interpenetrate competing trees too much, yielding unlikely configurations. Thus we combine a flow convergence process with a candidate location selection process to control tree growth during this stage.
Flow convergence process. We seek to control the current tree flow so that it does not exceed its target flow. One way to achieve this is to deactivate trees once they reach their target flow. However due to geometrical configurations and constraints some trees experience limited growth and never reach their target flow. To ensure distribution of the whole
forest flow we estimate an adaptive deactivation threshold every 121Nterm connections:
threshi= qitarg+ pi (16) This threshold is tree-specific to maintain relative flow distri-bution. To calculatepi, we identify all blocked trees, i.e. trees that have not grown since the last checkpoint. We estimate Qlost, the sum of the flow gaps between targetqi
targand current flow qi
Kterm. The p
i values correspond to the proportion of Qlost relative to the tree target flow. Once a tree has reached its threshold value, it is permanently deactivated.
Candidate location selection process.As a consequence of the flow convergence process, regions containing deactivated trees can become connected to far away trees, which induce physiologically unlikely networks. To avoid this, while still allowing some interpenetration between trees, we apply a selection on the new location before testing for connection. The closest tree neighbor has to be activated to acceptnew loc for connection test.
In addition, the accepted candidate locations are subject to the epicardial to endocardial gradient defined by Schreiner and described in section II-B2.
The whole algorithm progress is illustrated in Fig. 3, show-ing the crucial intermediate steps of the algorithm.
III. RESULTS ANDDISCUSSION
We generate synthetic networks for 6 different patient datasets. During stage 1, the forest is grown on the ventricle surface only, until 1000 terminal segments are generated. Dur-ing stage 2, the forest is extended inside the whole ventricle volume, until 6000 terminal segments are finally reached. Following Murray’s law, this number is estimated large enough to reach the arteriole level at the terminal segments.
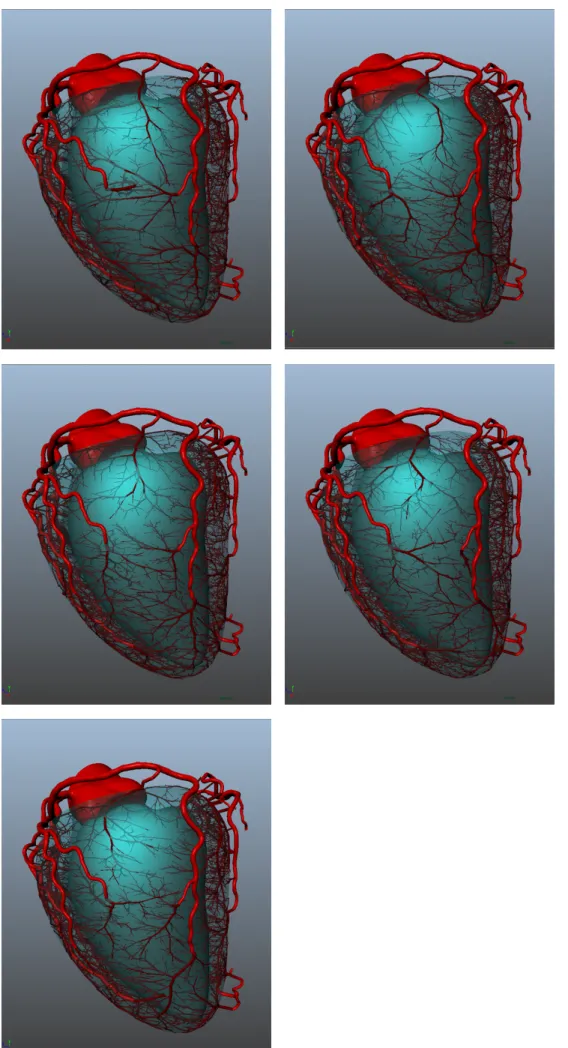
To study the algorithm behavior dependency on the initial-ization, we used varying random seeds to generate 5 synthetic networks with 6000 terminal segments on one randomly picked patient. We also grew the tree forest on 5 other cases, to analyze the adaptability of our algorithms to varying patient anatomy.
The algorithm is implemented in python 3.5 with numpy 1.4 and scipy 0.17.0, parallelized over 20 cores. We use AMD Opteron(TM) Processor 6274 processors to run the calculations.
A. Data
The CT scans are acquired on 6 patients using different CT scanners, representing the major manufacturers. Two datasets were acquired on a Siemens Somatum Definition CT scanner, two others on General Electric Healthcare DL and Light Speed VCT scanners, and two on a Philips iCT 256 scanner.
(a) (b) (c) (d)
Fig. 3: Illustration of forest growth on patient. (a): inputs provided. (b): distributing first segment on left ventricle surface for each tree. (c): surface growth (stage 1) reaching 1000 terminal segments. (d): inner growth (stage 2) reaching 6000 terminal segments.
Coronary segmentation is achieved using custom methods (HeartFlow, Inc., Redwood City, California, USA) to extract coronary arteries from the aorta down to a diameter estimated to be approximately1.2 mm. Patients with low disease burden and a variety of network profiles were selected. The patient segmented networks range from 13 to 27 vessel outlets, with thin to large vessels, tortuous and straight vessels. One patient is left-dominant, and the other 5 were right-dominant. Three patients had myocardial bridges, i.e. where the epicardial vessels had an intra-myocardial course for a portion of the vessel length. Heart chambers and whole heart segmentation was achieved with an automatic tool based on a random forest voxel classifier followed by active shape modeling fitting [3].
B. Testing algorithm repeatability
One randomly picked patient dataset was used to generate 5 networks with different random seeds.
The generated networks all fill the entire left ventricle, spreading over the entire surface and penetrating into the left ventricle tissue. In all cases, segmented vessels were correctly avoided by segments, yielding a plausible-looking outcome. When varying the random seed, the geometrical and optimization constraints enforced by our algorithms lead to different but similar-looking networks, see Fig. 4.
Over all 5 generations, the average total volume of the generated synthetic networks is 1261± 43 mm3. Since the algorithm’s objective is to minimize this value, such a low standard deviation indicates that our algorithm yields repeat-able results that are likely near the global optimal.
The algorithm succeeds in distributing flows close to the target values for most trees: the correlation coefficient between target and attained flow is0.92 over the 5 seed simulations.
The terminal segment diameter distribution is very similar for all seeds, with a mean value of 171± 61 µm, see Fig. 5.
Overall the algorithm produces reproducible, plausible vas-cular networks.
Fig. 5: Terminal segment diameters distributions for 5 different random seeds on the same patient.
C. Testing algorithm robustness
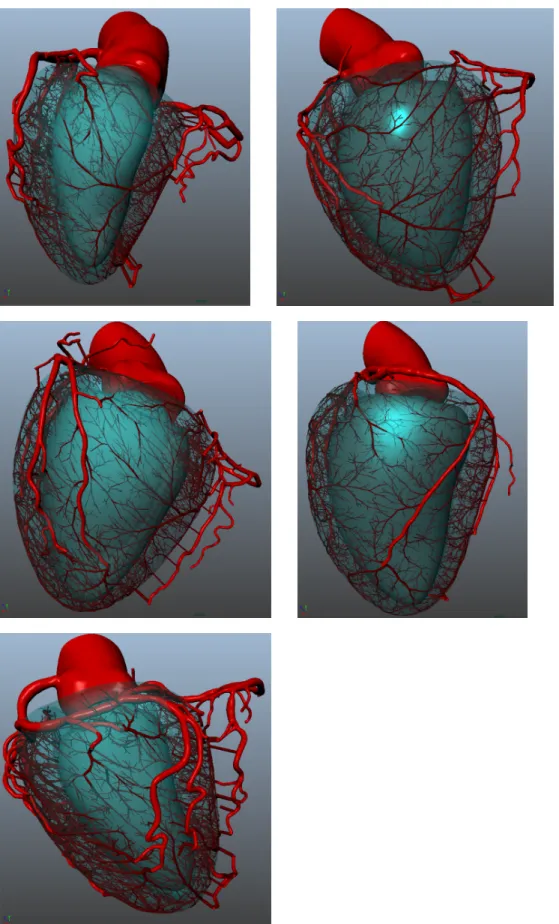
The forest growth methodology was applied on 6 distinct patient datasets. As the number of outlet and branching pattern varies across patients, the number of grown trees is patient-specific. The number of generated trees was respectively 33, 51, 38, 61, 52 and 50.
All 6 generated networks adapt to patient priors, and cor-relate with the segmented vessels in a plausible way, see Fig. 6.
To assess generated network coherence and continuity with the segmented vessels, we compare the morphometry of the combined network, joining segmented and synthetic models, with Kassab’s pig morphometry [14].
Diameter defined Strahler ordering: In order to compare with the Kassab morphometry, we classify vessels and seg-ments according to the Diameter Defined Strahler ordering [14]. All segments range between order 4 and 9, while vessels range between order 9 and 11. The segment average diameter
along order correlates with the Kassab measures, as shown in Fig. 7. For all labels (RCA, LAD, LCX), the coefficient determinationR2 values of Kassab are above 0.99, and so are the 6 patient ones relative to Kassab’s fits. We conclude that our Strahler ordering classification can be used to study other morphometric parameters.
Fig. 7: Measures along Strahler order for each label on 6 patients: Average segment diameter compared with Kassab’s fit.
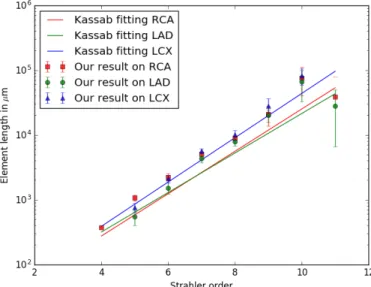
Element length: Together with the Strahler ordering, we define an element as a series of segments belonging to the same Strahler order [14]. The element lengths are plotted against the Kassab fitted models in Fig. 8.
Apart from the order 11, elements are equal or significantly longer in our model. It is likely due to the heart shape [4], which is more elongated in humans compared to pigs due to gravity acting on the bipedal upright stance. Consequently the coronaries need to spread around a larger surface, with longer vessels.
Fig. 8: Measures along Strahler order for each label on 6 patients: Average element length compared with Kassab’s fit.
Bifurcation asymmetry: Bifurcation asymmetry observed in our model has a similar trend compared to the data reproduced from tables in the online supplement of Kaimovitz [10]. The observed ratio is everywhere higher for small child over parent (SCoP) segment diameters, and everywhere lower for large child over parent (LCoP) segment diameters, see Fig. 9 and 10. This suggests a globally more symmetrical network. An important point is that our simulation ensures continuity between the segmented and simulated networks. Since the SCoP diameter ratios are observed to be already higher for the segmented network, this is carried over to the simulated one. The converse is true for the LCoP diameter ratios.
Fig. 9: Asymmetry study of results compared with Kassab morphometry: SCoP segment radius ratio.
Fig. 10: Asymmetry study of results compared with Kassab morphometry: LCoP segment radius ratio.
Tree flow: Most of the 285 trees reach their target flow, with a correlation coefficient of0.86.
Out of the 285 trees, 62 trees have difficulty growing, and never reach their target flow (they stay below 80% of their target flow). Among these, 18 trees did not succeed in growing
at all because of initialization issues. This was due to their first segment, which did not reach the left ventricle surface. Other non growing trees got stuck during growth due to a constraint that prevents bifurcations to degenerate, i.e. bifurcation for which one of the segments is larger than its own length. Most of the connections tested with these trees are rejected because of this constraint (83% observed on 372 randomly picked connection tests). However the geometric configuration at the tree roots (left ventricle surface, vessel orientation, tree neighbors) does not enable bifurcation with longer segments. When we remove these outlier trees, the correlation coefficient between the target and attained flow improves to 0.96.
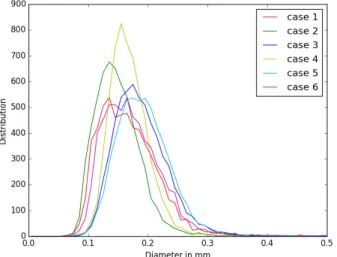
Terminal segment diameters: Over the 6 cases, we ob-serve unimodal terminal segment diameter distributions. The average value is 174± 53 µm, see Fig. 11
Fig. 11: Terminal segment diameters distributions for 6 differ-ent patidiffer-ents.
IV. CONCLUSION
In this paper, we have proposed a patient-specific hybrid image-based and synthetic geometric model that extends coro-nary trees from large epicardial arteries to arterioles. With this method we generated 6000-terminal segment models for 6 different patients. We showed that these models satisfy literature morphometry.
In immediate future work, we plan to improve the algorithm initialization to always provide a first segment connection to the left ventricle, when this is physiologically possible. Also, we will provide more flexibility in the non-degenerative constraint to ensure that all trees can grow despite large diameter roots. Further improvements could include specific situations, for instance maintaining the exact segmented vessel direction for the first synthetic segment.
The impact of parameters such as source distribution, num-ber of terminal segments, ratio between surface and inside ventricle segments, to find their optimal values remain to be studied. It could be relevant to make these parameters patient-specific, depending on the myocardial mass and segmented vessel characteristics.
Although results were not presented herein, we tested the CCO Forest with an alternative input: defining the tree pressure drop instead of its root diameter. This method does not ensure the diameter continuity between segmented and hybrid model thus it was not satisfying. The resulting differences could be further evaluated to better observe impact of this alternative method.
The software implementation for this method is a prototype written in the Python language, thus the computation time should be reduced. At present, a 6000 terminal segment simulation can take several days.
The physiological validity of the generated vasculature is currently being assessed with a multiscale hemodynamic model, see Fig. 12. Such models would enable full hemody-namic assessment in healthy and diseased patients, in both rest and stress conditions. Furthermore, extension of this CFD model to the left ventricle tissue compartment could provide perfusion simulations in rest and stress conditions.
Fig. 12: Output pressure (mmHg) from a multiscale 1D-0D hemodynamics model applied on a hybrid model (segmented image based model and generated segments).
REFERENCES
[1] S. Achenbach, W. Moshage, et al. “Value of electron-beam computed tomography for the noninvasive detec-tion of high-grade coronary-artery stenoses and occlu-sions”. In: New England Journal of Medicine 339.27 (1998), pp. 1964–1971.
[2] D. Buss, D. Hyde, et al. “Application of stereology to coronary microcirculation”. In: Basic research in cardiology76.4 (1981), pp. 411–415.
[3] T. F. Cootes, C. J. Taylor, et al. “Active shape models-their training and application”. In: Computer vision and image understanding61.1 (1995), pp. 38–59.
[4] S. J. Crick, M. N. Sheppard, et al. “Anatomy of the pig heart: comparisons with normal human cardiac struc-ture”. In: Journal of anatomy 193.1 (1998), pp. 105– 119.
[5] M. Georg, T. Preusser, et al. “Global Constructive Optimization of Vascular Systems”. In: ().
[6] A. Goyal, J. Lee, et al. “Model-based vasculature ex-traction from optical fluorescence cryomicrotome im-ages”. In: IEEE transactions on medical imaging 32.1 (2013), pp. 56–72.
[7] L. Grady. “Random walks for image segmentation”. In: IEEE transactions on pattern analysis and machine intelligence28.11 (2006), pp. 1768–1783.
[8] C. Jaquet, L. Najman, et al. “Hybrid image-based and synthetic geometric models for patient-specific simula-tion of coronary blood flow from the large arteries to the myocardium”. In: World Conference of Biomechanics (2018).
[9] B. Kaimovitz, Y. Lanir, et al. “Large-scale 3-D geomet-ric reconstruction of the porcine coronary arterial vascu-lature based on detailed anatomical data”. In: Annals of biomedical engineering 33.11 (2005), pp. 1517–1535. [10] B. Kaimovitz, Y. Huo, et al. “Diameter asymmetry of
porcine coronary arterial trees: structural and functional implications”. In: American Journal of Physiology-Heart and Circulatory Physiology294.2 (2008), H714– H723.
[11] A. Kamiya and T. Togawa. “Optimal branching struc-ture of the vascular tree”. In: The Bulletin of mathemat-ical biophysics34.4 (1972), pp. 431–438.
[12] R. Karch, F. Neumann, et al. “Staged growth of opti-mized arterial model trees”. In: Annals of biomedical engineering 28.5 (2000), pp. 495–511.
[13] G. S. Kassab. “Scaling laws of vascular trees: of form and function”. In: American Journal of Physiology-Heart and Circulatory Physiology290.2 (2006), H894– H903.
[14] G. S. Kassab, C. A. Rider, et al. “Morphometry of pig coronary arterial trees”. In: American Journal of Physiology-Heart and Circulatory Physiology 265.1 (1993), H350–H365.
[15] J. Keelan, E. M. Chung, et al. “Simulated anneal-ing approach to vascular structure with application to the coronary arteries”. In: Open Science 3.2 (2016), p. 150431.
[16] I. A. Lubashevsky and V. V. Gafiychuk. “Analysis of the optimality principles responsible for vascular network architectonics”. In: arXiv preprint adap-org/9909003 (1999).
[17] N Mittal, Y Zhou, et al. “A computer reconstruction of the entire coronary arterial tree based on detailed mor-phometric data”. In: Annals of biomedical engineering 33.8 (2005), pp. 1015–1026.
[18] C. D. Murray. “The physiological principle of minimum work I. The vascular system and the cost of blood
volume”. In: Proceedings of the National Academy of Sciences12.3 (1926), pp. 207–214.
[19] W. Schreiner and P. F. Buxbaum. “Computer-optimization of vascular trees”. In: Biomedical Engi-neering, IEEE Transactions on 40.5 (1993), pp. 482– 491.
[20] W. Schreiner, R. Karch, et al. “Optimized arterial trees supplying hollow organs”. In: Medical engineering & physics28.5 (2006), pp. 416–429.
[21] J. Serra. Image analysis and mathematical morphology, v.1. English revised version. London: Academic Press, 1982.URL: http://cds.cern.ch/record/235415.
[22] N. Smith, A. Pullan, et al. “Generation of an anatom-ically based geometric coronary model”. In: Annals of biomedical engineering28.1 (2000), pp. 14–25. [23] M. H. Tawhai, A. Pullan, et al. “Generation of an
anatomically based three-dimensional model of the con-ducting airways”. In: Annals of biomedical engineering 28.7 (2000), pp. 793–802.
[24] J. Ulysses, L. Berg, et al. “An optimization-based algorithm for the construction of cardiac Purkinje net-work models”. In: IEEE Transactions on Biomedical Engineering(2018).
[25] E VanBavel and J. Spaan. “Branching patterns in the porcine coronary arterial tree. Estimation of flow heterogeneity.” In: Circulation research 71.5 (1992), pp. 1200–1212.
[26] J. P. van den Wijngaard, J. C. Schwarz, et al. “3D Imaging of vascular networks for biophysical modeling of perfusion distribution within the heart”. In: Journal of biomechanics46.2 (2013), pp. 229–239.
[27] Y. Zhou, G. S. Kassab, et al. “On the design of the coronary arterial tree: a generalization of Murray’s law”. In: Physics in medicine and biology 44.12 (1999), p. 2929.