HAL Id: hal-01284458
https://hal.archives-ouvertes.fr/hal-01284458
Submitted on 7 Mar 2016HAL is a multi-disciplinary open access archive for the deposit and dissemination of sci-entific research documents, whether they are pub-lished or not. The documents may come from teaching and research institutions in France or abroad, or from public or private research centers.
L’archive ouverte pluridisciplinaire HAL, est destinée au dépôt et à la diffusion de documents scientifiques de niveau recherche, publiés ou non, émanant des établissements d’enseignement et de recherche français ou étrangers, des laboratoires publics ou privés.
mellifera) population of Rodrigues Island, based on
microsatellite and mitochondrial DNA
Maéva Angélique Techer, Johanna Clémencet, Patrick Turpin, Nicolas
Volbert, Bernard Reynaud, Hélène Delatte
To cite this version:
Maéva Angélique Techer, Johanna Clémencet, Patrick Turpin, Nicolas Volbert, Bernard Reynaud, et al.. Genetic characterization of the honeybee (Apis mellifera) population of Rodrigues Island, based on microsatellite and mitochondrial DNA. Apidologie, Springer Verlag, 2015, 46 (4), pp.445-454. �10.1007/s13592-014-0335-9�. �hal-01284458�
Genetic characterization of the honeybee (
Apis mellifera )
population of Rodrigues Island, based on microsatellite
Maéva Angélique TECHER1,2,Johanna CLÉMENCET1,Patrick TURPIN2,Nicolas VOLBERT3,
Bernard REYNAUD2,Hélène DELATTE2
1Université de La Réunion, UMR PVBMT, 97715 Saint Denis cedex 9, La Réunion, France 2CIRAD, UMR PVBMT, 7 chemin de l’Irat, Ligne Paradis, 97410, Saint Pierre, La Réunion, France
3Apicultural Services, Rodrigues Regional Assembly - Agriculture, Citronnelle, Rodrigues, Africa
Received 6 January 2014– Revised 27 October 2014 – Accepted 12 November 2014
Abstract– Apis mellifera is present in Rodrigues, an island in the South-West Indian Ocean. The history of the established honeybee population is poorly known, and its biodiversity has never been studied. In this study, maternal origins of A. mellifera in Rodrigues have been assessed with the DraI test and sequencing of the mitochondrial COI-COII region. Nuclear genetic diversity was investigated with 18 microsatellite markers. A total of 524 colonies were sampled from 16 beekeepers in 20 sites. The Rodrigues population was characterized by the absence of the African lineage and presence of three European haplotypes from the C lineage. C1 haplotype was the most frequent (81.3 %), followed by C2 (18.0 %) (characteristics of A. m. ligustica and carnica , respectively) and a new haplotype, C1-Rod (0.7 %). No genetic structure was detected, and genetic diversity was comparable to continental populations. According to approximate Bayesian computation (ABC) analyses, bottleneck scenarios are most likely to have occurred.
tropical / insular / molecular analyses / ABC method / beekeeping
1. INTRODUCTION
During the past decade, honeybee populations have experienced declines and colony losses are continually reported in Europe and the USA (van Engelsdorp and Meixner 2010; Chauzat et al.
2013). The reduction of genetic diversity due to beekeeping practices is one of the several causes suggested (Oldroyd2007) and has had an impor-tant impact on managed colonies (De la Rúa et al.
2013). Studies have demonstrated that reduced levels of intra-colonial genetic diversity affect colony fitness (Tarpy et al.2013).
In its endemic area, Apis mellifera has evolved into at least 28 described subspecies (Ruttner
1988; Sheppard and Meixner 2003; Meixner et al.2011,2013) which have been grouped into four evolutionary branches using morphometric analysis (Ruttner 1988): the European North-Mediterranean (C) and the West-North-Mediterranean (M) lineages, the Oriental O lineage and the Afri-can A lineage. The breakdown of the different evolutionary lineages is supported by molecular analyses (Garnery et al. 1992; Whitfield et al.
2006; Wallberg et al. 2014). The European subspecies Apis mellifera ligustica and Apis mellifera carnica (C lineage) have been in-troduced worldwide because of their commer-cially desirable traits and have succeeded in Electronic supplementary material The online version of
this article (doi:10.1007/s13592-014-0335-9) contains supplementary material, which is available to authorized users.
Corresponding author: M. Techer, maeva-angelique.techer@cirad.fr;
H. Delatte, helene.delatte@cirad.fr Manuscript editor: Marina Meixner
Apidologie (2015) 46:445–454
Original article
* INRA, DIB and Springer-Verlag France, 2014 DOI:10.1007/s13592-014-0335-9
adapting to new habitats (Chapman et al.
2008; Delaney et al. 2009).
In the South-West Indian Ocean, Apis mellifera unicolor (Latreille1804) has been described as an endemic subspecies from Madagascar and be-longs to the African lineage (Ruttner1988). Hon-eybees are also established in the Mascarene ar-chipelago (East of Madagascar) comprising La Réunion, Mauritius, and Rodrigues (Ruttner
1988). Rodrigues was discovered early in the sixteenth century, on the route to India (North-Coombes 1971). It is not known whether A. mellifera spp. were already present on the island before colonization. Controlled imports of honeybee queens are thought to have started in the 1930s, and around 1500 traditional hives were identified in the 1940s and 1950s (Bappoo and Ramanah 1989). In 1981, 11 European queens were reported to have been introduced to Rodri-gues from the USA (Bappoo and Ramanah1989). In 2002, the Rodrigues government restricted honeybee importation (Rodrigues apicultural ser-vices, unpublished data). In 2010, 2251 managed colonies from 173 beekeepers were identified (Belmin2010). Since human colonization of the island, extensive habitat degradation has occurred with the total loss of the original forest (Thébaud et al.2009).
In the Mascarene, mitochondrial diversity of honeybees had been investigated in La Réunion (n =20) and Mauritius (n =10) and AIwas the sole
sublineage detected (Franck et al. 2001). This study aims to describe the genetic diversity of the honeybee population in Rodrigues using mo-lecular tools. First, the evolutionary lineages and subspecies were investigated using the mitochon-drial COI-COII intergenic region. Then, the level of nuclear genetic diversity and its structure was investigated with microsatellite markers. Finally, we attempted to detect a bottleneck event, date it, and estimate effective population size before, dur-ing, and after the event.
2. MATERIALS AND METHODS 2.1. Sampling and DNA extraction
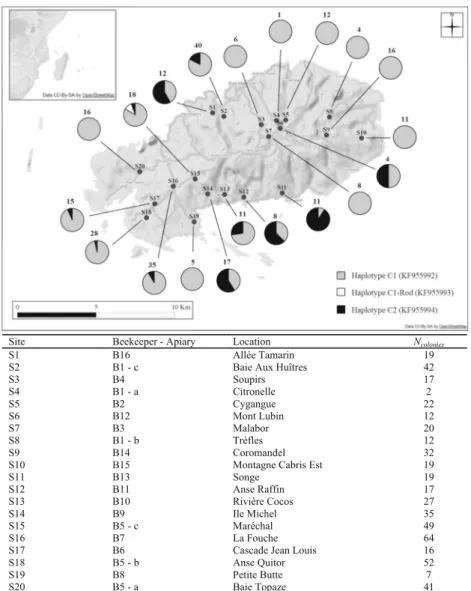
The study was conducted on the island of Rodrigues (18.3 km long and 8.5 km wide) (Figure1). In February
2013, a total of 524 managed colonies belonging to 16 beekeepers were sampled from 20 different sites (Figure1). One worker was collected from the entrance to each colony. Honeybees were preserved in ethanol (95 %) and kept at −20 °C until molecular analysis. Each worker was analyzed for both mitochondrial and microsatellite markers. Total DNA isolation was performed from the six legs of each individual following the method of Garnery et al. (1993) with slight modifications.
2.2. Mitochondrial DNA analysis
Mitochondrial analysis was carried out following Garnery et al. (1993). This consisted of PCR amplifica-tion of the intergenic COI-COII region using E2 and H2 primers, followed by a restriction of the amplified prod-uct with the DraI enzyme (Promega). PCR reaction was performed in a volume of 15 μL containing 2 mM MgCl2, 2 mM dNTPs, buffer 5× (Promega), 20 pmol
of each primer, 30 units of GoTaq Flexi® Promega, 0.5μL of DNA at 5 ng/μL. Samples underwent initial denaturation for 5 min at 92 °C, 35 cycles of 30 s at 92 °C, 45 s at 48 °C, 2 min at 62 °C, and a final elongation step of 7 min at 92 °C. DraI digestion was performed according to the manufacturer’s recommen-dations (Promega). Restriction fragments were separat-ed in 5 % agarose MetaPhor gels.
The mitochondrial DNA (mtDNA) intergenic COI-COII region was sequenced in at least 30 % randomly selected individuals within each sample site, using the same E2-H2 primers. Individuals exhibiting rare restric-tion profiles were systematically sequenced. Sequence checking and alignment was done using Mega 5.1 soft-ware (Tamura et al.2011) and then blasted on NCBI GenBank. All newly detected sequences were submit-ted to the GenBank database.
2.3. Microsatellite DNA analysis
A total of 18 polymorphic microsatellite loci (Estoup et al. 1994, 1995; Franck et al.1998; Solignac et al.
2003) were scored A113, A24, AC306, AP55, AP81, A107, A29, A88, AP273, A28, AP289, B124, A35, A8, AP33, AP43, AP66, and A43 (TableS1). Primers were distributed into four multiplex PCR reactions (Table S1). PCR reactions were performed in 10-μL volumes containing 5 μL of Master Mix Type-it 2× Qiagen, 0.2 μL of each primer at 20 pmol/μL, and
1μL of DNA at 5 ng/μL. All programs started with a denaturing cycle at 94° for 5 min, followed by 35 cycles of 30 s at 94 °C, 30 s at 52 °C, 45 s at 72 °C, and a final elongation at 72 °C for 20 min, except for Mix 1 where annealing was done at 55 °C. The samples were run through DNA sequencer ABI Prism 3130×L, and alleles were scored using Genemapper 4.0 (Applied Biosystems).
As a preliminary analysis, Micro-Checker 2.2.3 (Van Oosterhout et al.2004) was used to identify genotyping errors. The frequency of null alleles per locus was estimated with FreeNa (Chapuis and Estoup 2007)
based on 1000 bootstrap replicates. For each site with N≥10 colonies, microsatellite diversity was estimated through mean number of alleles (Na), observed (Hobs),
and unbiased expected heterozygosity (He) (Nei1978)
with GENETIX 4.05 (Belkhir et al.1996). Allelic rich-ness (Ar) per site was calculated with FSTAT 2.9.3.2 (Goudet2001) using the rarefaction method. Heterozy-gosity excess or deficit was estimated by calculating FIS
according to Weir and Cockerham (1984). Deviations from the Hardy-Weinberg equilibrium (HWE) and link-age disequilibrium were tested using GENEPOP 3.4 (Raymond and Rousset 2004). False discovery
Site Beekeeper - Apiary Location Ncolonies
S1 B16 Allée Tamarin 19
S2 B1 - c Baie Aux Huîtres 42
S3 B4 Soupirs 17 S4 B1 - a Citronelle 2 S5 B2 Cygangue 22 S6 B12 Mont Lubin 12 S7 B3 Malabor 20 S8 B1 - b Trèfles 12 S9 B14 Coromandel 32
S10 B15 Montagne Cabris Est 19
S11 B13 Songe 19 S12 B11 Anse Raffin 17 S13 B10 Rivière Cocos 27 S14 B9 Ile Michel 35 S15 B5 - c Maréchal 49 S16 B7 La Fouche 64
S17 B6 Cascade Jean Louis 16
S18 B5 - b Anse Quitor 52
S19 B8 Petite Butte 7
S20 B5 - a Baie Topaze 41
Figure 1. a Distribution of the mitochondrial sequences on the 20 sampled sites of Rodrigues. Number of individuals sequenced by site is indicated in the top of each diagram. b Details on beekeeper apiaries.
rate (FDR) estimators (q -value) were calculated for probability values of repeated comparisons, using the R package QVALUE (Dabney et al.
2004). Pairwise FST values were calculated for
all combinations of the 18 sites (with N≥10 col-onies) and tested using permutations with FSTAT (Goudet 2001). Population structure and assign-ment of individuals to clusters were inferred using a Bayesian model-based clustering method with STRUCTURE 2.3.3 (Pritchard et al. 2000). Anal-yses were based on the admixture model with correlated allele frequencies with simulations of 105 burn-in steps and 106 iterations of MCMC algorithm for each run. Ten runs for each K (number of genetic clusters) value [1–20] were computed to estimate the most likely value of K. Optimal number of clusters was determined using Evanno’s estimator ΔK (Evanno et al. 2005) im-plemented in STRUCTURE HARVESTER (Earl and vonHoldt 2011). Principal components analy-sis (PCA) was used to visually identify and de-scribe clusters of genetically related individuals with adegenet 1.3-9.2 package (Jombart 2008).
2.4. Testing for a bottleneck event using ABC
Approximate Bayesian computation (ABC) using DIYABC software version 2.0 was performed on
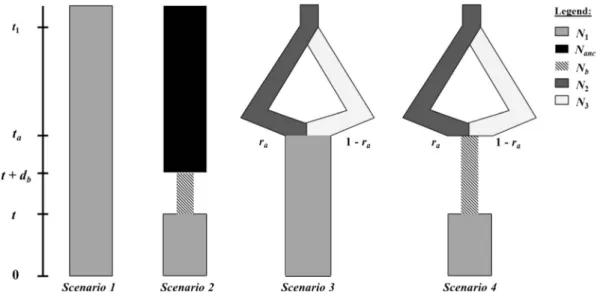
microsatellite data to test for potential bottleneck events (Cornuet et al.2008,2010). This method ranks scenar-ios based on their approximate posterior probabilities. For each scenario, a large number of simulated data sets are produced by sampling parameter values into prior distributions (TableI). The occurrence of each scenario among the simulated data sets that are closest to the observed data gives an estimate of its posterior proba-bility using a logistic regression procedure. Four demo-graphic scenarios were compared here (Figure2), two with a bottleneck and two without. In scenario 1, the Rodrigues population is assumed to have an effective number of individuals N1that has been constant over
time, including at colonization. In scenario 2, an effec-tive number of queens Nb sampled from an ancestral
population of effective size Nanc, founded the
Rodri-gues population t generations ago. This bottleneck lasted db generations. After that, the effective
popula-tion size increased to the current populapopula-tion size N1. It is
reasonable to assume that the Rodrigues population was not founded from a single population source, but rather by several successive introductions from distinct ori-gins. Such admixed origin may leave important signa-tures in the genetic structure of the population and should therefore be accounted for (Estoup and Guillemaud 20 10). Scen arios 1 a nd 2 wer e complemented with two others accounting for the ad-mixture at the origin of the Rodrigues population. In scenario 3, the current population resulted from the
Table I. Parameter names of all four scenarios used in DIYABC software prior values minimum and maximum, posterior parameter estimate values (mode as point of estimation), and 95 % confidence interval, relative bias, and relative square root error.
Parameter name Prior value range Posterior parameter values 95 % confidence interval Relative bias Relative square root error Population size effective
N1 [2–2000] 760 [333–1840] −0.241 0.491 Nanc [5000–10,000] 7463 [5470–9840] −0.005 0.232 Nb [2–100] 60 [20–95] 0.441 0.522 Time in generation t [2–100] 19 [7–95] 0.592 1.785 db [2–50] 30 [9–47] −0.071 0.407
Genetic parameters (rate)
μmic [1×10⁻⁴–1×10⁻³] 1×10⁻³ [4.0×10⁻⁴–1.0×10⁻³] −0.0561 0.314
pmic [1×10⁻¹–3×10⁻¹] 3×10⁻¹ [1.4×10⁻¹–3.0×10⁻¹] −0.0044 0.342
admixture of two ancestral and unsampled populations of sizes N2 and N3, respectively (same evolutionary
lineage or not), at a time taand with admixture rate ra.
These two ancestral populations were assumed to have diverged from a common ancestor at date t1. Scenario 4
is the same, except that during the admixture, the pop-ulation suffered a bottleneck. The details on the method used for DIYABC estimations are given in FigureS1.
3. RESULTS
3.1. Mitochondrial DNA
PCR amplifications of the mtDNA intergenic COI-COII region were successful for 468 out of the 524 individuals sampled. All amplified prod-ucts presented the same size ∼570 bp, which corresponds to the length of Q-type sequence, characteristic of the East European C lineage (Garnery et al.1998). After PCR-RFLP analyses were performed, only one restriction fragment pattern was observed (fragment size∼40/41, 47, 64, and 420 pb). Of the 278 individuals sequenced (Figure1), three different sequences were detect-ed. Two were previously described as the C1(a) haplotype belonging to populations of the A. m. ligustica subspecies (GenBank accession FJ478010.1 (Franck et al. 2001), JQ977699.1 (Muñoz et al. 2012), EF033655.1 (Collet et al.
2006)) and the C2(j) haplotype reported in A. m. carnica (JF723978.1). The third sequence exhib-ited 99 % similarity with C1 and presented a new polymorphic site. This new sequence was named C1-Rod (KF955993). C1 was the most frequent (n =226, 81.3 %, KF955992) and was present in all sites; C2 (KF955994) was observed in 50 colonies from 11 sites (18.0 %), while C1-Rod was only detected in two colonies (0.7 %) of the same site S15 (Figure1).
3.2. Microsatellite loci
A107 and AP81 (i) were difficult to score, (ii) presented high levels of null alleles (13.2 and 9.2 %, respectively), and (iii) had the highest levels of missing data (3.8 and 1.5 %, respectively). For these reasons, A107 and AP81 were removed from nuclear analysis. All individuals were successfully genotyped with at least ten loci amplified. Only nine loci combinations of 120 were significantly linked and involved different loci.
The number of detected alleles per locus ranged from three (AP273) to 15 (A029) for all individuals (n =524) (TableS1). Over all the sites, the mean number of alleles (n =16 loci) detected was 7.63 (±3.05). Genetic diversity between sites was comparable when sample size was corrected with an allelic richness ranging from 4.75 (±1.58)
Figure 2. Schematic drawing of the four scenarios used for the ABC method.
for S13 to 5.09 (±1.38) for S8. An asymptotic relationship was observed between the mean number of alleles and the cumulated number of sampled colonies (FigureS2). According to Pons and Chaouche (1995), the genetic diversity of the sample (representing 23.3 % of the colonies iden-tified in 2010 (Belmin 2010)) was considered representative of the global genetic diversity of the Rodrigues honeybee population (FigureS2). Overall observed heterozygosity was similar to what was predicted under the HWE model (TableII). Multilocus values of FISper site ranged
from −0.075 (B1-b) to 0.051 (B6), and overall value was−0.001 (Table II). After FDR correc-tion, none of these FISvalues were significant and
all sites were assumed to be under the HWE. Genetic differentiation between sites (pairwise FST) was low and ranged from−0.009 (sites S17
and S16) to 0.022 (sites S3 and S6). After Bonferroni corrections, only one pair of 153 pairwise comparisons was significant (FST=
0.014; p value=0.000260<p value adjusted for multiple comparisons=0.000263) for sites S15 and S12, respectively.
Analyses of Bayesian model-based clustering with STRUCTURE did not reveal evidence of population structure and differentiation, using the method of Evanno et al. (2005) (FigureS3). When K was >1, the probability of posterior as-signment of each individual was equivalent for each cluster. Those results were supported by complementary PCA analyses which did not show any differentiation between groups of individuals.
3.3. Testing for a bottleneck event using ABC
Scenarios were ranked according to their pos-terior probabilities as follows: the best scenario was scenario 2 with a posterior probability of 0.558 (95 % confidence interval [0.543, 0.571]). Then, scenario 4 (p =0.347 [0.333, 0.361]), followed by scenario 3 (p =0.089 [0.080, 0.099]). The last was scenario 1 (p =0.006 [0.000, 0.014]). Based on posterior probabilities, scenarios implicating a bottleneck (2 and 4) were more probable (a total posterior probability of 0.904) and supplanted the scenarios without a
bottleneck (1 and 3, for a total posterior probabil-ity of 0.096). Full results of simulations to test for scenario confidence are given in Table S2. The probability that data sets simulated under scenar-ios without bottleneck (1 or 3) were assigned to the scenarios with bottleneck (2 or 4) amounted to 0.101 (type II error rate).
Parameter estimates, relative bias, and relative precision indices for scenario 2 are listed in TableI. Genetic parameters and ancestral popula-tion size Nanc could not be estimated with
preci-sion (data not shown). Despite this, it is remark-able that noteworthy parameters could be estimat-ed with satisfactory precision. The current popu-lation effective size N1was estimated at around
760 individuals (95 % confidence interval [333– 1840]). The population experienced a bottleneck event 49 generations ago, ending 19 [7–95] gen-erations ago and lasting approximately 30 [9–47] generations. Estimations suggested that around 60 [20–95] individuals colonized or were introduced to the island from a larger and ancestral population with an effective size of over 7463 [5470–9840].
4. DISCUSSION
Mitochondrial analyses showed that all sam-pled colonies had only the Q sequence character-istic of the C lineage. This result is startling know-ing that the honeybees of the surroundknow-ing islands are of African lineage (Ruttner1988; Franck et al.
2001). Furthermore, Rodrigues mainly depends on Mauritius for commercial exchanges; honey-bees could have easily colonized Rodrigues. Eu-ropean queens introduced in 1981 could have been more competitive and/or more favored by the beekeepers than the African lineage (if present).
The sequencing of the COI-COII intergenic indicated A. m. ligustica (C1, C1-Rod) and A. m. carnica (C2) descendants (Garnery et al.
1993, 1998). A. m. ligustica maternal lineages were four times more prevalent than A. m. carnica over all the sampling. Presence of European C lineage haplotypes is consistent with the reported introduction of queens bought from the US com-mercial stock (Bappoo and Ramanah1989). In the USA, haplotypes C1 and C2 are characteristic of the most popular honeybee strains sold (Delaney
et al.2009). These commercially widespread sub-species have adapted well to the environmental conditions of this tropical island and persisted for over 32 years.
Furthermore, results of the ABC scenario choice support the assumption that the introduc-tion of honeybees to the island was associated with a genetic bottleneck. Results from the bottle-neck test are entirely credible in such insular ocean environments where colonization is limited by geographical barriers. According to the best scenario (2 with p =0.558), this bottleneck event occurred approximately 49 generations ago (in an interval of 16 to 142 generations). One generation of A. mellifera is assumed to be approximately 2 years (Estoup et al.1995; Excoffier et al.2005). Present estimations are consistent with historical records of introductions of European honeybees
in 1981. DIYABC results also suggest that the origin population had a large effective size (more than 7463 individuals). In the USA, the honeybee population was estimated to be 4.5 million colo-nies in 1980 (van Engelsdorp et al.2008).
Nuclear genetic analyses indicated that the honeybee colonies on Rodrigues constituted one genetic population with homogenous diversity among sites. This observation was also demon-strated in other oceanic islands such as Menorca (701.8 km2) and Ibiza (572 km2) (De la Rúa et al.
2003). No genetic differentiation appeared along geographical distances indicating that gene flow is sufficient to homogenize nuclear genetic diversity. Rodrigues is a small island (104 km2) where apiary transhumance is not practiced by bee-keepers. The distance between sedentary colo-nies might be too small to create genetic
Table II. Sampling information with site code, number of colonies (Ncolonies), mean number of alleles (Na),
observed heterozygosity (Hobs), expected unbiased heterozygosity (Hexp), and Weir and Cockerham’s fixation
index (FIS).
Site Ncolonies Na Ar Hobs Hexp FIS
S1 19 5.63 (±1.71) 4.89 (±1.25) 0.701 (±0.167) 0.673 (±0.122) −0.043 S2 42 6.19 (±2.07) 4.87 (±1.32) 0.664 (±0.144) 0.641 (±0.146) −0.036 S3 17 5.06 (±1.65) 4.81 (±1.11) 0.643 (±0.214) 0.614 (±0.203) −0.049 S4 2 – – – – – S5 22 5.75 (±1.81) 5.01 (±1.58) 0.640 (±0.204) 0.637 (±0.173) −0.004 S6 12 4.81 (±1.11) 4.87 (±1.20) 0.693 (±0.210) 0.648 (±0.158) −0.073 S7 20 5.38 (±1.67) 4.95 (±1.37) 0.653 (±0.195) 0.617 (±0.170) −0.061 S8 12 4.94 (±1.44) 5.09 (±1.38) 0.677 (±0.221) 0.632 (±0.196) −0.075 S9 32 5.81 (±1.60) 4.94 (±1.44) 0.660 (±0.168) 0.641 (±0.152) −0.031 S10 19 5.44 (±1.50) 4.94 (±1.32) 0.633 (±0.172) 0.643 (±0.147) 0.016 S11 19 5.56 (±1.90) 5.07 (±1.53) 0.625 (±0.150) 0.640 (±0.164) 0.023 S12 17 5.31 (±1.66) 4.89 (±1.38) 0.614 (±0.168) 0.626 (±0.146) 0.020 S13 27 5.75 (±1.69) 4.75 (±1.58) 0.632 (±0.187) 0.640 (±0.187) 0.013 S14 35 6.13 (±1.93) 4.89 (±1.33) 0.663 (±0.154) 0.656 (±0.129) −0.010 S15 49 6.25 (±2.57) 5.04 (±1.47) 0.626 (±0.180) 0.630 (±0.166) 0.007 S16 64 6.31 (±2.02) 4.82 (±1.55) 0.628 (±0.146) 0.645 (±0.139) 0.027 S17 16 5.31 (±1.70) 5.01 (±1.48) 0.642 (±0.111) 0.676 (±0.119) 0.051 S18 52 6.56 (±2.16) 4.99 (±1.29) 0.633 (±0.161) 0.650 (±0.157) 0.025 S19 7 – – – – – S20 41 6.25 (±1.98) 5.01 (±1.32) 0.624 (±0.172) 0.612 (±0.157) −0.021 524 7.63 (±3.05) 0.644 (±0.143) 0.643 (±0.144) −0.001
Fixation index (FIS) of Weir and Cockerham (1984). Standard deviation is indicated in parentheses
isolation (0.60 to 13.8 km). Exchange of q u e e n s b e t w e e n b e e k e e p e r s , c o l o n y swarming, and male flight most likely ensure gene flow. Here, no nuclear genetic differences were found between colonies with the mtDNA sequence characteristics of A. m. ligustica and A. m. carnica whereas Muñoz et al. (2009) were able to detect differences between sub-species. This absence of genetic difference suggests that either hybrids were introduced or hybridization occurred after introduction. The study gives evidence of anthropogenic effects on the honeybee population in Rodri-gues such as (i) the presence of exotic subspe-cies favored by beekeepers, (ii) hybridization phenomena between subspecies, and (iii) ab-sence and/or non-utilization of the A lineage honeybees present in the area.
The Rodrigues honeybee population has levels of genetic diversity comparable to continental Eu-ropean populations of A. m. ligustica and carnica . For four comparable loci (A113, Ap55, B124, and Ap43), indigenous populations of A. m. carnica and/or ligustica in Croatia and Italy showed between 9.25 and 9.75 alleles per locus whereas 8.50 alleles were detected in the Rodri-gues population (Muñoz et al. 2009). Another indication of the high levels of genetic diversity was heterozygosity (Hobs=0.644) which was
equivalent to (i) indigenous Italian and Croatian populations (Hobs=0.638 and Hobs=0.674,
re-spectively (Muñoz et al.2009)) and (ii) US com-mercial populations (Ho b s=0.53 in 2005
(Delaney et al.2009)). Levels of heterozygosity of the Rodrigues honeybee population were higher than other insular systems in which A. m. ligustica was introduced. As an example, in the Azores, 35 % of colonies had haplotype C1 (co-habiting with 48 % of sublineage AIIIand 17 %
AII) and levels of observed heterozygosity were
two times lower (Hobs=0.22±0.03) than those in
Rodrigues (De la Rúa et al.2006). The same can be found in the Canary Islands, with only 31.2 % of observed heterozygotes in El Hierro (n =17, 18 % of haplotype C1 and 82 % haplotype A15) and 41.3 % in Tenerife (n =76, 35 % of C1 and three other African haplotypes) (De la Rúa et al.
2001). Unlike the rest of the world, the honeybee population in Rodrigues did not experience strong
biological pressure caused by parasites and path-ogens and this could explain these differences (vanEngelsdorp and Meixner2010). A. mellifera in Rodrigues Island has a remarkable sanitary situation with no Varroa destructor (Belmin
2010), which was recently reported in Madagas-car (Rasolofoarivao et al.2013). To this day, the only known parasites and pathogens are the bee louse Braula pretoriensis and Nosema apis (Rehm1988).
This study revealed a surprising lack of African lineage and exclusive presence of two subspecies: A. m. carnica and A. m. ligustica from the Euro-pean C lineage. The honeybee population in Ro-drigues did not show genetic structure but pre-sented high levels of heterozygosity.
ACKNOWLEDGMENTS
We would like to thank J Félicité, G Volbert, and the Commission of Apiculture and Agriculture of Rodri-gues for their welcoming and assistance in organizing the collection of samples. We are also grateful to the beekeepers: JJ Clain, JN Daya, L Felicité, D François, G François, J Herman-Casimir, JP Kan-John, JH Marianne, C & M Peermamode, MJ Ravanne, J Rikarl, and the feminine associations Ile Michel and Rodrigues-Farmer. We wish to thank C Simiand for his assistance in the laboratory. We would like to warmly thank V Ravigné for her precious help with DIYABC software; for the understanding of the methods, the analyses, and results; and for her corrections. We thank L Garnery for his advice on molecular methodology. We would like to thank the anonymous reviewers for improving the man-uscript. Finally, we thank the network QualiREG and V Porphyre for helpful contacts. M ATecher is recipient of a PhD fellowship of the Sciences and Technology Doc-toral School of the University of La Réunion. This study was partially funded by CIRAD, Région Réunion, and e-PRPV.
Caractérisation génétique de la population d’abeilles (Apis mellifera ) de l’île Rodrigues, basée sur les microsatellites et l’ADN mitochondrial
analyse moléculaire / méthodes ABC / apiculture / tropiques / insularité
G e n e t i s c h e C h a r a k t e r i s i e r u n g d e r Honigbienenpopulation (Apis mellifera ) auf der Insel
Rodrigues, auf der Basis von Mikrosatelliten und mitochondrialer DNA
tropisch / insulär / molekulare Analysen / ABC-Methode / Bienenhaltung
REFERENCES
Bappoo, D.R., Ramanah, D. (1989) The state of beekeeping in Mauritius and other Mascarene Islands, p. 2. Pro-ceedings Fouth International Conference on Apiculture in Tropical Climates, Cairo, Egypt
Belkhir, K., Borsa, P., Chikhi, L., Raufaste, N., Bonhomme, F. (1996) GENETIX 4.05, logiciel sous Windows TM pour la génétique des populations. Laboratoire gé-nome, populations, interactions. CNRS UMR 5000 , 1996–2004
Belmin, R. (2010) Intérêt et faisabilité d’une Indication Géographique pour le miel de Rodrigues, p. 72. Université de Nancy, Nancy
Chapman, N.C., Lim, J., Oldroyd, B.P. (2008) Population Genetics of Commercial and Feral Honey Bees in Western Australia. J. Econ. Entomol. 101 (2), 272–277 Chapuis, M.-P., Estoup, A. (2007) Microsatellite null al-leles and estimation of population differentiation. Mol. Biol. Evol. 24 (3), 621–631
Chauzat, M.P., Cauquil, L., Roy, L., Franco, S., Hendrikx, P., et al. (2013) Demographics of the European apicul-tural industry. PLoS One 8 (11), e79018
Collet, T., Ferreira, K.M., Arias, M.C., Soares, A.E., Del Lama, M.A. (2006) Genetic structure of Africanized honeybee populations (Apis mellifera L. ) from Brazil and Uruguay viewed through mitochondrial DNA COI-COII patterns. Heredity 97 (5), 329–335 Cornuet, J.-M., Santos, F., Beaumont, M.A., Robert, C.P.,
Marin, J.-M., et al. (2008) Inferring population history with DIY ABC: a user-friendly approach to approxi-mate Bayesian computation. Bioinformatics 24 (23), 2713–2719
Cornuet, J.-M., Ravigné, V., Estoup, A. (2010) Inference on population history and model checking using DNA sequence and microsatellite data with the software DIYABC (v1. 0). BMC Bioinforma. 11 (1), 401 Dabney, A., Storey, J.D., P.R.S. qvalue Tutorial, Install, R.,
Packages, I.B., et al. (2004) Q-value estimation for false discovery rate control. Medicine 344 , 539–548 De la Rúa, P., Galián, J., Serrano, J., Moritz, R.F.A. (2001)
Genetic structure and distinctness of Apis mellifera L. populations from the Canary Islands. Mol. Ecol. 10 (7), 1733–1742
De la Rúa, P., Galián, J., Serrano, J., Moritz, R.F.A. (2003) Genetic structure of Balearic honeybee populations based on microsatellite polymorphism. Genet. Sel. Evol. 35 (3), 339–350
De la Rúa, P., Galián, J., Pedersen, B.V., Serrano, J. (2006) Molecular characterization and population structure of
Apis mellifera from Madeira and the Azores. Apidologie 37 (6), 699–708
De la Rúa, P., Jaffé, R., Muñoz, I., Serrano, J., Moritz, R.F.A., et al. (2013) Conserving genetic diversity in the honeybee: comments on Harpur et al. (2012). Mol. Ecol. 22 (12), 3208–3210
Delaney, D.A., Meixner, M.D., Schiff, N.M., Sheppard, W.S. (2009) Genetic Characterization of Commercial Honey Bee (Hymenoptera: Apidae) Populations in the United States by Using Mitochondrial and Microsatel-lite Markers. Ann. Entomol. Soc. Am. 102 (4), 666– 673
Earl, D.A., vonHoldt, B.M. (2011) STRUCTURE HAR-VESTER: a website and program for visualizing STRUCTURE output and implementing the Evanno method. Conserv. Genet. Resour. 4 (2), 359–361 Estoup, A., Guillemaud, T. (2010) Reconstructing routes of
invasion using genetic data: why, how and so what? Mol. Ecol. 19 (19), 4113–4130
Estoup, A., Solignac, M., Cornuet, J.-M. (1994) Precise assessment of the number of patrilines and of genetic relatedness in honeybee colonies. Proc. Roy. Soc. B Biol. Sci. 258 (1351), 1–7
Estoup, A., Garnery, L., Solignac, M., Cornuet, J.-M. (1995) Microsatellite variation in honey bee (Apis mellifera L.) populations: hierarchical genetic struc-ture and test of the infinite allele and stepwise mutation models. Genetics 140 (2), 679–695
Evanno, G., Regnaut, S., Goudet, J. (2005) Detecting the number of clusters of individuals using the software STRUCTURE: a simulation study. Mol. Ecol. 14 (8), 2611–2620
Excoffier, L., Estoup, A., Cornuet, J.-M. (2005) Bayesian analysis of an admixture model with mutations and arbitrarily linked markers. Genetics 169 (3), 1727– 1738
Franck, P., Garnery, L., Solignac, M., Cornuet, J.-M. (1998) The origin of West European subspecies of honeybees (Apis mellifera ): new insights from microsatellite and mitochondrial data. Evolution 52 (4), 1119–1134 Franck, P., Garnery, L., Loiseau, A., Oldroyd, B.P.,
Hep-burn, H.R., et al. (2001) Genetic diversity of the hon-eybee in Africa: microsatellite and mitochondrial data. Heredity 86 (Pt 4), 420–430
Garnery, L., Cornuet, J.-M., Solignac, M. (1992) Evolu-tionary history of the honey bee Apis mellifera inferred from mitochondrial DNA analysis. Mol. Ecol. 1 (3), 145–154
Garnery, L., Solignac, M., Celebrano, G., Cornuet, J.-M. (1993) A simple test using restricted PCR-Amplified mitochondrial DNA to study the genetic structure of Apis mellifera L. Experientia 49 (11), 1016–1021 Garnery, L., Franck, P., Baudry, E., Vautrin, D., Cornuet,
J.-M., et al. (1998) Genetic diversity of the west Europe-an honey bee (Apis mellifera mellifera Europe-and A. m. iberica ). I. Mitochondrial DNA. Genet. Sel. Evol. 30 , S31–S47
Goudet, J. (2001) FSTAT 2.9. 3.2, a program to estimate and test gene diversities and fixation indices
Jombart, T. (2008) adegenet: a R package for the multivar-iate analysis of genetic markers. Bioinformatics 24 (11), 1403–1405
Latreille, P.A. (1804) Notice des espèces d’abeilles vivant en grande sociétée, ou d’abeilles proprement dites, et description d’espèces nouvelles. Ann. Mus. Natl. Hist. Nat. 5 , 161–178
Meixner, M.D., Leta, M.A., Koeniger, N., Fuchs, S. (2011) The honey bees of Ethiopia represent a new subspecies of Apis mellifera—Apis mellifera simensis n. ssp. Apidologie 42 (3), 425–437
Meixner, M.D., Pinto, M.A., Bouga, M., Kryger, P., Ivanova, E., et al. (2013) Standard methods for characterising subspecies and ecotypes of Apis mellifera . J. Apic. Res. 52 (4), 1–27
Muñoz, I., Dall’Olio, R., Lodesani, M., De la Rúa, P. (2009) Population genetic structure of coastal Croatian hon-eybees (Apis mellifera carnica ). Apidologie 40 (6), 617–626
Muñoz, I., Stevanovic, J., Stanimirovic, Z., De la Rúa, P. (2012) Genetic variation of Apis mellifera from Serbia inferred from mitochondrial analysis. J. Apic. Sci. 56 (1), 59–69
Nei, M. (1978) Estimation of average heterozygosity and genetic distance from a small number of individuals. Genetics 89 (3), 583–590
North-Coombes, A. (1971) The island of Rodrigues. Mau-ritius, Published by the author, with the assistance of the Mauritius Advertising Bureau
Oldroyd, B.P. (2007) What’s killing American honey bees? PLoS Biol. 5 (6), e168
Pons, O., Chaouche, K. (1995) Estimation, variance and optimal sampling of gene diversity II. Diploid locus. Theor. Appl. Genet. 91 (1), 122–130
Pritchard, J.K., Stephens, M., Donnelly, P. (2000) Inference of population structure using multilocus genotype data. Genetics 155 (2), 945–959
Rasolofoarivao, H., Clémencet, J., Ravaomanarivo, L.H.R., Razafindrazaka, D., Reynaud, B., et al. (2013) Spread and strain determination of Varroa destructor (Acari: Varroidae) in Madagascar since its first report in 2010. Exp. Appl. Acarol. 1–10
Raymond, M., Rousset, F. (2004) GENEPOP version 3.4. Population genetics software for exact tests and ecu-menicism. Laboratoire de Genetique et Environment, Montpellier, France
Rehm, S.M. (1988) Report on the consultancy on bee diseases (Mauritius and Rodrigues), United nations development promgramme, pp. 77
Ruttner, F. (1988) Biogeography and taxonomy of honey-bees. Springer-Verlag
Sheppard, W.S., Meixner, M.D. (2003) Apis mellifera pomonella , a new honey bee subspecies from Central Asia. Apidologie 34 (4), 367–375
Solignac, M., Vautrin, D., Loiseau, A., Mougel, F., Baudry, E., et al. (2003) Five hundred and fifty microsatellite markers for the study of the honeybee (Apis mellifera L.) genome. Mol. Ecol. Notes 3 (2), 307–311 Tamura, K., Peterson, D., Peterson, N., Stecher, G., Nei,
M., et al. (2011) MEGA5: molecular evolutionary genetics analysis using maximum likelihood, evolu-tionary distance, and maximum parsimony methods. Mol. Biol. Evol. 28 (10), 2731–2739
Tarpy, D.R., vanEngelsdorp, D., Pettis, J.S. (2013) Genetic diversity affects colony survivorship in commercial honey bee colonies. Naturwissenschaften 100 (8), 723–728
Thébaud, C., Warren, B.H., Strasberg, D., Cheke, A. (2009) Mascarene islands. Biology 127 , 1–216
Van Oosterhout, C., Hutchinson, W.F., Wills, D.P.M., Ship-ley, P. (2004) Micro-checker: software for identifying and correcting genotyping errors in microsatellite data. Mol. Ecol. Notes 4 (3), 535–538
vanEngelsdorp, D., Meixner, M.D. (2010) A historical review of managed honey bee populations in Eu-rope and the United States and the factors that may affect them. J. Invertebr. Pathol. 103 , S80–S95 vanEngelsdorp, D., Hayes Jr., J., Underwood, R.M., Pettis, J.
(2008) A Survey of Honey Bee Colony Losses in the U.S., Fall 2007 to Spring 2008. PLoS One 3 (12), e4071 Wallberg, A., Han, F., Wellhagen, G., Dahle, B., Kawata, M., et al. (2014) A worldwide survey of genome se-quence variation provides insight into the evolutionary history of the honeybee Apis mellifera . Nat. Genet. 46 (10), 1081–1088
Weir, B.S., Cockerham, C.C. (1984) Estimating F-statistics for the analysis of population structure. Evolution 1358–1370
Whitfield, C.W., Behura, S.K., Berlocher, S.H., Clark, A.G., Johnston, J.S., et al. (2006) Thrice out of Africa: ancient and recent expansions of the honey bee, Apis mellifera . Science 314 (5799), 642–645