HAL Id: hal-00297972
https://hal.archives-ouvertes.fr/hal-00297972
Submitted on 14 Feb 2008HAL is a multi-disciplinary open access
archive for the deposit and dissemination of sci-entific research documents, whether they are pub-lished or not. The documents may come from teaching and research institutions in France or abroad, or from public or private research centers.
L’archive ouverte pluridisciplinaire HAL, est destinée au dépôt et à la diffusion de documents scientifiques de niveau recherche, publiés ou non, émanant des établissements d’enseignement et de recherche français ou étrangers, des laboratoires publics ou privés.
Organic nutrients and excess nitrogen in the North
Atlantic subtropical gyre
A. Landolfi, A. Oschlies, R. Sanders
To cite this version:
A. Landolfi, A. Oschlies, R. Sanders. Organic nutrients and excess nitrogen in the North Atlantic subtropical gyre. Biogeosciences Discussions, European Geosciences Union, 2008, 5 (1), pp.685-724. �hal-00297972�
BGD
5, 685–724, 2008Total nitrogen excess in the North Atlantic
A. Landolfi et al. Title Page Abstract Introduction Conclusions References Tables Figures ◭ ◮ ◭ ◮ Back Close
Full Screen / Esc
Printer-friendly Version Interactive Discussion Biogeosciences Discuss., 5, 685–724, 2008
www.biogeosciences-discuss.net/5/685/2008/ © Author(s) 2008. This work is distributed under the Creative Commons Attribution 3.0 License.
Biogeosciences Discussions
Biogeosciences Discussions is the access reviewed discussion forum of Biogeosciences
Organic nutrients and excess nitrogen in
the North Atlantic subtropical gyre
A. Landolfi1, A. Oschlies1, and R. Sanders2
1
IFM-GEOMAR, Leibniz-Institut f ¨ur Meereswissenschaften, Dusternbrooker Weg 20, 24105 Kiel, Germany
2
National Oceanography Centre, Southampton University, European way, SO14 3ZH, Southampton, UK
Received: 11 December 2007 – Accepted: 24 December 2007 – Published: 14 February 2008 Correspondence to: A. Landolfi (alandolfi@ifm-geomar.de)
BGD
5, 685–724, 2008Total nitrogen excess in the North Atlantic
A. Landolfi et al. Title Page Abstract Introduction Conclusions References Tables Figures ◭ ◮ ◭ ◮ Back Close
Full Screen / Esc
Printer-friendly Version Interactive Discussion Abstract
To enable an accurate estimate of total excess nitrogen (N) in the North Atlantic a new tracer, TNxs, is defined which includes the contribution of organic nutrients to the assessment of N:P stoichiometric anomalies. We estimate the spatial distribution of TNxs within the North Atlantic using data from a trans-Atlantic section across 24.5◦N
5
conducted in 2004. We then employ three different approaches to infer rates of total excess nitrogen accumulation using pCFC-12 derived ventilation ages (a TNxs verti-cal integration, a one end-member and a two-end member mixing model). Despite some variability among the different methods the dissolved organic nutrient fraction always contributes to about half of the TNxs accumulation, which is in the order of
10
9.38±4.18×10¹¹mol N y−1. Here we suggest that neglecting organic nutrients in
stoi-chiometric balances of the marine N and P inventories can lead to systematic errors when estimating a nitrogen excess or deficit relative to the Redfield ratio in the oceans. For the North Atlantic the inclusion of the organic fraction leads to an upward revision of the N supply by N2 fixation to 10.2±6.9×10
11
mol N y−1. This enhanced estimate
15
of nitrogen fixation reconciles the geochemical estimates of N2 fixation derived from
excess nitrate and the direct estimates from N2fixation measurements.
1 Introduction
The oceans contain the largest pool of carbon on the planet accessible on time scales shorter than millennia and are implicated in the regulation of atmospheric CO2through
20
the temperature dependent solubility of CO2in seawater (the solubility pump) and the
sinking of organic matter from the productive surface layers to the deep ocean (the biological pump). The strength of the biological carbon pump is strongly controlled by the bioavailability of nutrients, principally fixed nitrogen (N) and phosphorus (P) in the sunlit surface ocean. Hence, quantifying the processes that control the fluxes of N and
25
BGD
5, 685–724, 2008Total nitrogen excess in the North Atlantic
A. Landolfi et al. Title Page Abstract Introduction Conclusions References Tables Figures ◭ ◮ ◭ ◮ Back Close
Full Screen / Esc
Printer-friendly Version Interactive Discussion important in assessing the role of marine biology in the global carbon cycle. One critical
area where such efforts are required is the subtropical gyres. These extensive areas are estimated to account for half the global export of organic carbon from the surface to the deep ocean (Emerson et al., 2001). For the North Atlantic gyre recent efforts have determined rates of nutrients delivery by means of atmospheric deposition, physical
5
processes (Jenkins, 1988; Jenkins and Goldman, 1985; McGillicuddy et al., 1998; Dietze et al., 2004) and nitrogen fixation (Capone et al., 2005; Gruber and Sarmiento, 1997; Hansell and Carlson, 2001).
Large uncertainties exist in estimates of N2fixation with a significant offset between
direct measurements and indirect geochemical estimates which have been attributed
10
to the different spatial and temporal scales of the two methodologies. Recent direct observations of N2fixation rates are more consistent with geochemical ones (Capone
et al., 2005); however, it is unclear whether this discrepancy has been fully resolved. Geochemical estimates of the large scale distribution and rate of N2fixation have been based upon NO−3 to PO3−4 ratio anomalies (Gruber and Sarmiento, 1997; Hansell et al.,
15
2004; Michaels et al., 1996; Deutsch et al., 2001)(hereafter referred to as M96, GS97, D01 and H04) as compared to the Redfield stoichiometry (16:1) (Redfield et al., 1963) which is assumed to reflect the average N and P demand and composition of marine phytoplankton.
M96 first introduced the concept of the quasi-conservative geochemical tracer
20
N*=[NO−3]−16*[PO 3−
4 ]+2.7 µmol kg
−1, which traces the production or consumption of
nitrate, with a N:P stoichiometry different from the canonical 16:1. The definition of N* has undergone minor modifications by other authors (GS97, D01) and evolved into the concept of excess nitrate (DINxs=[NO−3]−16*[PO
3−
4 ]; H04). Despite the various
pa-rameterizations, N* and DINxs represent the deviation from the 16:1 nutrient ratio and
25
reflect the net impact of processes that add or remove NO−3 or PO3−4 with a N:P sto-ichiometry different from 16:1. Previous geochemical estimates assumed N2 fixation
and denitrification to be the only relevant processes able to alter the Redfield stoichiom-etry; corrections accounting for the small contribution of atmospheric deposition have
BGD
5, 685–724, 2008Total nitrogen excess in the North Atlantic
A. Landolfi et al. Title Page Abstract Introduction Conclusions References Tables Figures ◭ ◮ ◭ ◮ Back Close
Full Screen / Esc
Printer-friendly Version Interactive Discussion been applied a-posteriori (GS97). Using this technique, an excess of nitrate over
phos-phate has been reported for the North Atlantic thermocline waters and N2fixation has
been invoked to explain such stoichiometric anomalies, based on the assumption that N2 fixing organisms have a non-Redfield stoichiometry of N:P=125 (Karl et al., 1992). However, GS97 and Karl et al. (2002) both suggested that the lack of knowledge of
5
the dissolved organic N (DON) and P (DOP) pools limit the accurate determination of the stoichiometric ratios of N and P. For example, processes such as any preferential remineralization of DON, or the selective uptake of PO3−4 w.r.t. NO−3 may cause positive NO−3: PO3−4 anomalies and could lead to erroneous N2fixation estimates. Similarly,
re-cently fixed N by diazotrophs may enter the dissolved organic nutrient pool and hence
10
may not be accounted for in the local N* signal. A major fraction of the nutrient pool of the surface oceans consists of DON and DOP (Jackson and Williams, 1985) and up to half of the recently fixed nitrogen has been observed to be released as DON (Glibert and Bronk, 1994; Mulholland et al., 2004; Capone et al., 1994). Thus neglecting the organic nutrient pools in the stoichiometric balances may adversely affect our
interpre-15
tation of the oceanic processes that involve N and P cycling. In this paper we include the organic nutrient pools in an analysis of excess nitrogen stocks in the upper waters of the north Atlantic subtropical gyre and use them in combination with pCFC-12 de-rived ventilation ages to estimate the production rate of total nitrogen excess and infer N2fixation estimates in this region.
20
1.1 Two new variables: TONxs and TNxs
Building on the concepts of N* and DINxs, two new variables, TONxs and TNxs, are defined as: TONxs=[TON]−16[TOP]; TNxs=DINxs+TONxs=[TN]−16[TP]
The interpretation of TONxs and TNxs is similar to N* (GS97) or DINxs (H04) with the advantage of including the organic nutrient pools and being independent from
dif-25
ferential nutrient remineralization/utilization. TONxs and TNxs represent the distance of a TON and TOP or a TN and TP pair from the mean oceanic trend line of 16:1. In the
BGD
5, 685–724, 2008Total nitrogen excess in the North Atlantic
A. Landolfi et al. Title Page Abstract Introduction Conclusions References Tables Figures ◭ ◮ ◭ ◮ Back Close
Full Screen / Esc
Printer-friendly Version Interactive Discussion simple case of an ocean in hypothetical Redfield equilibrium, where terrestrial inputs
of N and P are in steady state, preformed TNxs would be zero. Note that even when TNxs=0 a positive or negative DINxs and TONxs could occur however they would need to balance. The development of a positive (or negative) TNxs values simply imply an excess (or a deficit) of N with respect to P relative to a Redfield ocean. For these
de-5
viations to occur, only the net input or removal of N and P matter. Organic-inorganic nutrient transformations that would affect DINxs and TONxs development with opposite sign do not affect TNxs. TNxs is insensitive to differential remineralization and accumu-lation of dissolved refractory material; therefore it unambiguously reflects only the net non-Redfieldian sources and sinks of the marine N and P inventories. For example, a
10
positive TNxs anomaly would reflect a net excess of N over P due to N2fixation, atmo-spheric deposition or excess P loss. Similarly negative TNxs anomaly would indicate losses of fixed nitrogen by denitrification and anammox or export of organic matter deviating from Redfield stoichiometry. We now calculate TNxs and TONxs for the N Atlantic subtropical gyre and use these data in combination with transient tracer data
15
to estimate the rate of excess total nitrogen accumulation and infer rates of nitrogen fixation in the North Atlantic subtropical gyre.
2 Methods
The North Atlantic subtropical gyre was surveyed along the nominal latitude of 24.5◦N in April–May 2004 on board RRS Discovery on cruise D279 (Fig. 1). During D279, 125
20
full depth CTD stations were occupied. At each station up to 24 water samples were collected in Niskin bottles for the analysis of oxygen, salinity, nitrate, silicate, phosphate and total organic nutrients (TON and TOP).
Unfiltered samples for inorganic nutrients (NO−3+NO−2 hereafter nitrate, PO 3− 4
here-after phosphate, and Si(OH)4 hereafter silicate) were collected from all bottles on all
25
the CTD casts. Inorganic nutrient concentrations were measured immediately on board using a Skalar San Plus autoanalyser according to standard colorimetric techniques
BGD
5, 685–724, 2008Total nitrogen excess in the North Atlantic
A. Landolfi et al. Title Page Abstract Introduction Conclusions References Tables Figures ◭ ◮ ◭ ◮ Back Close
Full Screen / Esc
Printer-friendly Version Interactive Discussion (Kirkwood et al., 1996). The analytical precision, based on the coefficient of variation
(CV) of replicate analysis of a single sample, was 1.1% for nitrate and 0.9% for phos-phate. The detection limit of the analyses, calculated as three times the noise of the baseline, was 0.1 µM for nitrate and 0.01 µM for phosphate.
Samples for TON and TOP analysis were carefully collected directly from Niskin
5
bottles into 60-ml sterile high-density polythene bottles. Sample bottles were rinsed with three times their own volume of sample and immediately frozen. Total nitrogen (TN) and (TP) phosphorus were UV oxidized in duplicate replicates to nitrate and solu-ble reactive phosphorus (hereafter phosphate) using high intensity ultraviolet light at a wavelength below 250 nm in a Metrohom UV705 digester according to the method used
10
by Sanders and Jickells (2000). Samples were subsequently analyzed for nitrate and phosphate according to the standard colorimetric techniques using a Skalar San Plus autoanalyser (Kirkwood et al., 1996). The UV lamp oxidation efficiency was checked at every oxidation using a organic compound (adenosin-5monophosphatemonohydrate AMP). The recovery of the AMP compound was 94% for P and 60% for N. Duplicate
15
samples coefficient of variation (CV) was for nitrate, 2% and for phosphate, 7%. Given the low oxidation efficiency of organic nitrogen using the UV method, replicate sam-ples were re-analyzed for TN using the High Temperature Catalytic Oxidation (HTCO). This method is known to have the highest oxidation efficiency for the most refractory compounds (Bronk et al., 2000). HTCO was performed with a Shimadzu 5000A DOC
20
analyser connected in series with an Antek 705E chemiluminescent nitrogen specific detector (Alvarez-Salgado and Miller, 1998). The instruments system and analytical blanks were <1 µMN with a CV of 4%. The instrument detection limit, estimated as three times the SD of the blank (Bronk et al., 2000), was typically 0.12 µMN. The oxi-dation efficiency was monitored using caffeine standard solutions and varied from 96%
25
to 100%. Sample concentrations were not corrected for these recovery estimates. The CV of 4 replicate injections of the samples was typically 2% for N. The accuracy of the HTCO method has been determined by the use of consensus reference (CRM) materials distributed by Dr. Hansell’s laboratory, University of Miami. The accuracy of
BGD
5, 685–724, 2008Total nitrogen excess in the North Atlantic
A. Landolfi et al. Title Page Abstract Introduction Conclusions References Tables Figures ◭ ◮ ◭ ◮ Back Close
Full Screen / Esc
Printer-friendly Version Interactive Discussion N measurements are within 5% of the CRM concentrations.
The organic concentration, TON and TOP, are calculated by subtracting the inorganic concentration (nitrate and nitrite or phosphate) from the total (TN and TP): As each of the measurements has an associated analytical error, TON concentration estimates have an error given by the combined uncertainty of the two analyses TN and DIN:
5 SDTON= q (SD2TDN+ SDDIN 2 ). 3 Results
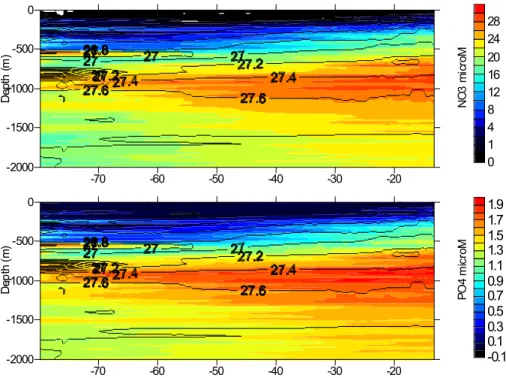
As expected, nitrate and phosphate concentrations increased with depth as the rem-ineralization of organic matter occurs during particle settling (Fig. 2). Nutrient rich waters were closer to the surface on the eastern side of the subtropical gyre,
gen-10
erally following the sloping isopycnals. The highest concentrations of both NO−3 and PO3−4 were associated with low oxygen waters at around 1000 m (data not shown). Dissolved organic nutrient concentrations decreased with depth suggesting a surface ocean TON and TOP source (Fig. 3). A zonal gradient of upper-ocean TON concentra-tions occurs with the highest concentraconcentra-tions found in the western basin. TOP showed
15
a more complex spatial variability. Low surface concentrations possibly indicate TOP utilization, a suggestion corroborated by observed high alkaline phosphatase activi-ties (Landolfi, 2005). Figure 4 shows average vertical profiles of dissolved inorganic and organic N and P. Nitrate and phosphate concentrations increased from the surface to 1000 m where the maximum concentrations reached 25.6±5.8 mmol m−3NO−3 and
20
1.60±0.52 mmol m−3PO3−
4 respectively. Below 1000 m, concentrations became rather
constant, both for nitrate (21.0±0.4 mmol m−3) and phosphate (1.43±0.08 mmol m−3).
Average TON concentrations decreased from surface values of 4.6±1.8 mmol m−3 to 1.7±0.1 mmol m−3at 1000 m and did not vary much below this depth. TOP decreased similarly from 0.11±0.11 mmol m−3near the surface to almost undetectable
concentra-25
BGD
5, 685–724, 2008Total nitrogen excess in the North Atlantic
A. Landolfi et al. Title Page Abstract Introduction Conclusions References Tables Figures ◭ ◮ ◭ ◮ Back Close
Full Screen / Esc
Printer-friendly Version Interactive Discussion 4 Existence of excess N
Positive DINxs anomalies occur across the entire gyre in a limited portion of the water column comprised between 150 and 400 m on the σθ=26–27.5 isopycnals (Fig. 5a).
TON was always in excess with respect to TOP relative to the Redfield ratio throughout the water column due in part to its refractory nature (Fig. 5b). A total positive N excess
5
anomaly, TNxs, occurred in the top 1000 m of the entire transect (Fig. 5c).
From the excess nitrogen profiles (Fig. 6) the vertical contribution of DINxs and TONxs to TNxs development can be resolved. In the top 150 m DINxs exhibited a negative anomaly likely due to the preferential remineralization of TOP. TON exceeded 16×TOP on average by 2.7±0.3 mmol m−3. TONxs decreased to 1.9±0.3 mmol m−3
10
from 150 m to 700 m, possibly contributing about 70–80% to the concomitant increase in DINxs. Below 1000 m, the mean TONxs was 1.4±0.2 mmol m−3N, which closely bal-ances the deep DINxs deficit (−1.4±0.3 mmol m−3). Thus below 1000 m, it is likely that
the TONxs positve anomaly and the DINxs negative anomaly result from the residual (refractory) TON pool left by TOP preferential remineralization. Therefore, the water
15
column can be crudely divided into the upper 1000 m characterised by an N excess (TN positive anomaly) of 2.6±0.6 mmol m−3 and the lower 1000 m where TN and TP are approximately in balance (0.0±0.4 mmol N m−3) w.r.t. the Redfield ratio.
4.1 Processes contributing to DINxs and TONxs development – origin of TN excess The distributions of DINxs, TONxs and TNxs can be rationalized using a conceptual
20
model representing the partitioning between the organic and the inorganic pools in the area studied (Fig. 7). The relative sizes of the inorganic and organic N and P pools will depend on whether organic matter production or remineralization is more efficient. However, the transformations and redistribution of N and P within the organic and inorganic fractions do not alter the concentrations of the total inventories (TN and
25
TP) and thus TNxs. The following processes govern N:P shifts in the organic and inorganic fractions:
BGD
5, 685–724, 2008Total nitrogen excess in the North Atlantic
A. Landolfi et al. Title Page Abstract Introduction Conclusions References Tables Figures ◭ ◮ ◭ ◮ Back Close
Full Screen / Esc
Printer-friendly Version Interactive Discussion Negative DINex anomalies can result from
– The preferential remineralization of TOP to phosphate compared to the
reminer-alisation of TON to nitrate
– The preferential uptake of NO−3 relative to the uptake of phosphate
– The remineralization of P rich organic matter
5
– Denitrification
Positive DINxs anomalies can result from
– The remineralization of N rich organic matter (including that derived from N2
fixa-tion).
– The preferential remineralization of TON to nitrate relative to the mineralization of
10
TOP to phosphate.
– The preferential uptake of PO3−4 relative to nitrate
– The deposition of low phosphate, high NOx+NH3material from the atmosphere
Positive TONex anomalies can result from
– The preferential remineralisation of TOP to phosphate relative to TON to nitrate
15
– The production of TON rich organic material (including that derived from nitrogen
fixation)
– The deposition of material rich in TON relative to TOP from the atmosphere.
Positive TNxs anomalies result from:
– The deposition of nitrogen rich material from the atmosphere
BGD
5, 685–724, 2008Total nitrogen excess in the North Atlantic
A. Landolfi et al. Title Page Abstract Introduction Conclusions References Tables Figures ◭ ◮ ◭ ◮ Back Close
Full Screen / Esc
Printer-friendly Version Interactive Discussion – The production of N rich organic material (including material derived from nitrogen
fixation)
Preferential remineralization and uptake only redistribute N and P between the inor-ganic and the orinor-ganic pools, they cannot alter their absolute and relative amounts. The processes that are of interest in terms of regulating TNxs are the ones that have an
5
effect on the absolute amount of nutrients (net input or removal of N and P) which alter the TN:TP ratio. As long as the fraction of sinking particles that undergo differ-ential remineralization and fall out of the area of interest (0–1000 m) is small, the ratio between the N and P inventories in the ocean can be unambiguously diagnosed by TNxs. Any net excess or deficit of nitrogen relative to the expected concentration of
10
phosphorus derived using the Redfield Ratio will be reflected in the development of TNxs.
4.2 Rates of accumulation of total nitrogen excess
Here we attempt to estimate TNxs accumulation using several techniques. 4.2.1 One end-member mixing model – vertical integration
15
Firstly, we use the distribution of N excess in combination with the pCFC-12 transient tracer distribution at each data point to infer the water-column-integrated TNex devel-opment rate. The pCFC-12 data collected during D279 has been kindly provided by Dr. Rana Fine at RSMAS/MAC, University of Miami.
We first assume a one end member mixing model where the end member age
rep-20
resents the time since the water mass has been ventilated. The accumulation rate of TNxs since the water particle has left the surface is:
∆TNxs
∆t =
TNxst− TNxso
BGD
5, 685–724, 2008Total nitrogen excess in the North Atlantic
A. Landolfi et al. Title Page Abstract Introduction Conclusions References Tables Figures ◭ ◮ ◭ ◮ Back Close
Full Screen / Esc
Printer-friendly Version Interactive Discussion and the water column integrated accumulation rate is:
z
Z
o
∆TNxs
∆t d z (2)
TNxs0represents the preformed end member TNxs value and to is the time at which
the water mass is in contact with the atmosphere and is set to zero.
TNxs and pCFC-12 age were measured at different casts and different depths. To
5
improve the match up between TNxs and pCFC-12 age data a linear interpolation of pCFC-12 age and TNxs along a constant depth grid was carried out. Shallow (σθ.26)
pCFC-12 age data are characterized by a larger uncertainty relative to the deep ther-mocline, due to the decrease of atmospheric pCFC-12 after the year 2000. Also, pCFC age represents a model age for air-sea exchange processes and is not ideal for organic
10
matter production as it is zeroed at the surface whereas organic matter, due to its bi-ological origin, will possibly exhibit a seasonal cycle in surface waters. Therefore, for near surface waters (pCFC-12 age <1 yr) the development of TNxs has been conser-vatively been considered to occur on an annual timescale. As no seasonal TNxs data is available any temporal variability of TNxs shorter than a year is difficult to constrain.
15
No TON and TOP concentrations data are available in winter in the North Atlantic where near-surface and thermocline waters ventilation occurs. Therefore, the values measured in spring (Torres-Valdes, personal communication) were taken as preformed values in the regions where the 25, 26, 26.5 and 27 isopycnal outcrop (Table 1).
The 1000 m depth-integrated TNxs development (Fig. 8) indicates a large spatial
20
variability along 24◦N ranging from −0.0013 to 0.43 mol m−2y−1 with the lowest ac-cumulation rates at the gyre margins and in the central region (∼40◦W). This spatial pattern appears anti-correlated with the natural15N isotopic abundance of particulate organic nitrogen collected on the same cruise (Reynolds et al., 2007). On average the TNxs accumulation rate was 0.16±0.12 mol m−2y−1. DINxs accumulation rates
25
ranged from −0.074 (the negative sign indicates a decrease of DINxs from the orig-inal water mass) to 0.05 mol m−2y−1. The largest contribution to the development of
BGD
5, 685–724, 2008Total nitrogen excess in the North Atlantic
A. Landolfi et al. Title Page Abstract Introduction Conclusions References Tables Figures ◭ ◮ ◭ ◮ Back Close
Full Screen / Esc
Printer-friendly Version Interactive Discussion TNxs comes from the development of TONxs which occurs with an average rate of
0.13±0.10 mol m−2y−1. If the total nitrogen accumulation rate is representative of the region extending from 15◦N to 25◦N and 25◦W to 75◦W (6.83×10¹²m2) then the areal accumulation rate would be of the order of 1.09±0.81×10¹²mol y−1 where the large range derives form the observed large spatial variability.
5
It could be argued that the farfield lateral advection of N rich organic matter from the tropics to the subtropical gyre is not accounted for in the preformed TNxs calcu-lation. The lateral Ekman advection of inorganic nutrients and organic matter from the tropics into the North Atlantic subtropical gyre has been diagnosed to provide 0.047 mol m−2y−1 and 0.92 mmol m−2y−1 for TON and TOP (Mahaffey et al., 2004)
10
and 0.005 mol m−2y−1 and 0.14 mmol m−2y−1 for nitrate and phosphate, respectively.
These fluxes would cause positive TONxs and DINxs anomalies of 0.032 mol m−2y−1 and 0.0028 mol m−2y−1, respectively. Subtracting these “advective” positive anoma-lies in the upper 100m reduces the estimate of TNxs development by ∼20% to 0.13±0.12 mol m−2y−1and the areal estimate to 8.72±8.11×10¹¹mol y−1.
15
4.2.2 One-end member mixing model – ventilation rates
To gain confidence in the above areal estimate and bypass our inability to accurately determine the TONxs turnover in the near-surface waters (pCFC-12 age <1 yrs) where pCFC age measurements are associated with a large uncertainties, the total nitrogen accumulation rate has also been estimated from the independently estimated
ventila-20
tion rates of the North Atlantic water masses. A similar approach has recently been used by Hansell et al. (2007) to investigate the excess inorganic nitrogen accumulation (DINxs). For each datapoint, TNxs values (DINxs + TONxs) have been corrected for their preformed concentrations and multiplied by the ventilation rate of the correspond-ing density class taken from Qiu and Huang (1995) (Table 2).
25
If TNxs passively accumulates along the gyre circulation on each isopycnal surface one would expect maximum concentrations to occur near the western boundary with increased ageing of the water as shown in the cartoon Fig. 9. This can be observed
BGD
5, 685–724, 2008Total nitrogen excess in the North Atlantic
A. Landolfi et al. Title Page Abstract Introduction Conclusions References Tables Figures ◭ ◮ ◭ ◮ Back Close
Full Screen / Esc
Printer-friendly Version Interactive Discussion for DINxs, on the density range 26<σθ<26.6, (Figs. 10, 11) and only on isopycnals
σθ<26.6 for TONxs (Fig. 11). On isopycnals σθ>26.6 mixing with low preformed DINxs of southern Atlantic water masses can possibly explain DINxs patterns west of 60◦W. On the intermediate and surface layers TONxs accumulation is also affected by “local’ processes which have time scales shorter than the gyre circulation (Figs. 10, 11).
5
The annual accumulation of N in the study area has been estimated from the concen-tration range of TNxs at the ventilation site and the site at the end of the gyre circulation pattern (as in Fig. 9) (maximum) value in Table 2, section average values are shown for comparison. However, we acknowledge that mixing with other water masses with different preformed TNxs values can lead to deviations in the TNxs gradient, therefore
10
more than one end-member could improve the estimates of the mixing model (see below). Also, the variability due to shorter timescales (than the times scale of gyre circulation) is not resolved by this method.
Summing up the contribution of all isopycnals (Table 2), the annual accumulation of TNxs is 9.38±4.18×10¹¹mol y−1. At least 40% of this is due to organic nitrogen
15
(3.70±3.26×10¹¹mol y−1). Low surface ventilation rates limit the importance of TONxs development as compared to the estimate obtained by the vertical integration method. Overall, the two areal estimates (from the vertical integration and the one end-member mixing using literature ventilation rates) are in relatively good agreement. Despite the large uncertainties this gives us some confidence regarding the size of annual
produc-20
tion of total excess nitrogen in the North Atlantic. This areal estimate is up to 1.6 times larger then the inorganic estimate reported by Hansell et al. (2007) and would lie at the lower end of their range (6.1−8.3×10¹¹mol y−1) if only DINxs accumulation rate
(5.68±0.82×10¹¹mol y−1) was considered. 4.2.3 Two end member isopycnal mixing model
25
We now use an isopycnal two end-member mixing model, following H04 to estimate rates of development of DINex and TONex on specific isopycnal layers. The basic as-sumption is that transport occurs along isopycnal surfaces and that the mixing on any
BGD
5, 685–724, 2008Total nitrogen excess in the North Atlantic
A. Landolfi et al. Title Page Abstract Introduction Conclusions References Tables Figures ◭ ◮ ◭ ◮ Back Close
Full Screen / Esc
Printer-friendly Version Interactive Discussion isopycnal surface can be described by a two end-member mixing model. As a water
parcel is transported away from its original location it loses its original properties (one end-member mixing model) and mixes with other water masses (two end-member mix-ing model). This mixmix-ing can be monitored and quantified usmix-ing a conservative tracer. The production or consumption of a non-conservative property can be quantified as the
5
difference between the measured concentration and the value of the property expected if only linear mixing occurred (preformed value). This technique was used to calculate the non-conservative development of N* (GS97) and DINxs (H04) on specific isopycnal surfaces, allowing for the effect of elevated N/P ratios of organic matter released by N2
fixers.
10
In the North Atlantic the depths of maximum DINxs and N* development coincide with the σθ=26.2–27.2 kg m−3 isopycnal surfaces (Fig. 5). These potential density surfaces
represent the subtropical and subpolar mode waters respectively.
The distribution of potential temperature, pCFC-12 ages, DINxs and TONxs on three isopycnal surfaces is used to infer the rates of DINxs and TONxs production. The
15
two end member water masses used for the calculation were the Northern Component (NC) and the Southern Component (SC) described in H04. The end member reference values for potential temperature, DINxs and pCFC-12 ages are indicated in Table 1. Waters entering these isopycnal surfaces from the north and from the south have low preformed values of N* and DINxs (H04) (Table 1). The subtropical gyre imports low
20
TONxs waters from the South Atlantic (Torres-Valdes, personal communication) and positive TONxs from the north where ventilation of the σθ=25–27 isopycnals occur
(Table 1).
Preformed values were calculated using potential temperature as a conservative tracer on the σθ=26, 26.5 and 27 (kgm−3) isopycnal layers following Takahashi et
25
al. (1985):
f a = (θb − θm)
(θb − θa); f a + f b = 1 (3)
BGD
5, 685–724, 2008Total nitrogen excess in the North Atlantic
A. Landolfi et al. Title Page Abstract Introduction Conclusions References Tables Figures ◭ ◮ ◭ ◮ Back Close
Full Screen / Esc
Printer-friendly Version Interactive Discussion region, θa and θb are the potential temperatures of the two end members and θm
is the measured potential temperature. The preformed concentrations of DINxs were obtained for a two end member mixing model as follows:
DINxspreformed = f a • DINxsa+ f b • DINxsb (4)
where DINxsa and DINxsb are the preformed values of the DINxs in the a an b
com-5
ponents, respectively. The same approach has been used to obtain preformed TONxs concentrations. The difference between preformed DINxs and the measured value of DINxs accounts for the non-conservative development of DINxs.
Rates for DINxs and TONxs development were computed at the western and eastern extremes of the 24.5◦N section (24.5◦N, 65.4◦W and 24.7◦N, 22.8◦W) to coincide with
10
the beginning and the end of the gyre circulation; these sites also match the analyses made by H04. Results of the preformed values of DINxs and TONex are reported in Table 3. Measured DINxs and TONxs at the two locations are reported in Table 4. Rates of change of DINxs and TONxs were calculated from the differences between the respective preformed and measured values over the time since the water parcels
15
left its end member location (pCFC-12 age difference) (Table 5).
On the eastern side of the gyre, the isopycnal surface σθ=26 broadly coincided with the northern component so no measurable ageing occurred since the water mass left the end member location. The σθ=26 surface was deep enough (163 m) to experience
both DINxs and TONxs development on the western side. The accumulation rates of
20
DINxs on the σθ=26.5 surface in the two regions are comparable, indicating that a two
end-member model is a good approximation of water mass mixing on this isopycnal. From this analysis TONxs appears to decrease on the σθ=26.5 isopycnal possibly con-tributing about 60% to the observed DINxs build up. The accumulation rate of TONxs appears to be influenced by local processes (Fig. 10), which have time scales shorter
25
than the gyre circulation. These events are not accounted for with this two end-member approach. On the deepest surface σθ=27, the positive DINxs anomaly vanished at the western end but was still visible on the eastern side. This is consistent with the spatial
BGD
5, 685–724, 2008Total nitrogen excess in the North Atlantic
A. Landolfi et al. Title Page Abstract Introduction Conclusions References Tables Figures ◭ ◮ ◭ ◮ Back Close
Full Screen / Esc
Printer-friendly Version Interactive Discussion extension of DINxs reported by H04. On the contrary, TONxs accumulation shows the
largest rates on the western side.
The contribution of the organic N fraction to the total N excess is ∼60% on the shal-lowest isopycnal, zero on the intermediate one and it ranges from 30–100% on the deepest isopycnal. The rates of maximum DINxs accumulation on the three isopycnals
5
amount to 0.47±0.48 mmol m−3y−1. If the contribution of the σθ=27 isopycnal, with
its relatively small DINxs accumulation and large age-associated errors is excluded then this estimate becomes 0.46±0.27 mmol m−3y−1. This estimate is lower but con-sistent with those reported by H04 of, 0.56±0.40 mmol m−3y−1. Adding the contribu-tion of maximum TONxs accumulacontribu-tion increases to the total N excess accumulacontribu-tion
10
to 0.93±0.46 mmol m−3y−1 and implies an average contribution of TONxs to TNxs of
∼50%.
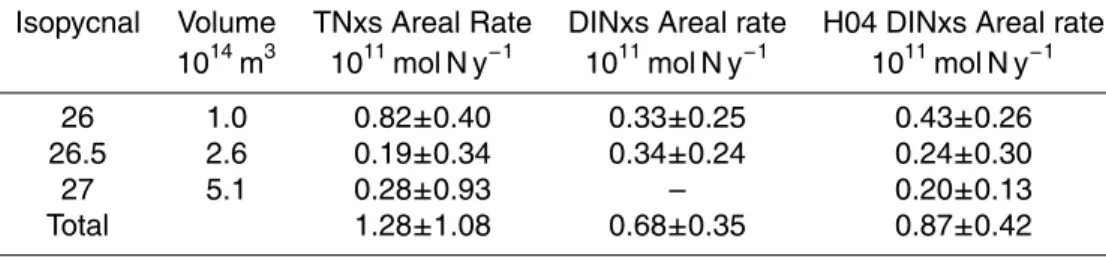
It is possible to estimate the areal N excess from the three isopycnal volumes re-ported in H04 (Table 6). For the area extending from 15◦N to 25◦N and 25◦W to 75◦W,
the net N excess (TNxs) amounts to 1.28±1.10×10¹¹mol y−1while the inorganic
nitro-15
gen excess is 0.68±0.35×10¹¹mol y−1. In this estimate, given the large uncertainty of DINxs on σθ=27 the contribution of the last isopycnal has been ignored (Table 6).
The large uncertainties are the outcome of the propagation of the uncertainties of the preformed and the measured DINxs, TONxs and the pCFC-age values. As in H04, this estimate can be extrapolated for all the isopycnals and can be compared
20
with the other areal estimates reported by this study (Table 7). The two end-member mixing model yields the lowest areal rates of TNxs production of the three methods used. It should be noted however that, given the difficulty to constrain pCFC-12 age gradients, the potential density surfaces σθ<25.75 have been omitted from this analysis
and the development of TONxs on shallow layers has not been accounted for in the
25
two end-member model calculations. The usage of a two end-member mixing model has not improved the uncertainty estimate relative to the other two methods, which may be due to an inaccurate choice of the southern component end-member or to the necessity to use more than two end members. Despite the large uncertainties and the
BGD
5, 685–724, 2008Total nitrogen excess in the North Atlantic
A. Landolfi et al. Title Page Abstract Introduction Conclusions References Tables Figures ◭ ◮ ◭ ◮ Back Close
Full Screen / Esc
Printer-friendly Version Interactive Discussion possibility of redefining the end member choice with more data, our data indicate that
the total excess N accumulation, which includes the contribution of TONxs, is about ∼50% larger than the corresponding estimate of DINxs accumulation rate (Table 7) irrespective of the method used. We now consider the likely source of this excess nitrogen and the implications of this result on the nitrogen budget of the subtropical
5
North Atlantic.
4.3 Sources of excess nitrogen
Only non Redfieldian processes which alter the absolute amounts of N and P can affect TNxs. To produce the positive TNxs signal observed in the North Atlantic, these processes must selectively introduce N but not P.
10
Aerosol is known to contain much larger concentrations of nitrate than phosphate (Baker et al., 2003). Estimates of North Atlantic atmospheric deposition range from 0.017 to 0.021 mol Nm−2y−1(Prospero et al., 1996), with areal estimates south of 40◦N amounting to 3×10¹¹mol N y−1 (Duce et al., 1996). Given the high DIN:DIP (>1000) measured in the North Atlantic aerosol at similar latitudes (Baker et al., 2003) this
15
deposition would likely induce a corresponding DINxs anomaly of 2.9×10¹¹mol N y−1, i.e. 24 to 66% of the total N accumulation rate estimated in this study. These estimates do not include the organic nitrogen deposition, which has been reported to represent 35% of the total nitrogen atmospheric input (Cornell et al., 2003). However, the un-certainty in the atmospheric organic phosphorus deposition make a robust estimate of
20
the contribution of atmospheric deposition to the observed build up of TONxs difficult. Here we acknowledge the possibility that it might be a non-trivial source.
The remaining TNxs signal must come from the selective production of N as PON, and/or DON and/or DIN. As processes that selectively introduce DIN, other than at-mospheric deposition, are not known it is reasonable to think that the excess of N
25
originates from the selective introduction of either PON or DON.
It has been suggested (Hansell et al., 2007) that Synechococcus and Prochlorococ-cus, which have an elevated N:P (Heldal et al., 2003) have the potential to contribute
BGD
5, 685–724, 2008Total nitrogen excess in the North Atlantic
A. Landolfi et al. Title Page Abstract Introduction Conclusions References Tables Figures ◭ ◮ ◭ ◮ Back Close
Full Screen / Esc
Printer-friendly Version Interactive Discussion to the TNxs signal observed. Here we attempt to estimate the potential contribution of
the most abundant of the two species, Prochclorococcus, to the accumulation of TNxs. From the reported estimates of cell abundance (105cell ml−1), doubling times (0.5 d−1), N cell content (∼9.4 fg N cell−1) and N:P (21–33)(Heldal et al., 2003) the estimated ex-cess N addition rate would range from 0.19 to 0.45×10¹¹mol N y−1. This amount of
5
excess N is, again, not trivial but is lower then the error reported in our areal estimates. If we assume that the contribution of Synechococcus is of the same order of magnitude as the contribution of Prochlorococcus to TNxs estimates then they can be excluded as major source of TNxs in the North Atlantic.
The other known candidate responsible for introducing PON and DON, is N2fixation.
10
Newly fixed nitrogen enters the marine PON pool as diazotrophic biomass, with a high N:P (LaRoche and Breitbarth, 2005), and evidence supports the release of newly fixed N as DON (Capone et al., 1994; Glibert and Bronk, 1994). Contrary to these observa-tions, the lack of seasonal variability of bulk DON and its stable and enriched isotopic composition measured in the North Atlantic (Knapp et al., 2005; Meador et al., 2007),
15
suggest that DON derived from N2fixation does not accumulate in the bulk DON pool.
This result has lead to hypothesize that surface DON does not originate from N2 fix-ers (Hansell et al., 2007). However, recent evidence of isotopically depleted proteins, high molecular weight (HMW) DON derived from Trichodesmum cultures and bacte-rial nucleic acids (Meador et al., 2007) supports the existence of a small and rapidly
20
cycling HMW DON fraction derived from N2 fixation. If this fraction of fresh DON is
channelled trough the microbial heterotrophic and autotrophic communities (size class 0.2 µm–0.5 µm) (Meador, 2007) it will not accumulate in surface waters. Instead, pi-coplankton grazers can provide a mechanism by which diazotrophic DON is chan-nelled to higher trophic levels. Sloppy feeding and excretion could release isotopically
25
enriched DON back into the water. Therefore, although this mechanistic pathway of diazotrophic DON transfer to higher trophic levels awaits testing, given the low TONxs waters imported from the South Atlantic, N2fixation seems the only possible
BGD
5, 685–724, 2008Total nitrogen excess in the North Atlantic
A. Landolfi et al. Title Page Abstract Introduction Conclusions References Tables Figures ◭ ◮ ◭ ◮ Back Close
Full Screen / Esc
Printer-friendly Version Interactive Discussion contribution of atmospheric deposition from the net TNxs accumulation estimated from
the ventilation method and allowing for the diazotrophic N:P ratio of 40:1, we derive an areal N2 fixation in the order of 10.2±6.9×10
11
mol N y−1. This estimate is larger than the recent geochemical estimates of 4.3×10¹¹ mol N y−1by Hansell et al. (2007), but it is consistent with direct Trichodesmium N2fixation rates from the North Atlantic
5
(16×1011mol N y−1, Capone et al., 2005). The discrepancy with the recent Hansell et al. (2007) paper is not unexpected given the important contribution of TONxs accumu-lation to total N excess, which has been neglected previously.
5 Conclusions
The new geochemical tracer TNxs incorporates the contribution of organic nutrients to
10
assess the stoichometric anomalies of the marine N and P pools. This tracer indicates that the inclusion of organic nutrients significantly increases the estimate of excess nitrogen inputs into the North Atlantic subtropical gyre by about 50. Given that the waters from the South Atlantic transferred into the North Atlantic have low TNxs values, the build up of this TNxs signal must be occurring in the North Atlantic. The two most
15
likely processes responsible for this signal are atmospheric deposition and N2fixation.
The DINxs signal due to atmospheric deposition has been determined with reasonable accuracy; however the atmospheric organic nitrogen excess deposition to the ocean is unclear and it may be that the remainder of the TNxs signal is associated with this. Until the atmospheric deposition of the organic nutrient fraction TONxs is also defined more
20
accurately, the best possible candidate to make up for the rest of the TNxs observed is N2fixation. Consequently an upward estimate of N2fixation emerges; this estimate
can reconcile the recent geochemical and direct N2fixation estimates.
Acknowledgements. We thank R. A. Fine for providing CFC data and S. Torres-Valdes for
making the nutrient AMT data available to us. Thanks to W. Koeve for his comments on the
25
BGD
5, 685–724, 2008Total nitrogen excess in the North Atlantic
A. Landolfi et al. Title Page Abstract Introduction Conclusions References Tables Figures ◭ ◮ ◭ ◮ Back Close
Full Screen / Esc
Printer-friendly Version Interactive Discussion References
Alvarez-Salgado, X. A. and Miller, A. E. J.: Simultaneous determination of dissolved organic carbon and total dissolved nitrogen in seawater by high temperature catalytic oxidation: Con-ditions for precise shipboard measurements, Mar. Chem., 62, 325–333, 1998.
Baker, A. R., Kelly, S. D., Biswas, K. F., Witt, M., and Jickells, T. D.: Atmospheric
5
deposition of nutrients to the atlantic ocean, Geophys. Res. Lett., 30(24), 2296, doi:10.1029/2003GL018518, 2003.
Bronk, D. A., Lomas, M. W., Glibert, P. M., Schukert, K. J., and Sanderson, M. P.: Total dissolved nitrogen analysis: Comparisons between the persulfate, uv and high temperature oxidation methods, Mar. Chem., 69, 163–178, 2000.
10
Capone, D. G., Ferrier, M. D., and Carpenter, E. J.: Amino-acid cycling in colonies of the plank-tonic marine cyanobacterium trichodesmium-thiebautii, Appl. Environ. Microb., 60, 3989– 3995, 1994.
Capone, D. G., Burns, J. A., Montoya, J. P., Subramaniam, A., Mahaffey, C., Gunderson, T., Michaels, A. F., and Carpenter, E. J.: Nitrogen fixation by trichodesmium spp.: An
impor-15
tant source of new nitrogen to the tropical and subtropical north atlantic ocean, Global Bio-geochem. Cy., 19, GB2024, doi:2010.1029/2004GB002331, 2005.
Cornell, S. E., Jickells, T. D., Cape, J. N., Rowland, A. P., and Duce, R. A.: Organic nitrogen de-position on land and coastal environments: A review of methods and data, Atmos. Environ., 37, 2173–2191, 2003.
20
Deutsch, C., Gruber, N., Key, R. M., Sarmiento, J. L., and Ganachaud, A.: Denitrification and n2fixation in the pacific ocean, Global Biogeochem. Cy., 15, 483–506, 2001.
Dietze, H., Oschlies, A., and Kahler, P.: Internal-wave-induced and double-diffusive nutrient fluxes to the nutrient-consuming surface layer in the oligotrophic subtropical north atlantic, Ocean Dynam., 54(1), doi:10.1007/510236-003-0060-9, 2004.
25
Duce, R. A., Liss, P. S., Merrill, J. T., Atlas, L. L., Buat-Menard, P., Hicks, B. B., Miller, J. M., Prospero, J. M., Arimoto, R., Church, T. M., Ellis, W., Galloway, J. N., Hansen, L., Jickells, T. D., Knap, A. H., Reinhardt, K. H., Schneider, B., Soudine, A., Tokos, J. J., Tsunogai, S., Wollast, R., and Zhou, M.: The atmospheric input of trace species to the world ocean, Global Biogeochem. Cy., 5, 193–259, 1991.
30
Emerson, S., Mecking, S., and Abell, J.: The biological pump in the subtropical north pacific ocean: Nutrient sources, redfield ratios, and recent changes, Global Biogeochem. Cy., 15,
BGD
5, 685–724, 2008Total nitrogen excess in the North Atlantic
A. Landolfi et al. Title Page Abstract Introduction Conclusions References Tables Figures ◭ ◮ ◭ ◮ Back Close
Full Screen / Esc
Printer-friendly Version Interactive Discussion 535–554, 2001.
Glibert, P. M. and Bronk, D. A.: Release of dissolved organic nitrogen by marine diazotrophic cyanobacteria, trichodesmium spp., Appl. Environ. Microb., 60, 3996–4000, 1994.
Gruber, N. and Sarmiento, J. L.: Global patterns of marine nitrogen fixation and denitrification, Global Biogeochem. Cy., 11, 235–266, 1997.
5
Hansell, D. A., Bates, N. R., and Olson, D. B.: Excess nitrate and nitrogen fixation in the north atlantic ocean, Mar. Chem., 84, 243–265, 2004.
Hansell, D. A. and Carlson, C. A.: Biogeochemestry of total organic carbon and nitrogen in the sargasso sea: Control by convective overturn, Deep-Sea Res. Pt. II, 48, 1649–1667, 2001. Hansell, D. A., Olson, D. B., Denter, F., and Zamora, L. M.: Assesment of
ex-10
cess nitrate develomnet in the subtropical north atlantic, Mar. Chem., 106, 562–579, doi:10.1016/j.marchem.20070605, 2007.
Heldal, M., Scanlan, D. J., Norland, S., Thingstad, F., and Mann, N. H.: Elemental composition of single cells of various strains of marine prochlorococcus and synechococcus using x-ray microanalysis, Limnol. Oceanogr., 48, 1732–1743, 2003.
15
Jackson, G. A. and Williams, P. M.: Importance of dissolved organic nitrogen and phosphorus to biological nutrient cycling, Deep-Sea Res., 32, 223–235, 1985.
Jenkins, W. J. and Goldman, J. C.: Seasonal oxygen cycling and primary production in the sargasso sea, J. Mar. Res., 43, 465–491, 1985.
Jenkins, W. J.: Nitrate flux into the euphotic zone near bermuda, Nature, 331, 521–523, 1988.
20
Karl, D., Michaels, A., Bergman, B., Capone, D., Carpenter, E., Letelier, R., Lipschultz, F., Paerl, H., Sigman, D., and Stal, L.: Dinitrogen fixation in the world’s oceans, Biogeochemistry, 57, 47–98, 2002.
Karl, D. M., Letelier, R., Hebel, D. V., Bird, D. F., and Winn, C. D.: Trichodesmium blooms and new production in the north pacifc gyre, in: Marine pelagic cyanobacteria: Trichodesmium
25
and other diazotrophs, edited by: Carpenter, E. J., Kluwer Academic Publishers, Dordrecht, 219–237, 1992.
Kirkwood, D. S., Aminot, A., and Carlberg, S. R.: The 1994 quasimeme laboratory performance study: Nutrients in seawater and standard solutions, Mar. Pollut. Bull., 32, 640–645, 1996. Knapp, A. N., Sigman, D. M., and Lipschultz, F.: N isotopic composition of dissolved organic
30
nitrogen and nitrate at the bermuda atlantic time-series study site, Global Biogeochem. Cy., 19, GB1018, doi:1010.1029/2004GB002320, 2005.
olig-BGD
5, 685–724, 2008Total nitrogen excess in the North Atlantic
A. Landolfi et al. Title Page Abstract Introduction Conclusions References Tables Figures ◭ ◮ ◭ ◮ Back Close
Full Screen / Esc
Printer-friendly Version Interactive Discussion otrophic gyres, PhD thesis, National Oceanography Centre, University of Southampton,
Southampton, 2005.
LaRoche, J. and Breitbarth, E.: Importance of the diazotrophs as a source of new nitrogen in the ocean, J. Sea Res., 53, 67–91, 2005.
Mahaffey, C., Williams, R. G., Wolff, G. A., and Anderson, W. T.: Physical supply of
ni-5
trogen to phytoplankton in the atlantic ocean, Global Biogeochem. Cy., 18, GB1034, doi:10.1029/200368002129, 2004.
McGillicuddy, D. J., Robinson, A. R., Siegel, D. A., Jannasch, H. W., Johnson, R., Dickeys, T., McNeil, J., Michaels, A. F., and Knap, A. H.: Influence of mesoscale eddies on new production in the sargasso sea, Nature, 394, 263–266, 1998.
10
Meador, T. B., Aluwihare L. I., and Mahaffey, C.: Isotopic heterogeneity and cycling of organic nitrogen in the oligotrophic ocean, Limnol. Oceanogr., 52, 934–947, 2007.
Michaels, A. F., Olson, D., Sarmiento, J. L., Ammerman, J. W., Fanning, K., Jahnke, R., Knap, A. H., Lipschultz, F., and Prospero, J. M.: Inputs, losses and transformations of nitrogen and phosphorus in the pelagic north atlantic ocean, Biogeochemistry, 35, 181–226, 1996.
15
Mulholland, M. R., Bronk, D. A., and Capone, D. G.: Dinitrogen fixation and release of am-monium and dissolved organic nitrogen by trichodesmium ims101, Aquat. Microb. Ecol., 37, 85–94, 2004.
Prospero, J. M., Barrett, K., Church, T., Dentener, F., Duce, R. A., Galloway, J. N., Levy, H., Moody, J., and Quinn, P.: Atmospheric deposition of nutrients to the north atlantic basin,
20
Biogeochemistry, 35, 27–73, 1996.
Qiu, B. and Huang, R. X.: Ventlation of the north atlantic and north pacific: Subduction versus obduction, J. Phys. Oceanogr., 25, 2374–2390, 1995.
Redfield, A. C., Ketchum, B. H., and Richards, F. A.: The influence of organisms on the com-position of sea water, in: The sea, edited by: Ed, M. N. H., 26–77, 1963.
25
Reynolds, S. E., Mather, R. L., Wolff, G. A., Williams, R. G., Landolfi, A., Sanders, R., and Woodward, E. M. S.: How widespread and important is n2 fixation in the atlantic ocean?, Global Biogeochem. Cycles, 21, GB4015, doi:10.1029/2006GB002886, 2007.
Sanders, R. and Jickells, T.: Total organic nutrients in drake passage, Deep-Sea Res. Pt I, 47, 997–1014, 2000.
30
Takahashi, T., Broecker, W. S., and Langer, S.: Redfield ratio based on chemical data from isopycnal surfaces, J. Geophys. Res., 90, 6907–6924, 1985.
BGD
5, 685–724, 2008Total nitrogen excess in the North Atlantic
A. Landolfi et al. Title Page Abstract Introduction Conclusions References Tables Figures ◭ ◮ ◭ ◮ Back Close
Full Screen / Esc
Printer-friendly Version Interactive Discussion Table 1. Northern and Southern Component (NC, SC) end-member values of potential
tem-perature, CFC-12 age DINXs and TONxs on selected isopycnal surfaces. End-member values have been estimated from the Atlantic Meridional Transect (AMT) 14 cruise. (SC: average of data points deeper than 50 m from stations 0–10◦S, 24.99◦W; NC: σ
θ26=18.8◦N, 32.3◦W at
50 m; σθ26.5=29.5◦N, 35.2◦W at 130 m; σ
θ27=42◦N, 18.8◦W at 70 m (Torres-Valdes, personal
communication).
Density Potential pCFC-12 AGE DINxs TONxs
kg m−3 Temperature◦C (years) mmol m−3 mmol m−3
NC 26 (25.75–26.25) 21.4 1.3 −0.43 2.2 26.5(26.25–26.75) 18 2.7 −0.25 2.73 27 (26.75–27.25) 12.7 0.3 0.52 2.86 SC 26 (25.75–26.25) 17.8 11.9 −0.43 −0.96 26.5(26.25–26.75) 14 13.9 −0.43 −1.24 27 (26.75–27.25) 8.7 30 1.17 −1.9
BGD
5, 685–724, 2008Total nitrogen excess in the North Atlantic
A. Landolfi et al. Title Page Abstract Introduction Conclusions References Tables Figures ◭ ◮ ◭ ◮ Back Close
Full Screen / Esc
Printer-friendly Version Interactive Discussion Table 2. Average and maximum DINxs and TONxs development in the thermocline and in
surface waters. Ventilation rates have been taken from Qiu and Huang (1995).
Density Ventilation Mean DINxs Max DINxs Mean TONxs Max TONxs (Sv) 1011mol N y−1 1011mol N y−1 1011mol N y−1 1011mol N y−1
<26 1.5 0.02±0.013 0.15±0.16 0.88±0.56 0.87±0.55 26–26.2 2.2 0.43±0.28 0.77±0.10 0.97±0.61 1.09±0.68 26.2–26.4 4 1.66±0.59 1.94±0.35 1.51±0.96 1.98±1.27 26.4–26.6 3.1 1.30±0.46 1.59±0.10 0.50±1.05 0.77±0.24 26.6–26.8 2.3 −0.02±0.29 0.68±0.04 −0.05±0.08 −0.40±0.24 26.8–27 1.4 0.08±0.37 0.38±0.05 −0.05±0.06 −0.30±0.27 27–27.2 0.6 −0.03±0.22 0.13±0.01 −0.02±0.03 −0.30±0.01 Total 3.44±0.97 5.68±0.82 2.53±2.0 3.70±3.26
BGD
5, 685–724, 2008Total nitrogen excess in the North Atlantic
A. Landolfi et al. Title Page Abstract Introduction Conclusions References Tables Figures ◭ ◮ ◭ ◮ Back Close
Full Screen / Esc
Printer-friendly Version Interactive Discussion Table 3. Fraction of SC (F.SO) and NC (F.NO) and preformed DINxs, TONxs and pCFC-12
ages (P.DINxs, P.TONxs and P.CFC-12) along selected isopycnals at western (W) and Eastern (E) locations of the Subtropical gyres.
ST σ F.SO F.NO P.DINxs P.TONxs P.CFC
kgm−3 mmol m−3 mmol m−3 age
W 26.0 0.15 0.85±0.01 −0.43±0.0 1.20±0.08 2.8±0.88 W 26.5 0.07 0.93±0.01 −0.26±0.01 2.43±0.05 3.53±0.13 W 27.0 0.42 0.54±0.02 1.06±0.02 0.69±0.09 11.60±0.53 E 26.0 0.00 100±0.03 −0.43±0.0 2.21±0.22 – E 26.5 0.22 0.78±0.02 −0.29±0.01 1.86±0.08 5.17±0.23 E 27.0 0.13 0.87±0.17 0.68±0.20 2.23±0.79 8.07±0.52
BGD
5, 685–724, 2008Total nitrogen excess in the North Atlantic
A. Landolfi et al. Title Page Abstract Introduction Conclusions References Tables Figures ◭ ◮ ◭ ◮ Back Close
Full Screen / Esc
Printer-friendly Version Interactive Discussion Table 4. Measured DINxs and TONxs along selected isopycnal surfaces at station 50 (West)
and 108 (East).
ST σθ Depth M. CFC-12 age M.DINxs M.TONxs
kgm−3 (m) (y) mmol m−3 mmol m−3
W 26.0 163 6.13±1.37 0.64±0.034 2.74±0.30 W 26.5 360 14.78±0.61 0.96±0.12 1.63±0.06 W 27.0 700 30.79±1.4 −0.80±0.068 3.62±0.49 E 26.0 20 − −0.176±0.015 2.74±0.22 E 26.5 200 11.23±0.71 0.92±0.37 1.51±0.08 E 27.0 500 24.88±0.46 0.7±0.02 2.25±0.19
BGD
5, 685–724, 2008Total nitrogen excess in the North Atlantic
A. Landolfi et al. Title Page Abstract Introduction Conclusions References Tables Figures ◭ ◮ ◭ ◮ Back Close
Full Screen / Esc
Printer-friendly Version Interactive Discussion Table 5. Estimated rates of Nitrogen accumulation on selected isopycnal layers after
correc-tion for mixing between end members. Uncertainties have been calculated with the standard equation of the error propagation of pCFC-age, preformed and measured DINxs and TONxs.
ST σ D. CFC age Prod.R DINxs Prod.R TONxs Prod R. TNxs kgm−3 (y) mmol m−3y−1 mmol m−3y−1 mmol m−3y−1
W 26.0 3.25±0.81 0.33±0.25 0.47±0.32 0.80±0.41 W 26.5 11.25±0.31 0.11±0.11 −0.07±0.1 0.04±0.14 W 27.0 19.19±0.75 −0.10±0.16 0.15±0.18 0.06±0.18 E 26.0 – – – E 26.5 6.055±0.37 0.13±0.1 −0.06±0.13 0.07±0.16 E 27.0 16.31±0.35 0.002±0.40 0.001±0.5 0.003±0.65
BGD
5, 685–724, 2008Total nitrogen excess in the North Atlantic
A. Landolfi et al. Title Page Abstract Introduction Conclusions References Tables Figures ◭ ◮ ◭ ◮ Back Close
Full Screen / Esc
Printer-friendly Version Interactive Discussion Table 6. Volume of isopycnals as reported by H04 and associated TNxs and DINxs
accumula-tion rate (mol N y−1). DINxs accumulation rate from H04 are reported for comparison.
Isopycnal Volume TNxs Areal Rate DINxs Areal rate H04 DINxs Areal rate 1014m3 1011mol N y−1 1011 mol N y−1 1011 mol N y−1 26 1.0 0.82±0.40 0.33±0.25 0.43±0.26 26.5 2.6 0.19±0.34 0.34±0.24 0.24±0.30 27 5.1 0.28±0.93 – 0.20±0.13 Total 1.28±1.08 0.68±0.35 0.87±0.42
BGD
5, 685–724, 2008Total nitrogen excess in the North Atlantic
A. Landolfi et al. Title Page Abstract Introduction Conclusions References Tables Figures ◭ ◮ ◭ ◮ Back Close
Full Screen / Esc
Printer-friendly Version Interactive Discussion Table 7. Estimates of TNxs and DINxs accumulation rate (mol N y−1
) using different methods within this study. Estimates of DINxs accumulation rate from H04 (ˆ) and H07 (*) are reported for comparison.
Method TNxs rate TNxs Areal Rate DINxs Areal rate DINxs Areal rate
1011mol N y-1 1011mol N y−1 1011mol N y−1
Vertical Integration 0.13±0.12 mol m−2y−1
8.72±8.11 0–3.4 –
Ventilation Rate – 9.38±4.18 5.68±0.82 6.1–8.3*
BGD
5, 685–724, 2008Total nitrogen excess in the North Atlantic
A. Landolfi et al. Title Page Abstract Introduction Conclusions References Tables Figures ◭ ◮ ◭ ◮ Back Close
Full Screen / Esc
Printer-friendly Version Interactive Discussion Fig. 1. Stations occupied during the cruise D279 in April–May 2004.
BGD
5, 685–724, 2008Total nitrogen excess in the North Atlantic
A. Landolfi et al. Title Page Abstract Introduction Conclusions References Tables Figures ◭ ◮ ◭ ◮ Back Close
Full Screen / Esc
Printer-friendly Version Interactive Discussion -70 -60 -50 -40 -30 -20 -2000 -1500 -1000 -500 0 D e p th ( m ) N O 3 m ic ro M 0 1 4 8 12 16 20 24 28 -70 -60 -50 -40 -30 -20 -2000 -1500 -1000 -500 0 D e p th ( m ) P O 4 m icr o M -0.1 0.1 0.3 0.5 0.7 0.9 1.1 1.3 1.5 1.7 1.9
Fig. 2. Zonal (24.5◦N) distribution of nitrate (a) and phosphate (b) concentrations (m mol m−3)
in the North Atlantic.
BGD
5, 685–724, 2008Total nitrogen excess in the North Atlantic
A. Landolfi et al. Title Page Abstract Introduction Conclusions References Tables Figures ◭ ◮ ◭ ◮ Back Close
Full Screen / Esc
Printer-friendly Version Interactive Discussion Fig. 3. Zonal (24.5◦N) distribution of TON (a) and TOP (b) concentrations (m mol m−3) in the
North Atlantic.
BGD
5, 685–724, 2008Total nitrogen excess in the North Atlantic
A. Landolfi et al. Title Page Abstract Introduction Conclusions References Tables Figures ◭ ◮ ◭ ◮ Back Close
Full Screen / Esc
Printer-friendly Version Interactive Discussion µM TON 0 2 4 6 8 10 0 1000 2000 3000 4000 5000 6000 µM NO3 0 5 10 15 20 25 30 TON avg Nitrate avg µM TOP 0.00 0.05 0.10 0.15 0.20 0.25 D e p th (m) 0 1000 2000 3000 4000 5000 6000 µM PO4 0.0 0.5 1.0 1.5 2.0 2.5 TOP avg Phospate avg
Fig. 4. Average vertical distribution of nitrate and TON (left) and phosphate and TOP (right) (m mol m−3) in the North Atlantic at 24.5◦N.
BGD
5, 685–724, 2008Total nitrogen excess in the North Atlantic
A. Landolfi et al. Title Page Abstract Introduction Conclusions References Tables Figures ◭ ◮ ◭ ◮ Back Close
Full Screen / Esc
Printer-friendly Version Interactive Discussion
Fig. 5. Zonal (24.5◦N) distribution of DINxs (a), TONxs (b) and TNxs (c) (m mol m−3) in the
North Atlantic.
BGD
5, 685–724, 2008Total nitrogen excess in the North Atlantic
A. Landolfi et al. Title Page Abstract Introduction Conclusions References Tables Figures ◭ ◮ ◭ ◮ Back Close
Full Screen / Esc
Printer-friendly Version Interactive Discussion N excess µM N -2 0 2 4 6 0 500 1000 1500 2000 TONxs TNxs DINxs
Fig. 6. Average vertical variation of DINxs, TONxs and TNxs (m mol m−3) measured in the
BGD
5, 685–724, 2008Total nitrogen excess in the North Atlantic
A. Landolfi et al. Title Page Abstract Introduction Conclusions References Tables Figures ◭ ◮ ◭ ◮ Back Close
Full Screen / Esc
Printer-friendly Version Interactive Discussion DINxs < 0: Preferential TOP remineralization and NO3 uptake
DINxs > 0: Preferential TON remineralization, PO4 uptake, and N atmospheric deposition
TONxs > 0: Preferential TOP remineralization, TON production and TON atmospheric deposition
TNxs > 0: N excess (N2 fixation, atmospheric deposition) TNxs = 0: Redfield equilibrium between N and P
150m
1000m
0
µMN
0
µMN
0
µMN
BGD
5, 685–724, 2008Total nitrogen excess in the North Atlantic
A. Landolfi et al. Title Page Abstract Introduction Conclusions References Tables Figures ◭ ◮ ◭ ◮ Back Close
Full Screen / Esc
Printer-friendly Version Interactive Discussion Fig. 8. Depth integrated (1000 m) development rates of TNxs, TONxs and DINxs (mol m−2y−1)
BGD
5, 685–724, 2008Total nitrogen excess in the North Atlantic
A. Landolfi et al. Title Page Abstract Introduction Conclusions References Tables Figures ◭ ◮ ◭ ◮ Back Close
Full Screen / Esc
Printer-friendly Version Interactive Discussion Fig. 9. Cartoon representing the built up of TNxs from the end member location following
the gyre circulation pattern. Winter surface distribution of sigma theta from WOCE data is superimposed. Point A represents the end member location where the outcropping of σθ=26.5– 27 occurs and TNxsArepresents the end member preformed TNxs. At point B the TNxs will be given by the sum of the TNxs developed during the trajectory from point A to point B (TNxsB) on that given isopycnal and the preformed TNxsA. At the end of the gyre circulation pattern, point D, the accumulated TNxs corresponds to the sum of TNxs developed among each step (A, B, C, D) and equals the maximum TNxs developed on that isopycnal. This general scheme is valid for gyre ciculation timescales but remains insensitive to short time scale built up and remineralization of TNxs.
BGD
5, 685–724, 2008Total nitrogen excess in the North Atlantic
A. Landolfi et al. Title Page Abstract Introduction Conclusions References Tables Figures ◭ ◮ ◭ ◮ Back Close
Full Screen / Esc
Printer-friendly Version Interactive Discussion Fig. 10. Covariations of DINxs (blue), TONxs (red) and pCFC-12 on density intervals σθ<26.75
(a), 25.75<σθ<26.25 (b), 26.25<σθ<26.75 (c), 26.75<σθ<27.25 (d), from vertically interpo-lated data. Please note that DINxs, TONxs and TNxs have not been corrected for preformed concentrations and therefore ∆DINxs: ∆age, ∆TONxs: ∆age, and ∆TNxs: ∆age do not repre-sent the real gradients.
BGD
5, 685–724, 2008Total nitrogen excess in the North Atlantic
A. Landolfi et al. Title Page Abstract Introduction Conclusions References Tables Figures ◭ ◮ ◭ ◮ Back Close
Full Screen / Esc
Printer-friendly Version Interactive Discussion
Fig. 11. Spatial variability of the areal annual DINxs (left) and TONxs (right) development (mol N y−1) on specific isopycnal layers calculated using ventilation rates from Qiu and Huang