HAL Id: tel-00350474
https://tel.archives-ouvertes.fr/tel-00350474
Submitted on 6 Jan 2009HAL is a multi-disciplinary open access archive for the deposit and dissemination of sci-entific research documents, whether they are pub-lished or not. The documents may come from teaching and research institutions in France or abroad, or from public or private research centers.
L’archive ouverte pluridisciplinaire HAL, est destinée au dépôt et à la diffusion de documents scientifiques de niveau recherche, publiés ou non, émanant des établissements d’enseignement et de recherche français ou étrangers, des laboratoires publics ou privés.
THE ROLE OF HOST GALAXY KINEMATICS ON
NUCLEAR ACTIVITY
Gaelle Dumas
To cite this version:
Gaelle Dumas. THE ROLE OF HOST GALAXY KINEMATICS ON NUCLEAR ACTIVITY. Astro-physics [astro-ph]. Ecole normale supérieure de lyon - ENS LYON; Liverpool John Moores University, 2008. English. �tel-00350474�
No
d’ordre: 421 Ann´e: 2007
No
Biblioth`eque: 07ENSLO 421
TH `ESE
en vue d’obtenir le grade de
Docteur de l’Universit´e de Lyon - ´Ecole Normale Sup´erieure de Lyon Sp´ecialit´e: Astrophysique
Centre de Recherche Astrophysique de Lyon/Observatoire de Lyon ´Ecole doctorale de Physique et Astrophysique de Lyon
ECOLE NORMALE SUPERIEURE DE LYON
Pr´esent´ee et soutenue publiquement le 18 septembre 2007 par
G
A
ELLE
¨
D
UMAS
T
HE ROLE OF HOST GALAXY KINEMATICS ON NUCLEARACTIVITY
Sous la direction de ERICEMSELLEM ETCAROLE MUNDELL
Apr`es avis de la commission d’examen form´ee de :
Niranjan Thatte Lecturer Rapporteur
Phil James Principal Lecturer Rapporteur
Chris Collins Professor Examinateur
Bruno Guiderdoni Directeur de recherche Examinateur
Eric Emsellem Astronome Directeur
Declaration
The work presented in this thesis was carried out in the Astrophysics Research Institute, Liverpool John Moores University and the Centre de Recherche As-trophysique de Lyon - Observatoire de Lyon, ´Ecole Normale Sup´erieure de Lyon, as part of a joint doctorate co-tutorship. Unless otherwise stated, it is the original work of the author.
While registered as a candidate for the degree of Doctor of Philosophy, for which submission is now made, the author has not been registered as a candi-date for any other award. This thesis has not been submitted in whole, or in part, for any other degree.
Ga¨elle Dumas
Astrophysics Research Institute CRAL - Observatoire de Lyon Liverpool John Moores University 9 Avenue Charles Andr´e Twelve Quays House 69561 Saint Genis Laval Cedex Egerton Wharf France
Birkenhead CH41 1LD UK
September 18, 2007
The copyright of this thesis rests with the author. No quotation from it should be published without his prior written consent and information de-rived from it should be acknowledged © Ga¨elle Dumas (2007).
T
HE
R
OLE OF
H
OST
G
ALAXY
K
INEMATICS
IN
N
UCLEAR
A
CTIVITY
.
Ga¨elle Dumas
Submitted for the degree of Doctor of Philosophy
A
STROPHYSICSR
ESEARCHI
NSTITUTEC
ENTRE DER
ECHERCHEA
STROPHYSIQUE DEL
YON-O
BSERVATOIRE DEL
YONSeptember 18, 2007
Abstract
Most bulge-dominated galaxies host a supermassive black hole and yet ongo-ing nuclear activity is observed in only ∼5% of nearby galaxies. Re-ignition of dormant black holes is therefore required and a key unanswered question is whether the ignition mechanism is related to the galaxy host properties, in particular the fuel transportation mechanisms. The nuclear activity in distant and luminous quasars is related to galaxy interactions and the high-luminosity active galactic nuclei (AGN) are found in giant elliptical galaxies associated with past mergers of lower mass galaxies. In contrast, the low-luminosity AGN, such as the Seyfert galaxies, are not found preferentially in interact-ing systems or in barred galaxies and fuellinteract-ing these low-luminosity AGN re-mains an unsolved problem. Recent results suggest the presence of identifi-able dynamical differences between Seyfert and inactive galaxies in the central kpc regions. Probing the dynamics of Seyfert galaxies requires spectroscopic data and integral-field spectroscopy (IFS) is particularly well-suited to the in-vestigation of complex structures of nearby galaxies. A comprehensive and statistically-significant study of the neutral gas, ionised gas and stellar kine-matics of a well-defined distance-limited sample of Seyfert galaxies paired with control inactive galaxies with carefully matched optical properties was then initiated, using the VLA and the SAURON integral field unit (IFU). This project aims to compare the morphological and kinematic properties of active and inactive galaxies on spatial scales from the outer disk (via radio data) to the inner regions (via optical IFS data).
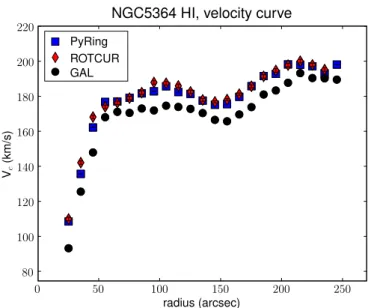
This work first focuses on the optical data. The velocity maps reveal regular stellar kinematics in the circumnuclear regions, while the gaseous kinemat-ics presents some disturbances. A first quantitative analysis of the stellar and gaseous velocity fields was conducted. The result of this analysis is an in-creased incidence of disturbed ionised gas in the circumnuclear regions of the Seyfert galaxies (100 to 10 pc), which could suggest a link between nuclear host dynamics and fuelling mechanisms of the AGN. Radio and optical data were then combined in order to perform global disk kinematic analysis of the galaxies. Although data reduction techniques differ for optical and radio data, similar methods to analyse the two-dimensional velocity fields can be applied to both datasets. Thus a dedicated kinematic tool using Fourier decomposi-tion associated with the tilted-ring method was developed to analyse the HI
velocity fields and the optical (stars and ionised gas) velocity fields for a well-selected subsample of active and inactive galaxies. This study allows one to obtain the velocity curve at large radii as well as in the inner part (r<20!!). The
gaseous kinematic disturbances are then investigated at large and small spatial scales.
R´esum´e
Un trou noir supermassif est pr´esent au centre de la majorit´e des galaxies in-cluant une composante sph´eroidale, dans l’Univers local. Cependant, seule-ment 10 `a 20% de ces galaxies montrent des signes d’activit´e nucl´eaire. Le red´emarrage des processus d’accr´etion sur le trou noir (TN) central de ces galaxies est donc n´ecessaire. Une question importante reste donc de savoir si le r´eveil du TN et les m´ecanismes transportant le gaz vers les r´egions cen-trales sont li´es aux propri´et´es de la galaxie elle-mˆeme. L’´emission centrale des quasars lointains est associ´ee aux ph´enom`enes d’interaction entre ies et les noyaux actifs proches tr`es lumineux se trouvent dans des galax-ies elliptiques g´eantes r´esultant tr`es probablement de la fusion de plusieurs galaxies. Les noyaux actifs peu lumineux, comme les galaxies de Seyfert, ne semblent par contre pas se distinguer des galaxies non-actives en terme d’environnement galactique (companions, interaction) ou de structures namiques (barres). De r´ecents r´esultats sugg`erent l’existence de diff´erences dy-namiques dans le kiloparsec central entre les galaxies de Seyfert et non actives. Des donn´ees spectroscopiques sont n´ecessaires pour ´etudier la dynamique de ces galaxies et la spectroscopie int´egrale de champ (SIC) est bien adapt´ee `a l’´etude des r´egions complexes des galaxies proches. Une ´etude approfondie et statistique de la cin´ematique du gaz neutre, du gaz ionis´e et des ´etoiles a ´et´e men´ee sur un ´echantillon de galaxies de Seyfert associ´ees `a des galaxies non actives de contrˆole avec des propri´et´es optiques similaires, en utilisant le VLA (Very Large Array) et le spectrographe int´egral de champ SAURON mont´e au William Herschel Telescope (WHT). Cette ´etude a pour but de comparer la morphologie et la cin´ematique des galaxies actives et non actives, des r´egions les plus externes (grˆace aux donn´ees radio) jusqu’aux r´egions centrales (grˆace aux donn´ees optiques).
Dans ce travail on s’int´eresse d’abord aux donn´ees optiques. Les champs de vitesses montrent que la cin´ematique des ´etoiles est r´eguli`ere dans les r´egions centrales, alors que les champs de vitesse du gaz pr´esentent des perturba-tions. J’ai conduit une premi`ere analyse quantitative de ces champs de vitesse. On conclut alors que les pertubations cin´ematiques du gaz ionis´e dans les r´egions centrales des galaxies de Seyfert sugg`erent un lien entre la dynamique au centre de la galaxie h ˆote et les m´ecanisme d’alimentation du noyau ac-tif. Nous avons enfin combin´e les donn´ees radio et optique afin d’analyser la cin´ematique du disque galactique dans son ensemble. Bien que les m´ethodes de r´eduction soient diff´erentes pour les donn´ees radio et optique, des tech-niques similaires d’analyse des champs de vitesse peuvent ˆetre appliqu´ees aux deux types de donn´ees. J’ai d´evelopp´e un outil utilisant la d´ecomposition en s´eries de Fourier de la vitesse radiale afin d’analyser les champs de vitesses du gaz atomique HI (donn´ees radio), du gaz ionis´e et des ´etoiles (donn´ees
optiques) de notre ´echantillon de galaxies actives et non-actives. Cette ´etude nous permet d’obtenir la courbe de vitesse `a grande ´echelle jusque dans les r´egions centrales (r<20!!), et ainsi de contraindre le potentiel gravitationnel du
disque galactique dans son entier. Nous pourrons ainsi ´etudier les perturba-vi
tions du gaz sur de grandes et petite ´echelles spatiales, comme les d´eviations par rapport `a un mouvement circulaire, qui pourraient ˆetre directement li´ees `a l’alimentation du noyau actif.
Acknowledgements
Allow me now to name a few people I would like to thank for their help, support and encouragement during these past few years.
First of all, I am very thankful to my English and French supervisors Pr. Carole Mundell and Pr. Eric Emsellem and also to Dr. Pierre Ferruit (my ``second´´ French supervisor) for all their help and support during my PhD. Without them, this PhD project would not have been done in the first place. In par-ticular I thank them deeply for making possible for me to attend international conferences and scientific events during these three years. I want also to men-tion the two institumen-tions that made this dual-award PhD possible: Liverpool John Moores University and the Ecole Normale Sup´erieure de Lyon. Financial support to this co-tutorship thesis has been provided by the Eurodoc program from the Rhˆone-Alpes region and by the French research ministry.
I want also to thank warmly Dr. Phil James and Dr. Niranjan Thatte for ac-cepting to be the examiners of this thesis, and Pr. Chris Collins and Pr. Bruno Guiderdoni, to be part of my thesis ``French´´ jury. The discussions we had during the viva, the French defence and afterwards were very interesting, and I’m looking forward to meeting them again!
Of course I will never forget the staff and students of the CRAL and ARI for all the (non) scientific moments we shared and the friendly atmosphere of both institutes.
In Lyon, I warmly thank the (ex-)Tiger team members and the ``djeuns´´ of the observatory for supporting me (and my moods!) and for helping me all these years! I think especially to Arlette and Manu for the biscuits and the dis-cussions at the coffee breaks. Many thanks to Manu and Xavier who were my successive officemates, and to Xavier, Aur´elien, Nicolas, Manu, Arlette and Fabien for their help on computer issues, thanks to them I’m almost a geek now! My warmest thanks to all the ``djeuns´´ : Emilie, Fabien, Guillaume, Xavier, Aur´elien, Nicolas, Cl´ementine, Dylan, Emeline, PJ, Laure, Ivana, Mina, Johan... We had many great times all these years! Special thanks to Nicolas for the driving and the ’tartiflettes’!
I’m also very grateful to Emilie and Fabien for all the time we spent together. Thank you a lot for you friendship, for having listened to my problems and for having always supported me.
I would like to thank the people from the ARI for their warmth welcome and all the nice time I had during the months I stayed there. I’d like to mention particularly Claire Thomas, Diego Black, Jim Allsopp, Dan Drown, Will Prest-ley, Danae Polychroni (and all the students), Maurizio Salaris, Phil James, Sue Percival, Dan Harman, Chris Simpsom, Chris Collins and Carole Mundell. I’m also thankful to Andr´e Brabin and Jane McCagh who helped me a lot with the administrative papers. Now as far as Clair and Derek (and Katie!) are con-cerned, let me thank you for your welcome, for all the movies and evenings we spent together, for the curries and all the nice moments I had living with you! Many thanks to Danae as well who took me in for a few weeks.
I’m of course very grateful to Gary Mamon and Philippe Mathias for helping me in my first steps in astrophysics research and for encouraging me to con-tinue.
I’m also obliged to the Physics Department and the teaching team of the ENS for their advice and support, especially Bernard Castaing and Francesca Chill`a. Many thanks to Herv´e Gayvallet for his advice and for the complex organi-sation of the pr´epa agreg and thanks a lot to Jerome Cavoret for his infinite patience during the lab sessions! Many thanks to Fanfan and Yohan too. In a more personal level, I’d like to thank M´elanie and the girls from the gym club for sharing so much fun and reminding me two hours per week that there’s not only AGN in life! I also thank deeply my parents and all my family for having supported me during these long studies, helped me and for always believing in me. Many thanks to Momo as well for her help with the English! Finally, the last but not the least, I cannot thank Mathieu enough for all his support, trust and love. Thank you for always being here for me.
Remerciements
Je voudrais remercier ici les diff´erentes personnes qui m’ont aid´ees et en-courag´ees durant ces trois ann´ees de th`ese.
Tout d’abord, je remercie mes deux directeurs de th`ese : Pr. Carole Mundell et Pr. Eric Emsellem, ainsi que Dr. Pierre Ferruit pour toute l’aide qu’ils m’ont apport´ee durant ma th`ese. Sans eux mon projet de th`ese n’aurait jamais vu le jour en premier lieu. Je les remercie en particulier pour m’avoir donn´ee l’opportunit´e de participer `a plusieurs conf´erences internationales. Je leur suis aussi tr`es reconnaissante de m’avoir donn´ee la chance d’effectuer ma th`ese en co-tutelle dans leurs instituts: l’Astrophysics Research Insitute `a Liverpool et l’Observatoire de Lyon. Je remercie aussi les deux universit´es dans lesquelles j’ai effectu´e ce travail de th`ese: l’universit´e John Moores de Liverpool et l’Ecole Normale Sup´erieure de Lyon. Cette th`ese en co-tutelle a ´et´e en partie financ´ee par la bourse Eurodoc de la r´egion Rh ˆone-Alpes et la bourse d’aide `a la mo-bilit´e des doctorants du minist`ere de la recherche.
Je voudrais aussi remercier chaleureusement Dr. Phil James et Dr. Niranjan Thatte pour avoir accept´e d’ˆetre les examinateurs de ma th`ese, ainsi que les deux autres membres de mon jury: Pr. Chris Collins et Pr. Bruno Guiderdoni. Je remercie toutes les personnes qui travaillent au CRAL et `a l’ARI pour tous les moments scientifiques (ou non!) et amicaux que nous avons partag´es.
`
A Lyon, je voudrais surtout remercier l’(ex) ´equipe Tigre et les ``djeuns´´ de l’observatoire pour m’avoir support´ee pendant plus de trois ans! Un grand merci `a Arlette et Manu pour les gateaux et les discussions de la pause caf´e (et les barbecues!). Merci `a Manu et Xavier pour avoir partag´e mes bureaux suc-cessifs. Je voudrais aussi remercier Xavier, Aur´elien, Nicolas, Arlette, Manu et Fabien pour leur aide pr´ecieuse sur les probl`emes informatiques et logi-ciels. Je suis presque une geek maintenant grˆace `a eux! Merci aussi `a tous les ``djeuns´´: Emilie, Fabien, Guillaume, Xavier, Aur´elien, Nicolas, Cl´ementine, Dylan, Laure, PJ, Emeline, Ivana, Mina... pour tous les moments pass´es ensem-ble dans ou en dehors de l’observatoire, pour les repas, fˆetes et autres soir´ees. Un grand merci `a Nico en particulier, pour les tartiflettes et le co-voiturage. Je voulais remercier tout sp´ecialement Emilie et Fabien pour leur amiti´e. Merci beaucoup d’avoir ´ecout´e (patiemment!) tous mes probl`emes et d’avoir tou-jours ´et´e l`a pour m’aider et partager de bon moments!
Je tiens aussi `a remercier toutes les personnes de l’Astrophysics Research In-stitute `a Liverpool pour leur accueil et pour tout le bon temps que j’ai pass´e lorsque j’´etais l`a-bas. Je remercie Andr´e Brabin et Jane McCagh de m’avoir aid´ee pour les d´emarches administratives. Merci aussi `a Claire Thomas, Diego Black, Jim Allsopp, Dan Brown, Will Perstley, Danae Polychroni (et tous les ´etudiants), Maurizio Salaris, Phil James, Sue Percival, Dan Harman, Chris Simpson, Chris Collins et Carole Mundell. Je remercie aussi profond´ement Claire et Derek (et Katie!) qui m’ont accueillie dans leur maison. Merci pour les soir´ees et week-end, les restos et tous les bons moments pass´es ensemble. Merci aussi `a Danae qui m’a recueillie `a la fin de mon s´ejour `a Liverpool. Je voudrais aussi remercier Gary Mamon et Philippe Mathias qui ont accom-pagn´e mes premiers pas dans le monde de la recherche astrophysique et qui m’ont toujours encourag´ee `a continuer dans cette voie.
Je remercie aussi le laboratoire de physique de l’ENS et toutes les personnes de la pr´eparation `a l’agr´egation, pour leurs conseils et encouragements. En particulier, je remercie Bernard Castaing, Francesca Chilla pour leur disponi-bilit´e. Je tiens aussi `a remercier Herv´e Gayvallet qui a toujours r´eussi `a con-cilier l’emploi du temps et nos d´esirs, et J´erˆome Cavoret pour sa patience face `a toutes les questions que j’ai pu lui poser! Un grand merci aussi `a tous mes coll`egues moniteurs, agr´eg´e pr´eparateurs ou autres, en particulier Fanfan et Yoann.
D’un point de vue plus personnel, je voudrais remercier M´elanie et les filles de la gym. Grˆaces `a elles je passais deux heures par semaine merveilleuses et sans penser aux galaxies! Je remercie aussi profond´ement mes parents et toute ma famille pour m’avoir soutenue tout au long de mes (longues) ´etudes et pour toujours avoir cru en moi, quels que soient mes choix. Merci aussi `a Momo pour la relecture de l’Anglais!
Enfin, je voulais profond´ement remercier Mathieu pour ˆetre `a mes cot´es. Merci pour ton soutient, ta pr´esence et ton amour.
GAELLE¨ DUMAS
The most exciting phrase to hear in science, the one that heralds new discoveries, is not ’Eureka!’ (I found it!) but ’That’s funny ...’
Contents
Declaration iii Abstract v R´esum´e vii Acknowledgements ix Remerciements xi Contents xiv List of Tables . . . xxList of Figures . . . xxii
1 Introduction. What are Active Galactic Nuclei? 1 1.1 An observational classification . . . 2
1.1.1 Radio-loud AGN . . . 2
1.1.2 Radio-quiet AGN . . . 5
1.2 Continuum spectrum . . . 7
1.3 Emission lines . . . 9
1.4 Nature of the energy source . . . 12
1.4.1 The super massive black hole paradigm . . . 12
1.4.2 Evidence for a central SMBH . . . 12
1.5 Unifying the AGN. . . 13
1.5.1 The standard model. . . 14 xv
1.5.2 Alternative models. . . 16
2 AGN-galaxy host connection. The fuelling issues. 19 2.1 Evolution of AGN . . . 19
2.2 Fuelling the AGN . . . 20
2.2.1 Galaxy interactions and mergers . . . 22
2.2.2 Internal gravitational instabilities . . . 23
2.3 Two-dimensional kinematics of Seyfert galaxies . . . 25
2.3.1 Integral-Field Spectroscopy data . . . 27
2.3.2 Motivation of this thesis . . . 28
3 Sample selection, observations and data reduction 31 3.1 Sample selection . . . 31
3.1.1 The parent sample . . . 31
3.1.2 The nuclear classification . . . 34
3.1.3 The VHIKINGS and SAURON/Seyfert samples . . . 38
3.2 Observation and data reduction . . . 44
3.2.1 VHIKINGS survey . . . 44
3.2.2 SAURON/Seyfert survey . . . 45
4 Results: the moment maps 55 4.1 The central regions of active and inactive galaxies . . . 55
4.1.1 Stellar and ionised gas distribution . . . 56
4.1.2 Stellar and ionised gas kinematics . . . 58
4.2 HImoment maps . . . 59
4.2.1 HImorphology and environment . . . 60
4.2.2 HI kinematics . . . 60
4.3 Summary . . . 62
5 Kinematic analysis of the velocity fields 63 5.1 global kinematic major-axis orientation in the central regions . . 63 5.1.1 Stellar kinematics and the orientations of the line of nodes 65
5.1.2 Global kinematic misalignments between stars and
ionised gas . . . 67
5.1.3 Statistical tests . . . 68
5.2 Modelling the velocity fields . . . 70
5.2.1 The PyRing tool . . . 75
5.2.2 Testing PyRing . . . 77
5.2.3 Conclusion from these tests. . . 89
5.3 Radial Variations of Kinematic Properties . . . 89
5.3.1 PA and rotation curve in the central regions . . . 89
5.3.2 HIvelocity curves and position angles. . . 99
5.3.3 Global variation of the kinematic parameters. . . 105
5.4 Summary and main results . . . 108
6 Discussion and Perspectives 111 6.1 Feeding the AGN and time-scales. . . 111
6.2 Accretion rates and kinematic misalignments . . . 117
6.3 Perspectives . . . 119
6.3.1 Harmonic analysis of velocity fields . . . 120
6.3.2 Other directions for further works. . . 122
A The master sample 127 B The VHIKINGS sample 133 B.1 The DSS images . . . 133
B.2 The radio data . . . 138
C SAURON moment maps 143 C.1 Stellar and ionised gas distribution and kinematic . . . 143
C.2 h3 and h4maps . . . 152
C.3 Hβ kinematic maps . . . 155
D HI moment maps 159
E Notes on individual galaxies. 177 E.1 NGC 1068/NGC 4548 pair . . . 177 E.1.1 NGC 1068 (M 77) . . . 177 E.1.2 NGC 4548 (M 91) . . . 178 E.2 NGC 3227/NGC 3169 pair . . . 179 E.2.1 NGC 3227 . . . 179 E.2.2 NGC 3169 . . . 180 E.3 NGC 2655/NGC 4459 pair . . . 180 E.3.1 NGC 2655 . . . 180 E.3.2 NGC 4459 . . . 181 E.4 NGC 3627/NGC 5806 pair . . . 182 E.4.1 NGC 3627 (M 66) . . . 182 E.4.2 NGC 5806 . . . 182 E.5 NGC 4051/NGC 5248 pair . . . 183 E.5.1 NGC 4051 . . . 183 E.5.2 NGC 5248 . . . 184 E.6 NGC 4151/NGC 2985 pair . . . 185 E.6.1 NGC 4151 . . . 185 E.6.2 NGC 2985 . . . 186 E.7 NGC 4579/NGC 3351 pair . . . 187 E.7.1 NGC 4579 (M 58) . . . 187 E.7.2 NGC 3351 (M 95) . . . 188 E.8 NGC 5194/NGC 5055 pair . . . 189 E.8.1 NGC 5194 (M 51) . . . 189 E.8.2 NGC 5055 (M 63) . . . 189 E.9 NGC 6951/NGC 5248 pair . . . 190 E.9.1 NGC 6951 . . . 190 E.10 NGC 3147/NGC 4041 pair . . . 191 E.10.1 NGC 3147 . . . 191 E.10.2 NGC 4041 . . . 191 xviii
E.11 NGC 4593/NGC 5383 pair . . . 192 E.11.1 NGC 4593 . . . 192 E.11.2 NGC 5383 . . . 192 E.12 NGC 4939/NGC 5364 pair . . . 192 E.12.1 NGC 4939 . . . 192 E.12.2 NGC 5364 . . . 193 E.13 NGC 5427/NGC 2967 pair . . . 193 E.13.1 NGC 5427 . . . 193 E.13.2 NGC 2967 . . . 193 E.14 NGC 4941/NGC 3705 pair . . . 193 E.14.1 NGC 4941 . . . 193 E.14.2 NGC 3705 . . . 193 E.15 NGC 4639/NGC 3162 pair . . . 194 E.15.1 NGC 4639 . . . 194 E.15.2 NGC 3162 . . . 194 E.16 NGC 4258/NGC 4527 pair . . . 194 E.16.1 NGC 4258 (M 106) . . . 194 E.16.2 NGC 4527 . . . 195 E.17 NGC 6814/NGC 3963 pair . . . 195 E.17.1 NGC 6814 . . . 195 E.17.2 NGC 3963 . . . 195 Bibliography 196 xix
List of Tables
1.1 Unification model of AGN. . . 14 3.1 Sample selection criteria. . . 32 3.2 Criteria for spectral classification. . . 34 3.3 Properties of our sample. . . 43 3.4 Configuration properties. . . 45 3.5 Details of the exposures of our sample. . . 46 3.6 SAURON instrumental characteristic . . . 47 5.1 Results of the kinematic analysis of the stellar and gaseous
com-ponents in the central regions. . . 71 5.2 Estimation of the dynamical parameters. . . 78 5.3 Estimation of the dynamical parameters of the observed HI
ve-locity field of NGC 5364. . . 83 5.4 Estimation of the dynamical parameters of the observed stellar
velocity field of NGC 5055. . . 87 5.5 Effective radius . . . 90 6.1 Eddington Ratios and Mass Accretion Rates. . . 116 A.1 Properties of the master sample . . . 128 B.1 VLA observation parameters. . . 139
List of Figures
1.1 The radio-loud quasar 3C 273 (z=0.16), observed at 2 cm as part of a VLBA survey (Kellermann et al., 1998). . . 3 1.2 The FR-I radio galaxy 3C 465, corresponding to the
el-liptical galaxy NGC 7720, observed with the VLA at 20 cm (from the 3CRR-Atlas of Leahy, Bridle, and Strom, http://www.jb.man.ac.uk/atlas/). . . 4 1.3 The FR-II radio galaxy Cygnus A, observed with the very large
array (VLA) at 6 cm (Perley et al., 1984). The extent of the radio emission is about 140 kpc. . . 5 1.4 Schematic SED of radio-loud and radio-quiet AGN. . . 7 1.5 Optical spectra of various kinds of active galactic nuclei. . . 9 1.6 Example of diagnostic diagrams (Kewley et al., 2006) . . . 11 1.7 Unification scheme for the type 1 and 2 Seyfert galaxies . . . 15 1.8 AGN component and spatial scales. . . 17 2.1 QSO luminosity function. . . 21 2.2 Distribution of the quasars space density as a function of redshift. 21 2.3 OASIS optical layout. . . 26 3.1 Master sample galaxies properties. . . 33 3.2 Diagnostic diagrams. . . 35 3.3 Diagnostic diagrams for ambiguous galaxies. . . 39 3.4 R-band Digital Sky Survey images of the SAURON sample galaxies. 41 3.5 Zone of rejection of the null hypothesis. . . 42 3.6 Spectrum of NGC 5194 showing the spectral windows masked
for the pixel-fitting iteration. . . 49 3.7 Contribution of the Hermite polynomials in the LOSVD profile. 50
3.8 Examples of spectra and their corresponding fits for 4 galaxies. 51 3.9 Radial normalised profiles of the BLR. . . 52 3.10 Example of contaminated spectrum of NGC 4051. . . 53 4.1 SDSS image of NGC 4151. The outer spiral arms are visible
though very weak. . . 61 5.1 Comparison of observed and symmetrised velocity fields for
NGC 2655. . . 64 5.2 Distribution of the differences between the photometric and the
global stellar kinematics PAs. . . 66 5.3 Kinematic misalignments between stars and ionised gas. . . 67 5.4 Cumulative fraction distributions. . . 69 5.5 NGC 5055 stellar velocity field divided in concentric rings. . . . 72 5.6 Projection of the galactic disk on the sky. . . 73 5.7 Observed and model velocity field of NGC 5364. . . 78 5.8 Comparison AIPS, GIPSY and Python tilted ring fits of a model
velocity field. . . 79 5.9 Comparison AIPS, GIPSY and Python tilted ring fit. Rotation
velocity estimation. . . 80 5.10 Comparison AIPS, GIPSY and Python tilted-ring fits of an
ob-served velocity field . . . 82 5.11 Comparison AIPS, GIPSY and Python tilted ring fit of an
obser-vation velocity field. Rotation velocity curve. . . 83 5.12 Comparison AIPS, GIPSY and Python tilted ring fit of an
obser-vational velocity field. Projected rotation velocity curve. . . 84 5.13 Comparison GIPSY and Python tilted ring fits of a SAURON
ve-locity field. . . 86 5.14 Comparison GIPSY and Python tilted ring fit. Rotation velocity
estimation. . . 87 5.15 Comparison GIPSY and Python tilted ring fit on ionised gas
kinematic . . . 88 5.16aKinematic position angles of the stars and of the gas components. 91 5.16bKinematic position angles of the stars and of the gas
compo-nents (continued). . . 92 xxiv
5.17 Distribution of the amplitude of variations of the stellar and the gaseous kinematic PAs. . . 93 5.18aRotation curve of the stars and of the gas components. . . 97 5.18bRotation curve of the stars and of the gas components (continue). 98 5.19aRotation curve and kinematic position angles of the neutral gas
components. . . 101 5.19bRotation curve and kinematic position angles of the neutral gas
components. (continued) . . . 102 5.19cRotation curve and kinematic position angles of the neutral gas
components. (continued) . . . 103 5.20 Comparison of HI stellar and ionised gas kinematics of NGC 2655104
5.21aRotation curve and kinematic position angles of all components. 106 5.21bRotation curve and kinematic position angles of all components.
(continued) . . . 107 6.1 Diagnostic diagrams . . . 114 6.2 Differences between the global kinematic PAs of the stars and
gas and amplitude of variations of the gaseous kinematic PAs as a function of the mass accretion rate. . . 115 6.3 Fuelling mechanisms and spatial scales. . . 119 6.4 Harmonic analysis of NGC 5055 velocity fields. . . 123 6.5 Harmonic analysis of NGC 2967 and 5383 velocity fields. . . 124 B.1 R-band DSS images of the master sample galaxies. . . 134 B.2 R-band DSS images of the master sample galaxies, continued. . 135 B.3 R-band DSS images of the master sample galaxies, continued. . 136 B.4 R-band DSS images of the master sample galaxies, continued. . 137 C.1a SAURON maps for the Seyfert galaxies NGC 1068 and NGC 3227. 144 C.1b SAURON maps for NGC 2655 and its control NGC 4459. . . 145 C.1c SAURON maps for NGC 3627 and its control NGC 5806 . . . 146 C.1d SAURON maps for NGC 4051 and its control NGC 5248. . . 147 C.1e SAURON maps for NGC 4151 and its control NGC 2985. . . 148 C.1f SAURON maps for NGC 4579 and its control NGC 3351. . . 149
C.1g SAURON maps for NGC 5194 and its control NGC 5055. . . 150 C.1h SAURON maps for NGC 6951 and its control NGC 5248. . . 151 C.2a h3 and h4maps. . . 153
C.2b Fig. C.2a continued. . . 154 C.3a Velocity and velocity dispersion of Hβ emission lines. . . 156 C.3b Fig. C.3a continued. . . 157 D.1a HImoment maps. . . 160
D.1b HImoment maps. . . 161
D.1c HImoment maps. . . 162
D.1d HImoment maps. . . 163
D.1e HImoment maps. . . 164
D.1f HImoment maps. . . 165
D.1g HImoment maps. . . 166
D.1h HImoment maps. . . 167
D.1i HImoment maps. . . 168
D.1j HImoment maps. . . 169
D.1k HImoment maps. . . 170
D.1l HImoment maps. . . 171
D.1mHImoment maps. . . 172
D.1n HImoment maps. . . 173
D.1o HImoment maps. . . 174
D.1p HImoment maps. . . 175
D.1q HImoment maps. . . 176
Chapter 1
Introduction.
What are Active Galactic Nuclei?
Galaxies are made up of stars, gas and dust and the galactic luminosity comes mainly from the thermal emission of these components. However, some galax-ies in the Universe show unusual very bright nuclear regions, characterised by energetic phenomena (e.g. high ionisation regions, jets). Such nuclei are called Active Galactic Nuclei (AGN) and their hosts are active galaxies. The AGN in-clude a wide range of different objects from the most powerful like the quasars to galaxies containing Low Ionisation Nuclear Emission Regions (referred as LINER galaxies in the following) at the low luminosity side and they share several properties, which define the AGN class:
• High Luminosity. The AGN produce a prodigious amount of energy, from about 1 to 104 times the luminosity of a typical galaxy. The average
bolometric luminosity emitted by the central regions of an active galaxy reaches 1044 erg s−1 for low luminosity AGN and more than 1048 erg s−1
for the most powerful objects. For comparison, the typical total luminos-ity of a field galaxy is about 1044 erg s−1. The AGN luminosity depends
also on the redshift of the object. Luminosities of AGN at z " 2 are about 100 times greater than for AGN in the local Universe (Krolik, 1999). • Small Angular Size. This high luminosity seems to originate in a very
small region in the centre of the host galaxy. However, this picture de-pends strongly on the wavelength. While X-ray images of active galaxies are mostly point-like, corresponding to the inner parsec, radio emission related to the AGN can extend over large spatial scales, sometimes be-yond the galaxy itself (see Sec. 1.1.1).
• Broad Band Continuum. The integrated luminosity of a normal galaxy is mostly due to the stars, gas and dust components from the infra-red (IR) to the ultra-violet (UV) wavelengths. Emissions in radio (corresponding to atomic and molecular gas) and X-rays or γ-rays (hot gas, supernovae remnants) are less important.
1.1. An observational classification 2 In the case of an AGN, the observed spectrum is almost flat from radio to γ-rays, with similar luminosity at all wavelengths. In some cases, the radio luminosity emitted by an AGN is more than a magnitude larger than for a normal galaxy, and in X-rays, the difference between AGN and non-active galaxies is even greater, reaching three or four orders of magnitude (Krolik, 1999). The weak local maxima emerging from the flat AGN spectrum allow to constrain the emission mechanisms, as a func-tion of wavelength.
• Strong Emission Lines. In most cases, strong optical and IR emission lines are observed in the spectrum of AGN. The width of these emission lines can extend up to several thousands km s−1 and such lines are often
asso-ciated with high ionisation processes.
• Variability. The luminosity emitted by an AGN is also characterised by time variability, in some cases these fluctuations are observed on time scales of order of days (e.g. UV continuum) and even hours or minutes in the case of X-rays emission (Blandford et al., 1990). Because of such variations, the interpretation of the AGN spectra taken at different times may be difficult, since they may show different characteristics at different epochs.
Despite these common characteristics, AGN form a heterogeneous group, with different physical properties, especially in terms of the nature of the emit-ted radiations. The observed differences are used to classify the different types of AGN. In the following section, I describe one of such classifications.
1.1 An observational classification
The difference of luminosity in radio wavelengths leads to the main classifica-tion of the AGN, depending on the radio-to-optical flux ratio. Different values of this ratio can be set to define the radio-loudness of an AGN, depending on the considered radio and optical wavelengths. Usually is used the ratio R=L5 GHz/LBwhere L5 GHz is the flux at 5 GHz and LBis the optical flux in the
B-band centred on 4400 ˚A. Then, if R!10 the AGN is called radio-loud while it is classified as radio-quiet if R"10 (Kellermann et al., 1989; Stocke et al., 1992). The majority of AGN are radio-quiet, only 10% being radio-loud. In this sec-tion, I describe the different properties of the radio-loud and radio-quiet AGN.
1.1.1 Radio-loud AGN
The radio-loud nuclei are found in giant elliptical galaxies and in some distant quasars. In such objects, extended jets or lobes are observed in radio emission. Such emission is due to relativistic electrons in the hot material via synchrotron
1.1. An observational classification 3
Figure 1.1: The radio-loud quasar 3C 273 (z=0.16), observed at 2 cm as part of a VLBA survey (Kellermann et al., 1998).
mechanisms (see Sec. 1.2). The main classes of loud AGN are radio-galaxies, quasars and BL Lac objects:
• Radio-galaxies.
Galaxies in the local Universe hosting an AGN with high radio luminos-ity are called radio-galaxies. Mostly they are elliptical galaxies. Different types of radio-galaxies are defined depending on the predominant source of the radio emission.
Core-dominated objects present the bulk of radio emission in
unre-solved regions (in the scale of the arcsecond) in the central parts of the host galaxies. They present flat and variable radio spectrum. Recently, high spatial resolution observations, via e.g. very long baselines interfer-ometer (VLBI), allow to resolve these compact radio-source. Jets of a few hundred of parsecs are often associated with such objects, as shown in the fig. 1.1.
In the lobe-dominated radio-galaxies on the other hand, the radio emis-sion originates predominantly from two large lobes of several hundred of kpc in extent. In these lobes, radio emission presents a steep spectrum. Within these lobe-dominated class, a sub-classification has been defined by Fanaroff & Riley (1974). This classification depends on the morphol-ogy of the radio lobes and the optical/UV emission properties.
1.1. An observational classification 4
Figure 1.2: The FR-I radio galaxy 3C 465, corresponding to the elliptical galaxy NGC 7720, observed with the VLA at 20 cm (from the 3CRR-Atlas of Leahy, Bridle, and Strom, http://www.jb.man.ac.uk/atlas/).
FR-I radio-galaxies display two-sided radio jets extending from the host
galaxy to ∼ 1 kpc. At the end of such jets, extend radio lobes. Fig. 1.2 shows the FR-I radio galaxy 3C 465. The jets are asymmetric, the south-east jet being weaker than the north-west one. The radio lobes are sharply bent with respect to the jet direction. Optical and UV emission of FR-I radio-galaxies display only narrow lines, they are then all narrow lines radio-galaxies (NLRG).
FR-II radio-galaxies are more powerful than their FR-I counterparts and
display larger radio structures. Collimated jets, associated with ultra rel-ativistic motions, arise from the nucleus at several kiloparsec scales. At the ends of these jets, strong radio lobes extending for several kpc are observed. Cygnus A is the archetype of FR-II radio-galaxies. Fig. 1.3 shows the radio emission at 6 cm observed with the Very Large Array (VLA) by Perley et al. (1984). The large radio lobes are visible at the end of fainter collimated jets. The bright spot in the centre corresponds to the host galaxy nucleus. The total extent of the radio emission of Cygnus A is about 140 kpc. The UV/optical spectra of FR-II radio-galaxies present either broad and narrow lines or only narrow emission lines, these ob-jects are then called broad line radio-galaxies (BLRG) and narrow line radio-galaxies (NLRG), respectively.
1.1. An observational classification 5
Figure 1.3: The FR-II radio galaxy Cygnus A, observed with the very large array (VLA) at 6 cm (Perley et al., 1984). The extent of the radio emission is about 140 kpc.
• Radio-loud quasars. The quasars are high redshift objects associated with galactic formation and interaction. They were discovered in the 60s with the development of radio-astronomy. Since the optical counterparts of the strong observed radio sources appeared point-like, similar to stars, these objects were named Quasi-Stellar Radio Sources or Quasars. Later, similar objects with lower radio emission were found. These radio-quiet quasars are called Quasi-Stellar Objects (QSOs). About only 10% of all the quasars are radio-loud. Their spectra contain absorption lines which were soon associated with the Hydrogen Balmer lines, redshifted due to the distance of these objects. The nucleus of a quasar is very lumi-nous, with Lbol > 1046ergs s−1which corresponds to more than 100 times
the luminosity of a normal field galaxy. Radio-loud quasars present one-sided jets associated with super-luminal motions. Fig. 1.1 presents the quasar 3C 273, observed at 2 cm (Kellermann et al., 1998). The one-sided radio jet extends out to about 220 pc.
• Blazars: BL Lac objects, Optically Violent Variable objects. These pe-culiar objects display rapid time variations of high amplitude, the flux can vary by 10% or more on a year at all wavelengths (Wiita, 2006). Their spectra seem to be dominated by emission from relativistic jets and present neither emission nor absorption lines (see top left panels of Fig. 1.5).
1.1.2 Radio-quiet AGN
Radio-quiet and radio-loud active galaxies present similar IR, optical, UV and X-rays properties (Neugebauer et al., 1986; Sanders et al., 1989; Steidel &
Sar-1.1. An observational classification 6 gent, 1991). However, radio-quiet objects differ from their radio-loud coun-terparts in term of radio emission. Radio-quiet AGN do not show large radio structures, although parsec-scale jets can be observed in some cases. The clas-sification of radio-quiet AGN depends essentially on their optical/UV spectral properties.
• Seyfert galaxies. The Seyfert galaxies are nearby spiral or irregu-lar galaxies. They are low luminosity AGN with a nuclear magni-tude Mnuc>∼ − 21.5, corresponding to a bolometric luminosity less than
1045erg s−1. They were the first AGN to be discovered by Seyfert (1943)
who noted their characteristics (broad and strong emission lines, unre-solved nuclei, high luminosity, high mass) which differentiate them to
normal galaxies. There are two distinct subclasses of Seyfert galaxies
based on the presence or absence of broad emission lines:
Seyfert 1 galaxies display broad permitted emission lines with full width
at half maximum (FWHM) ∼ 1000,10000 km s−1. The regions emitting
these broad lines are called broad line regions (BLR). Narrow permit-ted and forbidden emission lines are also observed. They are emitpermit-ted from a different region, the narrow line region (NLR). Both low ionisa-tion lines (e.g. Hα, Hβ) and high ionisaionisa-tion lines (e.g. [OIII]λλ4959,5007)
are present in the BLR and NLR. These broad and narrow emission lines are discussed in detail in Sec. 1.3.
Seyfert 2 galaxies are less luminous than Seyfert 1’s. The spectra of
Seyfert 2 galaxies is similar to the ones of the Seyfert 1’s, the only dif-ference being the absence of the broad permitted lines.
Later, Osterbrock (1981) defined type 1.5, 1.8 and 1.9 Seyfert galaxies for AGN with characteristics of both Seyfert 1 and Seyfert 2 galaxies.
• Radio quiet quasars. The majority of quasars (∼ 90%) are radio-quiet. They are commonly called QSO (quasi stellar objects). As for their radio-loud counterparts, these objects are very luminous, Mnuc<∼ − 21.5, and
are generally spatially unresolved. The optical spectra of these objects are very similar to the Seyfert 1 galaxies spectra, except that stellar ab-sorption lines are not detected and that narrow emission lines are very weak.
• LINER galaxies. Heckman (1980) identified low ionisation nuclear emis-sion line regions (LINER) galaxies, classified now as active galaxies with very low nuclear luminosity (about 1039 erg s−1). The optical spectra of
the LINER galaxies are similar to those of the Seyfert 2’s, with relatively high strength of the low ionisation lines (e.g. Hα, Hβ).
Both radio-loud and radio-quiet AGN display important features in their continuum spectra and in some cases strong emission lines. Their properties allow to constrain the physical conditions of the AGN. In the two following sections, I then review the main characteristics of the continuum and emission lines emitted by AGN.
1.2. Continuum spectrum 7
1.2 Continuum spectrum
A normal galaxy emits nearly all its luminosity within a few decades in fre-quency, from IR to UV wavelengths. In most cases, the spectrum of an ac-tive galaxy looks spectacularly different. AGN emit within a wide range of wavelengths with almost equal power on several decades in frequency, from mid-infrared to hard X-rays. The spectral energy distribution (SED) of AGN displays different features on top on this flat continuum. These features are good indicators of the emission mechanisms. In particular, continuum studies allow to constrain the importance of thermal and non-thermal emission pro-cesses in various frequency bands. In this section, I review the main features of the AGN continuum spectrum from X-rays to radio wavelengths. Fig. 1.4 dis-plays schematic SEDs of radio-quiet and radio-loud AGN. The different parts of the spectrum are represented with the associated radiation processes.
Figure 1.4: Schematic SED of radio-loud and radio-quiet AGN. Blue, red and green lines correspond to the characteristics of radio-loud quasars, radio-quiet quasars and Seyfert galaxies, respectively. The black lines correspond to SED components which are similar for these three types of AGN (from Koratkar & Blaes, 1999).
1.2. Continuum spectrum 8 • X-rays and γ-rays emission. Xrays emission extends from ∼ 0.1 keV up to ∼ 300 keV. To a first approximation, the dominant component is a power law extending from ∼ 1 keV up to ∼ 100 keV. Beyond, an ex-ponential cut-off is observed, from ∼ 80 to ∼ 300 keV (Risaliti & Elvis, 2004). Rapid fluctuations (of the order of hours or minutes) are ob-served in the X-rays and γ-rays spectra of AGN. Such fluctuations are ev-idence for emitting regions in the innermost parts of the galaxy. Several radiation mechanisms may contribute to the production of X-rays and γ-rays continuum, such as thermal (bremsstrahlung) and non-thermal (inverse-Compton scattering) processes (Krolik, 1999). Synchrotron and synchrotron self Compton mechanisms may potentially emit such radia-tions but are not the predominant processes.
• UV/optical emission. The UV/optical continuum emission is dominated by the Big Blue Bump (BBB) which extends from the NIR (∼ 1 µm) to the UV and in some cases to the soft X-rays. This component is thought to be associated with thermal emission of material at a characteristic tem-perature of ∼ 105 K, located in an optically thick accretion disk
sur-rounding the central supermassive black hole (Shields, 1978; Malkan & Sargent, 1982; Laor & Netzer, 1989). However, models of accretion in an optically thick disc failed to reproduce the UV/optical spectrum of AGN. Recent models of two-phase accretion disk take into account bremsstrahlung radiations of free electrons in optically thin medium as well as the black body emission from the optically thick regions to fit the observed UV/optical continuum (Collin-Souffrin et al., 1996; Nayakshin & Melia, 1997).
• IR emission. AGN IR spectrum is formed by a broad continuum be-tween 2 and 100 µm, of the same luminosity as the optical/UV emission, with a sharp drop-off for λ > 100 µm (Haas et al., 2003). Thermal emis-sion from dust heated by the UV-optical continuum cannot be the unique source of the IR continuum in AGN and non-thermal emission produced by synchrotron mechanism is important, in particular in far infra-red (FIR) emission of radio-loud quasars (Risaliti & Elvis, 2004). Similar time variations as the UV/optical continuum are observed in some cases, with a significant time delay. This delay gives the spatial separation between the UV/optical and IR emitting regions.
• Radio emission. As explained earlier, the fraction of luminosity in ra-dio wavelength depends on the type of AGN (see Sec. 1.1.). Generally, AGN emit less flux in radio than in the UV/optical frequencies, by 3 to 6 orders of magnitude. In the case of radio-loud AGN though, radio lu-minosity can be as powerful as optical emission. Then, unlike all other wavebands, the radio continuum is emitted in regions of large spatial extent (radio lobes and jets) in addition to emission in the central unre-solved region (see Sec. 1.1.1). In some cases, the AGN radio emission is also linearly polarised up to of a few 10s of percent. Such strong po-larisation cannot be produced by thermal mechanisms and synchrotron
1.3. Emission lines 9 emission by relativistic electrons seems to be the predominant process in the production of AGN radio continuum (Krolik, 1999).
1.3 Emission lines
Figure 1.5: Optical spectra of various kinds of active galactic nuclei. Strong emission lines observed in IR, optical, UV and even X-ray wave-lengths are one of the dominant features of the spectrum of all AGN, except for the particular BL Lac objects (see Fig. 1.5, top left panel). Such emission lines are not observed in the spectra of non-active galaxies, as shown in the bottom left panel of Fig. 1.5. The properties of the AGN emission lines constrain the physical condition of the ionised gas in different regions of the AGN, such as the temperature, density and degree of ionisation, and shed lights on the dy-namical mechanisms at works in these regions. In this section, I describe the characteristics of the optical/UV emission lines. AGN emission lines can be separated in two types. Some objects exhibit lines with broad wings as well as narrower profiles, while for other objects, only narrow lines are observed.
1.3. Emission lines 10 • Broad emission lines.
Any emission line presenting width values from 1000 km s−1 up to 10000
km s−1 at full width at half maximum (FWHM) is called broad line. Typical
values of the FWHM of such broad lines are around 5000 km s−1. These lines
are detected in quasars, type 1 Seyfert galaxies and broad line radio-galaxies (BLRG) as shown in Fig. 1.5. Only permitted lines are detected with such broad components, and among the several observed broad lines, the most important are the hydrogen lines (e.g. Lyα λ1216 , Hβ λ4861, Hα λ6563), the helium lines (e.g. HeIIλ1640) and the carbon lines (e.g. CIVλ1549). The broad lines are
emitted by high velocity clouds in regions close to the central engine, generally spatially unresolved, called broad line regions (BLR). The strength of the broad emission lines vary with time and these fluctuations are correlated with the AGN continuum fluctuations. The time delay between the continuum and broad line variations can be related to the size of the BLR, which typically extends from 0.01 to 0.1 pc from the central continuum source.
The line profiles and relative strengths allow to probe the physical properties of the BLR. Since no broad forbidden line is observed, the density in the BLR is very high (ne ≥ 109 cm−3). Given that the typical temperature in the BLR
is 104 K , the width of the broad emission lines cannot be explained by pure
thermal motions. The broad width of these lines is then generally attributed to Doppler effect due to the motions of each line-emitting clouds.
• Narrow lines.
Permitted lines listed above and forbidden lines such as [OII]λ3727,
[OIII]λλ4959,5007, [NII]λλ6548,6583 or [OI]λλ6300,6364 present narrow
com-ponents, with FWHM less than 1000 km s−1, in the AGN spectra. The
forbid-den lines, especially [OIII]λ5007, are stronger than the permitted lines (except
for Lyα), unlike in HII regions. In the case of Seyfert 2 galaxies, narrow line
radio-galaxies (NLRG) and LINER galaxies, only narrow emission lines are ob-served, the broad emission lines are not detected (see Fig. 1.5). These narrow lines are emitted in spatially extended regions called the narrow line regions (NLR) of lower density than the BLR (ne≥ 103− 106 cm−3) and with
tempera-tures between 10000 and 25000 K.
The relative strength of narrow emission lines are used to differen-tiate high and low ionisation processes and then to distinguish be-tween HII regions, LINER and Seyfert galaxies. Diagnostic diagrams with two pairs of lines have then been constructed to distinguish be-tween blackbody in HII regions and high ionisation spectra of AGN. Several diagnostic lines can be used, in the optical wavelengths (e.g. [OIII]λ5007/Hβ λ4861, [NII]λ6583/Hα λ6563 [SII]λλ6717,6731/Hα λ6563),
UV (e.g. CIVλ1549/Lyα λ1216 , NVλ1240/HeIIλ1640) and IR (e.g. [NeV]λ14
µm /[NeII]λ12.8 µm,[OIV]λ26 µm/[NeII]λ12.8 µm, [SiVI]λ1.962 µm/Paα).
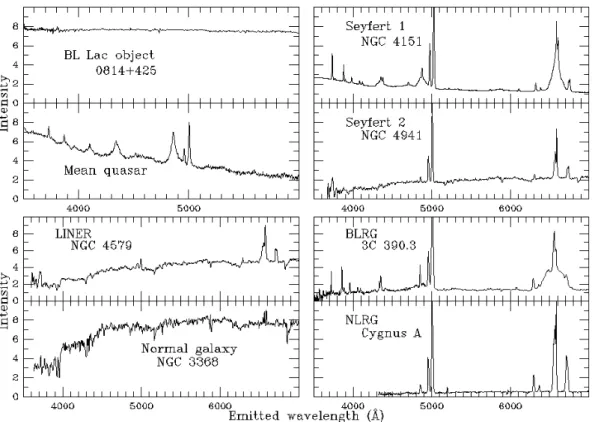
Fig. 1.6 shows examples of diagnostic diagrams (Kewley et al., 2006) with the limits of the different activity classes: Seyfert, LINER or HII galaxies.
1.3. Emission lines 11 In general, narrow lines emission is strongly anisotropic. NLR present usually elongated shapes, known as the ionisation cones. Inside this feature, emission line ratios are characteristic of highly ionised gas, while outside the cone, they indicate that the gas is ionised by the stars. The ionisation cone can extend from 0.5 pc up to a few kpc, and can be either one-sided or two-sided. The axis of the cone is not correlated with the axis of rotation of the host galaxy, but is generally aligned with the radio emission, if it exists (e.g. Schmitt et al., 2003).
Figure 1.6: Example of diagnostic diagrams (Kewley et al., 2006). [OIII]λ5007/Hβ λ4861 versus [NII]λ6583/Hα λ6563 diagnostic diagram is
dis-played in the left panel, [OIII]λ5007/Hβ λ4861 versus [SII]λ6731/Hα λ6563 in
the middle panel and [OIII]λ5007/Hβ λ4861 versus [OI]λ6364/Hα λ6563 in
the right panel. The Kewley et al. (2001) extreme starbust line, the Kauffmann et al. (2003) pure star forming line and the Kewley et al. (2006) classification line are shown as red solid, blue dashed and blue solid lines, respectively. Galax-ies lying below the extreme starbust and the pure star forming lines are HII
galaxies, while AGN lie above the extreme starbust line. Composite galax-ies, between HIIand AGN, are situated between the extreme starbust and the
pure star forming lines (left panel). The Kewley et al. (2006) classification lines are used to separate the Seyfert galaxies from the LINER galaxies (middle and right panels)
Both in the BLR and NLR, high-ionisation lines are strong (e.g. [OIII]λλ4959,5007 or CIVλ1549). These lines require too much energy to be
produced by thermal or shock excitation. Moreover, the time delay between the time fluctuations of the AGN continuum and those of the broad emission lines may correspond to the travel time of the ionising photons between the central source and the BLR clouds, while the shape, extent and orientation of the NLR support the existence of a collimated ionising radiation arising from the central engine. All these observational facts support the scenario where both broad and narrow emission lines are produced by photoionisation of the ISM by the AGN continuum. While close to the central source, hard X-ray photons fully ionise the gas, an extended partially ionised region exists be-tween this ionised region and the neutral gas. In this regions, the gas is
ex-1.4. Nature of the energy source 12 cited by soft X-ray and far-UV photons. Lower excitation ions, such as [OI]
or [SII] form in these regions. The size and ionic abundance of such partially
ionised regions depends strongly on the photoionisation model (Oliva et al., 1999; Groves et al., 2004).
1.4 Nature of the energy source
The physical characteristics (high luminosity, small spatial scales, polarisation) and spectral properties (broad emission lines, radio emission) of AGN are ev-idence that the active galaxies host an energy source in addition to the ther-mal source provided by the stars. Since the different classes of active galaxies present several similar properties, it is now widely thought that the different types of AGN represent probably the same physical phenomenon, at different epochs and observed with different parameters. The current paradigm for the power source of the nuclear activity is the accretion of material onto a central super-massive black hole (Rees, 1984, SMBH,). In this section, I describe the SMBH model and the observational evidence for this central object.
1.4.1 The super massive black hole paradigm
A black hole more massive than 106
M% is called a super-massive black hole (SMBH). The energy released by material falling onto a black hole is about one order of magnitude larger than during the thermonuclear fusion of hydrogen (Lynden-Bell, 1969). Accretion of material onto a SMBH is then an efficient way to produce the prodigious energy observed in AGN. Very close to the SMBH, the accreted gas would have lost almost all its angular momentum. Therefore, it seems very likely that material falls onto the SMBH via a flat rotationally-supported disk, the accretion disk. In this accretion disk, the material loses its remaining angular momentum and fall onto the SMBH, releasing the gravita-tional energy in the form of radiations or jets. Although direct evidence of the presumed SMBH surrounded by an accretion disk remains impossible with the current observational facilities, many observational properties of the cen-tral regions of AGN support the existence of a SMBH.
1.4.2 Evidence for a central SMBH
The first argument supporting that AGN are powered by SMBH is the mass of the unresolved central object, constrained by the Eddington limit. The gravitational force on the gas emitting the AGN luminosity must exceed the radiation pressure, in other words, the AGN luminosity LAGN must not
ex-ceed the Eddington luminosity LEdd: LAGN < LEdd " 3.3 104 MM
%. Then, MCM O > 8 105M%1044LAGNergs−1, where MCM O is the mass of the central massive
1.5. Unifying the AGN. 13 object. Therefore, for an AGN emitting 1045erg s−1, a mass of at least 107
M% is concentrated within a region of small size, constrained by the time variations of the X-ray continuum. More evidence for the existence of a SMBH in the centre of AGN is provided via observations of these central regions:
• The widths of the broad emission lines, interpreted in terms of velocity of gas in the BLR, and the stellar and gaseous velocity dispersions in the central regions require a deep gravitational potential produced by a high mass concentration.
• Observations of H2O and OH masers in the central regions of AGN
corre-spond to material in Keplerian motion around a point-like mass of more than 106
M%. In the Seyfert 2 galaxy NGC 4258, Miyoshi et al. (1995) con-strained the central mass to be ∼ 3.6 107
M% within 0.13 pc via VLBA maser observations.
• The strongest dynamical evidence for SMBH are certainly in our Galaxy, where measurements of stellar proper motions in the Galactic centre con-strained the central mass to be of 3-4 106
M% (Genzel et al., 2000; Sch¨odel et al., 2003).
• Rapid X-rays continuum fluctuations in the AGN spectra imply that the central mass is about 106
M% for typical AGN. Such masses correspond to a Schwarzschild radius of 10−7pc.
• The time delay between the continuum and broad emission lines varia-tions is very likely related to the kinematics and geometry of the BLR. In particular, the size of the BLR and the mass enclosed within it can be constrained from this delay. This reverberation mapping of the BLR (Blandford & McKee, 1982) reveals then central masses from 107 to 109
M% enclosed within a region between 1 and a few tens of light-days in size (Peterson et al., 2004; Kaspi et al., 2005).
• Double peaked emission lines (e.g. Hα, X-ray Kα iron line) are strong evidence for emission produced in a geometrically thin disk structure surrounding the central SMBH.
1.5 Unifying the AGN.
The model of accretion onto a SMBH seems to explain well most of the charac-teristics of the AGN, and numerous studies focused on unifying the different types of AGN with a few physical parameters. Reviews of the standard unifi-cation scheme can be found in Antonucci (1993) and Urry & Padovani (1995).
1.5. Unifying the AGN. 14 radio orientation
properties face-on edge-on Radio quiet Seyfert 1 Seyfert 2
radio-quiet quasars
Radio loud BL Lac NLRG BLRG
quasars
Table 1.1: Unification model of AGN.
1.5.1 The standard model.
The main idea of this model is that all types of AGN correspond to the same physical phenomenon, e.g. infall of material onto a SMBH, and that the ob-served differences are due to an orientation effect. Seyfert 1 and Seyfert 2 galaxies are then the same objects, viewed from different angles. Nuclei and accretion disks of type 1 Seyfert galaxies are seen face-on, while the central engine of Seyfert 2 galaxies is obscured by a dusty torus which prevents us to observe directly the broad emission lines and attenuate the AGN continuum. Seyfert 2 galaxies being three times more numerous than Seyfert 1 galaxies, the dusty torus must obscure about 3/4 of the central source, which is in good agreement with the opening angle of the observed ionising cones (correspond-ing to the NLR). One strong observational evidence of this model, is the detec-tion of weak broad emission lines in the polarisadetec-tion spectrum of the Seyfert 2 galaxy NGC 1068. This polarised light is the AGN continuum and emission from the BLR, scattered by the ISM above the obscuring torus. Fig. 1.7 illus-trates this simple unification scheme of Seyfert galaxies, showing the orienta-tion effect on the observaorienta-tion of the different emitting regions of an AGN. We must however note that the orientation of AGN central regions (dusty torus and accretion disk) are unrelated to the orientation of the host galaxy (Nagar & Wilson, 1999; Kinney et al., 2000). For example, the almost face-on galaxy M 51 (disk inclination of about 20◦) hosts a Seyfert 2 active nucleus.
This unification can be extended to radio-loud AGN (Urry & Padovani, 1995), the BLRG and NLRG being the radio-loud counterparts to the Seyfert 1 and Seyfert 2 galaxies, respectively. In a same way, BL Lac objects are seen face-on, directly along the radio jet which dominates all the spectrum, we then ob-served a featureless spectrum for these particular objects. Finally radio-quiet quasars are also seen face-on with a direct view on the continuum source. Ta-ble 1.1 summarises the aspects of this unification model.
Although this unification scheme explain well the different radio quiet ob-jects in one hand and the radio loud object in the other hand, simple orientation considerations cannot explain why some objects are radio-loud while others are radio-quiet. The dichotomy between radio-loud and radio-quiet AGN is not yet well understood. The spin of the central SMBH may play a role in the radio-loudness of active galactic nuclei (Wilson & Colbert, 1995; Sikora et al., 2007)
1.5. Unifying the AGN. 15
Figure 1.7: Unification scheme for the type 1 and 2 Seyfert galaxies (Urry & Padovani, 1995). Spatial scales are not respected.
No direct observational evidence were available to support this observa-tional scheme, due to the small size of the obscuring torus and accretion disk. However, with increasing spatial resolution instruments (e.g. HST, VLBI, IR interferometers) it is now possible to resolve structures on subarcseconds and submilliarcsecond scales. Hence, the dusty torus obscuring the active nucleus has been recently detected in the nearby Seyfert 2 NGC 1068 (Jaffe et al., 2004). This structure has a diameter of 3.4 pc. A larger similar dusty nuclear disk (125 pc in diameter) has also been observed in the radio-galaxies NGC 4261 (Jaffe et al., 1996). This dusty disk could also be assimilated to the torus obscuring the accretion disk and SMBH.
To give an idea of a possible structure of the AGN, Fig. 1.8 shows the prob-able locations of the different components of an AGN, from the closest to the SMBH, the accretion disk, to the NLR at the kpc scale.
1.5. Unifying the AGN. 16
1.5.2 Alternative models.
The standard unification model, with a SMBH surrounded by an accretion disk and a dusty obscuring torus is now widely accepted. However, some characteristics of AGN continuum spectra, and the fact that AGN have high luminosities on a wide range of wavelengths are not explained via this simple model.
An alternative model to the accretion onto a SMBH is the starburst model for low luminosity AGN (Terlevich et al., 1992). In this scenario the primary source of energy is coming from the numerous supernovae located in a central stellar cluster. However, this model cannot account for the the X-ray fluctuations and the radio continuum emission.
1.5. Unifying the AGN. 17
Torus
0.01 pc 10 pc 100 pc 1000 pc
BLR NLR
Towards larger scales 1 pc distance components BH Accretion disk 0.001 pc
Figure 1.8: AGN components and spatial scales for a SMBH of 107
M%. The distances from the central black hole are displayed on a log scale.
Chapter 2
AGN-galaxy host connection. The
fuelling issues.
In the previous chapter, properties, similarities and differences of the different types of AGN have been reviewed. One particularity shared by all AGN is that they live in the centre of galaxies. It is then natural to wonder what are the ef-fects of the host galaxy on the AGN and vice-versa. While it is now widely ac-cepted that AGN are powered by accretion of gas onto a central SMBH (see Sec. 1.4), the mechanisms that remove angular momentum and transport gas to-wards the nucleus are not known. In particular, the role of the host galaxy and its environment in such processes remain unsolved questions. In this chapter, I focus on the AGN/galaxy host connection, and on the problem of fuelling low luminosity AGN in the local Universe, which is at the heart of this thesis work.
2.1 Evolution of AGN
AGN being very luminous objects, they can be seen at high redshift, and in-deed quasars are found up to z = 6 (the currently highest redshift quasar lies at z = 6.42, Fan et al., 2003). It is therefore possible to study the distribution of quasars as a function of z and thus the cosmic evolution of the population of this class of AGN. The luminosity function of QSOs at different redshifts (Fig. 2.1) shows a strong cosmic evolution. The space density of quasars as a function of redshift can then be determined as shown on Fig. 2.2 (Combes, 2006). This distribution presents a peak between redshift 2 and 3 (the quasars
epoch), and declines steeply for more recent times. This shape is observed both
in radio, optical or X-rays surveys. This implies that the AGN phenomenon was much more frequent at z " 2 − 3 than at the present time.
Moreover, it is recognised that all bulge-dominated local galaxies host a SMBH, and the mass of this black hole is correlated with the bulge luminosity and stellar velocity dispersion (Ferrarese & Merritt, 2000; Gebhardt et al., 2000;
2.2. Fuelling the AGN 20 Tremaine et al., 2002): MBH " 1.5 108M% ! σ ∗ 200 kms−1 "α ,
with a slope α ∼ 4. This relation has been reported in quiescent and active galaxies with black hole masses between 106and 1010
M% and it seems to hold for bright QSOs up to z ∼ 3 (Shields et al., 2003). However, recent results reveal a cosmic evolution of the MBH − σ∗ relationship (Treu et al., 2004; Salviander
et al., 2007).
Recently, Ferrarese et al. (2006) constrained the ratio between their so-called
Central Massive Object (CMO, either a SMBH or a compact stellar nucleus) and
the galaxy masses: MCM O
Mgal ≈ 0.18%.
Such correlations between the central engine properties and the host galaxy properties (at larger scales) imply that the evolution of SMBH and their host galaxies are intimately related and that most today galaxies harbour dead quasars. All galaxies must have therefore experienced at least an accretion phase to form the central SMBH. Mean lifetime of nuclear activity can be es-timated from the size and expansion rates of the radio lobes of radio-galaxies and it is of the order of ∼108 yr. Successive radio-lobes along the jet axis
pro-vide direct epro-vidence for the successive activity phases. Nuclear activity is then a relatively short-term event, possibly recurrent and most of the galaxies are active during the quasars epoch. The drop-off in QSO density for z < 2 can then be explained by a decrease of accretion rates onto the SMBH, either because of a lack of fuel or of feedback processes that prevent material to be funnelled inwards. Given that central SMBH are ubiquitous in today’s galaxies and that a small fraction of these present-day galaxies shows signs of ongoing activity (Seyfert galaxies being found in 3 percent of local galaxies, Kewley et al., 2006), re-ignition of quiescent SMBH is required. One key question is whether the triggering and fuelling mechanisms are related to the host galaxy properties.
2.2 Fuelling the AGN
To fully understand the fuelling of AGN, one has to constrain the origin of the fuel and the mechanisms which transport this fuel towards the nucleus. In order to be accreted onto the central SMBH, material must lose nearly all its an-gular momentum. The anan-gular momentum per unit of mass is L = (GMR)1/2,
where R is the radius of the considered orbit, M is the mass enclosed within R and G the gravitational constant. Therefore, to drive fuel from the outskirts of the galaxies (R " 10 kpc) within the central regions (R " 0.01 pc) onto a SMBH of 107
M%, the angular momentum must decrease by ∼10−6of its initial value.
The nature of the physical processes able to remove such amount of angular momentum is then one of the most important issues in the context of AGN fuelling.
2.2. Fuelling the AGN 21
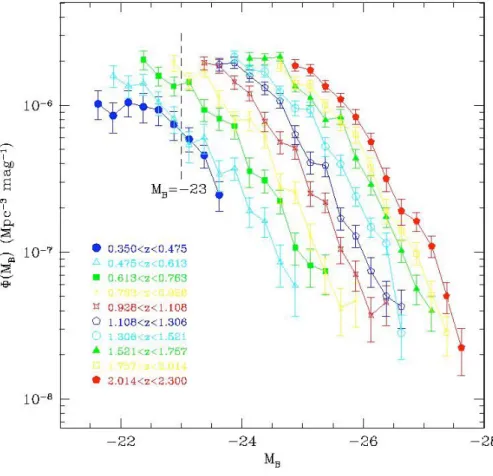
Figure 2.1: QSO luminosity function at redshift 0.35<
∼z<∼2.3
from Boyle et al. (2000).
Figure 2.2: Distribution of the quasars space density as a function of redshift (Combes, 2006). Data are from Hasinger (2005): soft X-ray selected (empty blue circles) and optically selected sources (dashed lines and red filled triangles); Croom et al. (2004): opti-cally selected QSO (dashed red curves).

![Figure 3.2: The [O III ]/Hβ versus [N II ]/Hα [O III ]/Hβ versus [S II ]/Hα and [O III ]/Hβ versus [O I ]/Hα diagnostic diagrams for our sample galaxies](https://thumb-eu.123doks.com/thumbv2/123doknet/14667767.741186/62.892.161.774.288.777/figure-versus-versus-versus-diagnostic-diagrams-sample-galaxies.webp)