ORIGINAL ARTICLE
Changes in oro-facial function and hand-grip strength
during a 2-year observation period after stroke
Martin Schimmel&Beatrice Leemann& Armin Schnider&François R. Herrmann& Stavros Kiliaridis&Frauke Müller
Received: 24 November 2011 / Accepted: 7 June 2012 / Published online: 30 June 2012 # Springer-Verlag 2012
Abstract
Objectives Recovery from stroke-related oro-facial impair-ment has rarely been investigated. In this longitudinal study chewing efficiency, maximum lip and bite force as well as masseter muscle thickness were evaluated and compared with hand-grip force.
Materials and methods Thirty-one hospitalized stroke patients and 24 controls were recruited for this cohort study with 2-year follow-up. Chewing efficiency was evaluated with a color mixing ability test, lip forces with a traction dynamometer, bite force with a digital gauge, masseter muscle thickness using ultrasound measurements and grip strength with a hand dynamometer.
Results During the 2-year observation period, patients were evaluated four times. A total of 21 patients dropped out of the study. Stroke patients showed significantly impaired chewing efficiency and lower lip forces than controls with no significant improvement over time. Bite forces were not
different between ipsi- and contralesional sides, in contrast to contralesional hand-grip strength which was significantly impaired and did not improve during the observation period. On the first examination with a median of 40 days after stroke, masseter thickness was reduced contralesional, but did not continue to show significant side-differences during follow-up.
Conclusions Stroke affects the upper limb and the masseter muscles differently on a functional and morphological level. Further research is needed to evaluate the predictive value of oro-facial parameters on functional outcome after stroke. Clinical relevance Impaired chewing efficiency and reduced lip force are quantifiable symptoms in stroke patients which seem not to improve in absence of oro-facial rehabilitation procedures.
Keywords Stroke recovery . Chewing efficiency . Hand-grip strength . Bite force . Lip force . Masseter muscle thickness
Introduction
Infarction or hemorrhage in the region of the cortical masticatory area or the motoneuron pools in the brain stem [1] might affect oral sensation, and impair strength as well as coordination of the muscles involved in oro-facial function. Hence, many stroke survivors show symptoms like chewing difficulties, hoarding of food or the inability to form or position a bolus in prepara-tion for swallowing [2]. In hospitalized stroke patients, Oral Health Related Quality of Life proved to be sig-nificantly reduced, especially in the domains “functional limitation” and “physical pain” and was significantly related to their poor chewing function [3], but reports on its quantitative assessment are scarce [2, 4, 5].
M. Schimmel (*)
:
F. MüllerDivision of Gerodontology and Removable Prosthodontics, University of Geneva,
19, rue Barthélemy-Menn, 1205 Geneva, Switzerland e-mail: [email protected] B. Leemann
:
A. SchniderDivision of Neurorehabilitation at the Department for Clinical Neurosciences of the University Hospitals of Geneva, Geneva, Switzerland
F. R. Herrmann
:
F. MüllerDepartment of Internal Medicine, Rehabilitation and Geriatrics, University Hospitals of Geneva,
Geneva, Switzerland S. Kiliaridis
Division of Orthodontics, University of Geneva, Geneva, Switzerland
The cortical forearm representation area is closely located to the cortical masticatory area; thus, a lesion resulting from middle cerebral artery (MCA) stroke is likely to affect both hand and oro-facial function. However, anatomical- and transcranial magnetic stimulation (TMS) studies have revealed cortico-trigeminal projections from the motor cor-tex to both ipsi- and contralateral masseter motoneuron pools with contralateral dominance [6,7], whereas the hand is mainly guided by the contralateral hemisphere [8]. Thus, input pathways from the stomatognathic apparatus to the cerebral cortex and output pathways from the cerebral cor-tex to the muscles of the head and neck show cross domi-nance but the domidomi-nance may be less prominent compared with the spinal nerves that innervate the extremities [9]. Consequently, maximum bite forces in stroke patients are not reduced when compared to healthy controls [5,10], but hand-grip strength (HGS) is permanently impaired in the majority of stroke patients [11]. Although there seems to be an early onset of atrophy of the contralesional masseter muscle [12] there are no longitudinal observations to com-pare it to upper limb atrophy [13].
Tooth loss and the related loss of masticatory function may lead to a decreased intake of calories, protein, vitamins, and iron often resulting in mal- or undernutrition [14]. Thus impaired chewing and swallowing might contribute to the frequently observed weight loss [15] which seems to be linked to unfavorable functional outcome [16], or even mortality [17].
The aim of this study was to evaluate over 2 years lon-gitudinal changes in chewing efficiency, maximum restrain-ing lip force (MLF), maximum voluntary bite force (MBF), masseter muscle thickness (MMT), and HGS in stroke patients.
Material and methods
The study protocol was approved by the University Hospitals of Geneva’s ethics committee (N.A.C. CER 06-002/06-018). Written informed consent was obtained from each subject.
Subjects
Between November 2006 and December 2007, 31 patients recovering from stroke were recruited consecutively from the Division of Neurorehabilitation of the Department of Clinical Neurosciences of the University Hospitals of Geneva (Switzerland) by a senior consultant neurologist. Inclusion criteria comprised understanding of the patient information, consent to participate, a hemi-syndrome with facial palsy and the capability to perform various clinical tests. Previous stroke did not elude participation. The
National Institute of Health Stroke Scale (NIHSS) [18] was used to evaluate the neurological deficit.
A total of 24 healthy controls similar to the patient group in regard to age, gender and dental state were recruited from staff and patients of the Geneva Dental School.
Study design
The current study was designed as a cohort study (group definitions: stroke group, control group). Stroke patients were assessed as soon as possible after stroke [T1], after 6 [T2], 12 [T3] and 24 [T4] months. Controls were assessed at baseline [T1], after 12 [T3] and 24 [T4] months.
At T1, a cross-sectional (a priori) analysis comprised all study participants. For the longitudinal analysis only study participants who attended at least three out of four exami-nations were taken into consideration.
Some of the a priori analysis have been reported previ-ously, but are included for completeness [5,12].
Dental state
The total number of teeth, the DMFT (Decayed, Missing, Filled Teeth) index [19] and the number of occluding pre-molar units (OU) according to Kayser (1 pre-molar counts as 2 OU) [20] were noted. For the stroke patients, the number of occluding units was distinguished between the ipsi- or con-tralesional side.
Chewing efficiency
Chewing efficiency was quantified with a previously described color-mixing ability test [21]. Therefore, a two-colored chewing gum is masticated for 20 chewing cycles on the preferred chewing side, retrieved from the oral cavity, flattened to a 1-mm-thick wafer and evaluated opto-electronically. The ratio of unmixed azure color pixels (unmixed fraction [UF]) to the total pixel number in a fixed size template is calculated and serves as a measure for chewing efficiency. UF shows characteristics of a loga-rithmic function (log10) on the basis of chewing cycles [5]. It will decrease for two reasons: a higher degree of color blending and a loss in mass of the specimen due to sweetener extraction; both are measures for chewing efficiency [22]. Thus, the higher the UF, the lower is the chewing efficiency.
Maximum restraining lip force
MLF was evaluated using a hard resin screen (29× 17 × 2 mm) which was slightly curved to adapt to an average dental arch. The screen was placed in the oral vestibule and a perpendicular pulling force was applied via a steel wire
(diameter 0.9 mm, allowing for complete lip closure) connecting the plate in the midline to a traction dynamometer (Imada digital force gauge; Imada Co., Toyohashi, Japan). The participant was asked to withstand the displacement force as long as possible; three measurements were averaged for analysis.
Maximum voluntary bite force
MBF was assessed with a digital force gauge with an 8.6-mm-thick bite element (Occlusal Force-Meter GM 10®; Nagano Keiki Co. Ltd., Tokyo, Japan) [23]. The sensor was placed between the first molars of each side separately and the participant was asked to exert a maximum clenching effort but to stop when she/he started feeling uncomfortable. For the patient group, the means of three readings of the contralesional side and the ipsilesional side were calculated separately. For the controls, the mean of six recordings (3× right, 3× left) was used for analysis.
Hand-grip strength
HGS was measured using a Baseline® Hydraulic Hand Dynamometer (Baseline Evaluation Instruments, White Plains, NY, USA) which measures grip strength equiva-lently to a Jamar® Hand Dynamometer [24]. In the patient group, the mean value of three recordings of the contrale-sional and the ipsilecontrale-sional sides was used for analysis. For the control group, the mean of six recordings (3× right, 3× left) was calculated.
Masseter muscle thickness
MMT in contracted muscle condition was quantified with a real time ultrasound scanner (FALCO 100, linear array transducer [6–8 MHz], PieMedical, The Netherlands) fol-lowing a previously described protocol [25]. In the patient group, the mean of two readings of the contralesional and the ipsilesional sides of each were used for analysis. In the control group, the mean of four recordings (2× right, 2× left) was calculated. The error of the method in contracted muscle condition was reported to be between 0.2 and 0.4 mm [25,26].
Statistical analysis
Continuous data are expressed as median values followed by the interquartile range in brackets; normal distribution of variables was confirmed with the Shapiro–Francia W′ test. Categorical variables were compared using Fisher’s exact test. Correlations were calculated using the Spearman rank correlation method. The level of significance was set atα< 0.05; sample size calculation could not be performed due to the absence of reference data. Statistical tests were
performed using Stata Statistical Software release 11.1 (Stata Corporation, College Station, TX, USA).
A priori cross-sectional analysis at T1
The null hypothesis for the a priori cross-sectional analysis at T1 was that there was no difference in the investigated parameters between stroke and patient groups [5,12]. Non-parametric tests (Mann–Whitney) were applied to detect differences between patients with follow-up and drop-outs and the Wilcoxon tests to compare sides of the same subjects.
Missing values and drop-outs
Because repeated measures analyses require that there are no missing values, imputation techniques might help replac-ing some missreplac-ing data. However, because of the high drop-out rate only patients and controls who attended at least three out of four examinations (fupPG and fupCG, respec-tively) were included in the analysis to avoid an imputation bias [27]. However, control group (fupCG) data from T1 were carried forward to T2, as they were only seen at T1, T3 and T4. One stroke patient’s T2 and another patient’s T4 data were missing and imputed by carrying forward their previous value (from fupPG). Simple and multiple logistic regression models served to identify factors which could predict the dropout and provided odds ratios (OR).
Longitudinal analysis
The null hypothesis for the longitudinal analysis was that there is no difference between the stroke and control groups and no improvement over the observation period in the investigated parameters.
As no non-parametric test can simultaneously compare groups and deal with repeated measures, analysis of follow-up data comprised analysis of variance (ANOVA) with correction for repeated measures using box’s conservative epsilon. The correcting factors were stroke (patient or con-trol group) and time points as the repeated factor. The results of the Shapiro–Francia W′ tests were non-significant for all investigated parameters (all p > 0.05); furthermore, the empirical rule of Harrel was respected [28].
Results
Brain lesions were confirmed with MRI among admission to the hospital. All 31 participants suffered from hemiparesis; among them were 17 with a combined motor and sensory deficit (Table1). Patients were seen after a median of 40.0 (22.0) days after stroke.
Of the initially recruited patient group [5], nine partic-ipants returned for the first follow-up assessment [T2, 213.0 (15.0) days after T1], ten for the second [T3, 395.0 (35.0) days post T1] and nine for the final examination [T4, 754.0 (32.0) post T1]. At T2, from the 31 patients, six had with-drawn their consent, three had moved abroad, six could not be contacted (and could not be traced down by the popula-tion registrapopula-tion office), three patients were too ill to partic-ipate and three had passed away. At T3, one patient had recovered sufficiently to return for the assessment and at T4 another patient had died. Ten [T3, 404.0 (36.0) post T1], respectively 9 [T4, 739.0 (38.0) post T1] matched control subjects were followed up. The time span between T1 to T3 and T1 to T4 was not different between stroke patients and controls (p00.623 and p00.535, respectively; Mann– Whitney). The NIHSS score did not predict the return for follow-up (OR00.91; 95 % confidence interval [CI], 0.724– 1.144; p00.419; pseudo r200.0180; logistic regression).
Patients had been hospitalized for a median time of 55 (68) days. They had received a normal unmixed hospital diet and followed an individualized rehabilitation program (Table2).
For the T2 evaluation, all patients but one lived at home. The only exception was still hospitalized at T2, but returned for T3 and T4.
Dental state
At T1, patients and the controls were not different regarding dental state, age or gender [5]. However, patients who returned for the follow-up assessments had initially a sig-nificantly lower DMFT score (p00.0397, Mann–Whitney),
more teeth (p00.0419, Mann–Whitney), and also more
occluding premolar units (p00.0484, Mann–Whitney) (OU contralesional side 4.0 (6.0), OU ipsilesional side 3.5 (4.0), p00.3104, Wilcoxon) than those who were not available for follow-up (Table 1). Although six of ten patients with follow-up underwent dental treatment after their stroke, according to the ANOVA model there was no signifi-cant change over time in occluding premolar units (F3,7200.03, pBOX00.8708, interaction term: F3,720 0.03, pBOX00.8708).
Lower DMFT scores (OR00.88; 95 % CI, 0.768–0.999; p00.047; pseudo r200.1177; logistic regression) and also the number of occluding units (OR 1.25; 95 % CI, 1.004– 1.542; p00.046; pseudo r200.1161, logistic regression) pre-dicted significantly the participation in the follow-up exami-nations. Thus, each additional occlusal unit increased the chance for follow-up by 24.5 % and each lower DMFT score by 14.2 %.
Chewing efficiency
At T1, stroke patients chewed significantly less efficient than their corresponding controls [5]. One patient could not be assessed, because she wore no lower denture (Table 3). At T1, patients who later returned for follow-up chewed significantly better than those who dropped out (p0 0.0209, Mann–Whitney). Lower UF scores, indicating a higher chewing efficiency, predicted significantly the par-ticipation in the follow-up (OR04.15−10; 95 % CI, 1.28−18 to 0.1342; p00.031; pseudo r200.1509; logistic regression). The ANOVA model showed no change in UF over time (F3,7200.52, pBOX00.4792, interaction term: F3,7201.03, pBOX00.3192) but a tendency to be influenced by the stroke (F1,7203.30, p00.0733).
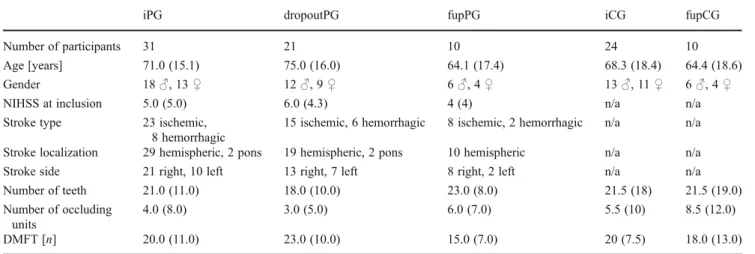
Table 1 Characteristics of study participants; data presented as median (interquartile range)
iPG dropoutPG fupPG iCG fupCG
Number of participants 31 21 10 24 10
Age [years] 71.0 (15.1) 75.0 (16.0) 64.1 (17.4) 68.3 (18.4) 64.4 (18.6)
Gender 18♂, 13 ♀ 12♂, 9 ♀ 6♂, 4 ♀ 13♂, 11 ♀ 6♂, 4 ♀
NIHSS at inclusion 5.0 (5.0) 6.0 (4.3) 4 (4) n/a n/a
Stroke type 23 ischemic, 8 hemorrhagic
15 ischemic, 6 hemorrhagic 8 ischemic, 2 hemorrhagic n/a n/a Stroke localization 29 hemispheric, 2 pons 19 hemispheric, 2 pons 10 hemispheric n/a n/a Stroke side 21 right, 10 left 13 right, 7 left 8 right, 2 left n/a n/a Number of teeth 21.0 (11.0) 18.0 (10.0) 23.0 (8.0) 21.5 (18) 21.5 (19.0) Number of occluding
units
4.0 (8.0) 3.0 (5.0) 6.0 (7.0) 5.5 (10) 8.5 (12.0)
DMFT [n] 20.0 (11.0) 23.0 (10.0) 15.0 (7.0) 20 (7.5) 18.0 (13.0)
iPG initially recruited patients group, dropoutPG patients who dropped out of the study after first assessment, fupPG patients who returned for follow-up, iCG initial control group, fupCG control group with follow-up, NIHSS National Institute of Health Stroke Scale, DMFT number of decayed, missing, filled teeth
In the control group with follow-up, UF was negatively correlated with the number of occluding premolar units, thus the more premolar units were present, the better the chewing efficiency (T1: rho0−0.798, p00.0166; T3: rho0−0.836, p00.0121; T4: rho0−0.678; p00.0420, Spearman rank cor-relation). In the patient group with follow-up, this effect was not present (T1: rho0−0.477, p00.6333; T2: rho0−0.457,
p00.1701; T3: rho0−0.250, p00.4532; T4: rho0−0.616,
p00.0647, Spearman rank correlation). Maximum restraining lip force
At T1, MLF was significantly lower in stroke patients than in the controls [5] (Table4). The ANOVA model showed no
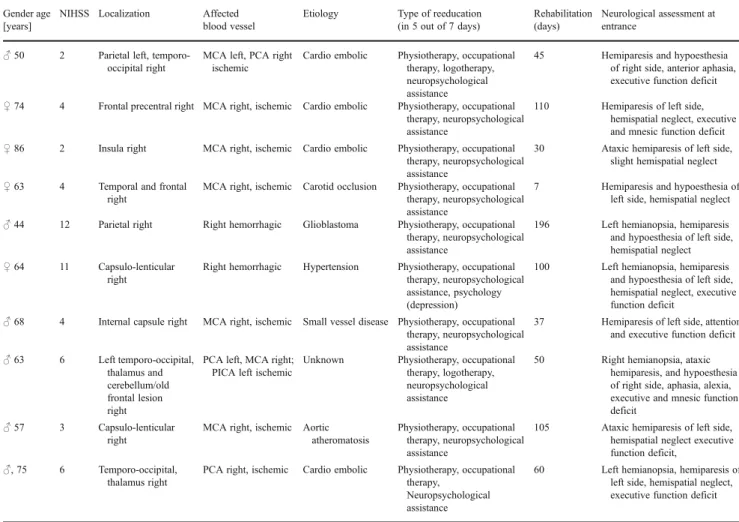
Table 2 Description of the study population who were available for follow-up assessments Gender age
[years]
NIHSS Localization Affected blood vessel
Etiology Type of reeducation (in 5 out of 7 days)
Rehabilitation (days)
Neurological assessment at entrance
♂ 50 2 Parietal left, temporo-occipital right
MCA left, PCA right ischemic
Cardio embolic Physiotherapy, occupational therapy, logotherapy, neuropsychological assistance
45 Hemiparesis and hypoesthesia of right side, anterior aphasia, executive function deficit ♀ 74 4 Frontal precentral right MCA right, ischemic Cardio embolic Physiotherapy, occupational
therapy, neuropsychological assistance
110 Hemiparesis of left side, hemispatial neglect, executive and mnesic function deficit ♀ 86 2 Insula right MCA right, ischemic Cardio embolic Physiotherapy, occupational
therapy, neuropsychological assistance
30 Ataxic hemiparesis of left side, slight hemispatial neglect ♀ 63 4 Temporal and frontal
right
MCA right, ischemic Carotid occlusion Physiotherapy, occupational therapy, neuropsychological assistance
7 Hemiparesis and hypoesthesia of left side, hemispatial neglect ♂ 44 12 Parietal right Right hemorrhagic Glioblastoma Physiotherapy, occupational
therapy, neuropsychological assistance
196 Left hemianopsia, hemiparesis and hypoesthesia of left side, hemispatial neglect ♀ 64 11 Capsulo-lenticular
right
Right hemorrhagic Hypertension Physiotherapy, occupational therapy, neuropsychological assistance, psychology (depression)
100 Left hemianopsia, hemiparesis and hypoesthesia of left side, hemispatial neglect, executive function deficit
♂ 68 4 Internal capsule right MCA right, ischemic Small vessel disease Physiotherapy, occupational therapy, neuropsychological assistance
37 Hemiparesis of left side, attention and executive function deficit ♂ 63 6 Left temporo-occipital,
thalamus and cerebellum/old frontal lesion right
PCA left, MCA right; PICA left ischemic
Unknown Physiotherapy, occupational therapy, logotherapy, neuropsychological assistance
50 Right hemianopsia, ataxic hemiparesis, and hypoesthesia of right side, aphasia, alexia, executive and mnesic function deficit
♂ 57 3 Capsulo-lenticular right
MCA right, ischemic Aortic atheromatosis
Physiotherapy, occupational therapy, neuropsychological assistance
105 Ataxic hemiparesis of left side, hemispatial neglect executive function deficit,
♂, 75 6 Temporo-occipital, thalamus right
PCA right, ischemic Cardio embolic Physiotherapy, occupational therapy,
Neuropsychological assistance
60 Left hemianopsia, hemiparesis of left side, hemispatial neglect, executive function deficit
MCA middle cerebral artery, PCA posterior cerebral artery, PICA posterior inferior cerebellar artery
Table 3 Chewing efficiency expressed as ratio of unmixed azure color in an image of fixed size (UF)
UF T1 T2 T3 T4
Initial groups Drop-outs With follow-up Patients 0.0991 (0.0785), n030 0.1085 (0.0642),n020 0.0570 (0.0840),n010 0.0527 (0.0799),n09 0.0299 (0.0522), n010 0.0584 (0.0958), n09 Controls 0.0380 (0.0365), n024 0.0380 (0.0260),n014 0.0360 (0.0480),n010 0.0362 (0.0456),n010 0.0286 (0.0371), n09
Data presented as median (interquartile range). The higher the ratio, the lower is the chewing efficiency. Of the initial patient-group (iPG, n031), only ten participants were available for follow-up (fupPG). The initial control group (iCG, n024) was matched in age, dental state and number to the stroke patients. T2, T4, n09, last value carried forward for one patient
change of MLF over time (F3,7200.40, pBOX00.5327, inter-action term: F3,7200.28, pBOX00.6025) but an influence of stroke (F1,7205.43, p00.0226), with stroke patients having a lower MLF (−1.08±1.18 N).
Maximum voluntary bite force
At T1, MBF was neither different between the contra- and ipsilesional sides nor different to the controls [5] (Table4). Higher maximum bite forces on the contralesional side in the stroke patients predicted significantly their participation in the follow-up (OR01.01; 95 % CI, 1.001–1.019; p0
0.024; pseudo r200.3090; logistic regression). Each
Newton additional bite force on the contralesional side increased the likelihood for a follow-up by 1 %.
When comparing the MBF of the contra- and ipsilesional side in patients with follow-up, the ANOVA model demon-strated neither a significant change over time of the contrale-sional side (F1,14200.05, pBOX00.8191, interaction term:
F1,14200.03, pBOX00.8526) nor an influence of the side
(contralesional/ipsilesional)(F1,14200.52, p00.4716). For MBF on the contralesional side in participants with follow-up, the ANOVA model showed no change over time (F3,7100.07, pBOX00.7963, interaction term: F3,7100.05, pBOX00.8210) but a significant influence of the stroke (F1,7106.95, p00.0103), with stroke patients having a
higher MBF on the contralesional side than the controls (+104.7 ±100.1 N).
MBF on the ipsilesional side in the stroke patients did not change over time (F3,7100.02, pBOX00.8968, interaction term: F3,7100.04, pBOX00.8521) and was not different to controls (F1,7102.58, p00.1124).
Two years after stroke [T4], MBF on the stroke patient’s contralesional side was significantly correlated with the num-ber of occlusal units on that side (rho00.691, p00.0398, Spearman rank correlation). This effect was not present at any precedent time point (T1: rho0−0.051, p00.8846; T2: rho00.506, p00.1288; T3: rho00.500, p00.1334, Spearman rank correlation). In contrast, on the ipsilesional side, MBF was not correlated with the number of occlusal units at T1 (rho00.336, p00.3417, Spearman rank correlation), but at all following assessments (T2: rho00.838, p00.0119; T3: rho0 0.820, p00.0139; T4: rho00.809, p00.0154, Spearman rank correlation). In the control group, MBF was correlated with the total number of occlusal units at all time points (0.792< rho<0.862, 0.0097<p<0.0175, Spearman rank correlation). Hand-grip strength
At T1, contralesional HGS was significantly weaker than ipsilesional HGS (p<0.0001, Wilcoxon) and weaker than in controls (p < 0.0001, Mann–Whitney). No difference was
Table 4 Maximum lip restraining force (MLF, [N]), maximum voluntary bite force (MBF, [N]: at T1, four patients were excluded for MBF because of missing teeth), hand-grip strength (HGS, [N]) and masseter muscle thickness in contracted muscle condition (MMT, [mm])
T1 T2 T3 T4
Initial groups Drop-outs With follow-up
MLF [N]: patients 6.5 (3.1), n029 5.1 (2.1), n019 7.6 (3.2), n010 8.8 (3.5), n09 7.8 (2.0), n010 6.8 (2.8), n09 MLF [N]: controls 8.4 (3.3), n024 8.9 (3.6), n014 7.5 (4.6), n010 9.3 (2.4), n010 7.8 (2.6), n09 MBF [N]: patients, contralesional 145.0 (153.0), n027 113.2 (103.6), n018 283.3 (171.0), n09 323.7 (433.3), n09 405.9 (274.0), n010 356.2 (344.6), n09 MBF [N]: patients, ipsilesional 139.0 (128.0), n027 91.5 (128.0), n018 254.0 (300.7), n09 260.7 (283.7), n09 313.2 (408.0), n010 271.0 (448.0), n09 MBF [N]: controls, mean ri, le 146.9 (195.3), n024 141.9 (91.5), n014 176.1 (307.3), n010 133.5 (264.5), n010 140.3 (390.6), n09 HGS [N]: patients, contralesional 22.6 (107.9), n028 16.7 (49.0), n019 117.7 (198.1), n09 188.3 (95.1), n09 196.1 (137.3), n010 129.4 (166.7), n09 HGS [N]: patients, ipsilesional 261.8 (151.0), n028 255.0 (183.4), n019 274.6 (130.4), n09 342.3 (124.5), n09 355.0 (156.9), n010 341.3 (144.2), n09 HGS [N]: controls, mean ri, le 274.6 (198.1), n023 252.0 (199.1), n013 297.1 (184.4), n010 289.3 (221.6), n010 297.1 (189.3), n09 MMT [mm]: patients, contralesional 13.18 (4.00), n030 12.43 (3.55), n020 13.80 (2.15), n010 14.85 (3.90), n09 14.70 (3.1), n010 14.95 (5.1), n09 MMT [mm]: patients, ipsilesional 13.50 (2.40), n030 13.18 (1.93), n020 14.00 (3.75), n010 14.25 (4.35), n09 13.70 (3.40), n010 14.7 (5.00), n09 MMT [mm]: controls, mean ri, le 14.31 (4.49), n024 14.31 (4.20), n014 13.83 (6.75), n010 13.78 (6.28), n010 14.28 (6.28), n09 Data presented as median (interquartile range). T2, T4 n09, last value carried forward for one patient
found between controls and the patient group's ipsilesional side (p00.6225, Mann–Whitney) (Table4).
When comparing contralesional and ipsilesional HGS of patients with follow-up, the ANOVA model demonstrated no significant change over time of the contralesional hand
(F3,14200.26, pBOX00.6121, interaction term F3,14200.12,
pBOX00.7263) but an significant influence of the side (con-tralesional/ipsilesional) (F1,142014.73, p00.0002) with lower strength on the contralesional side (−197.1±82.87 N).
Stroke patients had lower contralesional HGS compared to controls (−202.0±57.86 N, F1,71030.13, p<0.0001,
ANOVA) without improvement over time (F3,7100.14,
pBOX00.7096, interaction term F3,7100.33, pBOX00.5692, ANOVA).
According to the ANOVA model, there was no change over time in HGS on the ipsilesional side (F3,7100.16, pBOX00.6888, interaction term: F3,7100.05, pBOX00.8168) and no difference to the controls (F1,71<0.01, p09805). Masseter muscle thickness
At T1, there was a significant difference in MMT between contra- and ipsilesional sides, but not between cases and controls [12] (Table4).
During follow-up, this difference was no longer present. When comparing contra- and ipsilesional MMT, the ANOVA model demonstrated no change over time
(F3,14400.01, pBOX00.9178, interaction term: F3,14400.02,
pBOX00.9017) and no influence of the side (contralesional/ ipsilesional) (F1,14200.09, p00.7610).
The ANOVA model did not show a change in MMT on the contralesional side over time in the participants with follow-up (F3,72< 0.01, pBOX00.9494, interaction term F3,7200.01, pBOX00.9427) and no influence of stroke (F1,7100.28, p00.5974). For the ipsilesional side there was also no change over time (F3,7200.02, pBOX00.8848, inter-action term F3,7200.01, pBOX00.9179) and no influence of stroke (F1,7100.01, p00.9300).
Discussion
Chewing efficiency and maximum lip restraining force The current study demonstrates that the chewing efficiency of stroke patients, when compared to a control group with similar dental state, is reduced. This confirms and refines previous findings in the literature [4]. The high drop-out rate weakened the statistical power; the ANOVA model however confirmed a tendency for lower chewing efficiency within the patient group during the 2 years.
In healthy subjects, chewing efficiency is largely depended on the number of occluding units and thus the
total surface of posterior antagonist tooth contact [29]. Furthermore, maximum bite force, saliva flow rate, the function of lip, cheek, tongue and the soft palate play a distinct role [30,31]. Six out of ten patients in this study underwent dental treatment during the first 12 months fol-lowing stroke. Restorative measures were expected to improve masticatory efficiency but in this present cohort it was not the case. In contrast to the control group their chewing efficiency was not correlated to the number of occlusal units. This supports the hypothesis that the reduced chewing efficiency in stroke patients might rather be domi-nated by neurophysiological impairment of the oro-facial structures [32,33] than the dental state [2].
Most of the current patients suffered from lesions in the region of the primary motor cortex M1 supposedly affecting the cortical facial representation area [34]. Although bilat-eral innervation of the lower facial muscles was suggested, the most frequent abnormality found in patients with central facial paresis is the contralesional loss of motor evoked potentials [35] which was indirectly confirmed by the cur-rent study. However, central paresis of the lower facial muscles is often discrete [32].
At T1, chewing efficiency could be significantly pre-dicted from the maximum lip force [5], hence the latter might have essentially contributed to the poor mastication following stroke. In the current analysis, patients demon-strated a significant lower lip force than their controls with no significant improvement over the whole observation period. This confirms the findings from Hägg et al. [36], who employed a similar method to evaluate lip force as used in the present study. They reported mean lip forces of 7 N (0–27 N) in patients with central facial palsy which was significantly lower than in a healthy control group [36]. The current results suggest a recovery plateau that might, as a consequence, lead to a chronic disability when no specific rehabilitation measures are prescribed.
Even in chronic stroke patients, functional improvement can be achieved [37]; however, oro-facial training proce-dures are still scarce [36]. The current results suggest that conventional dental rehabilitation procedures with the goal to increase the number of occluding dental units as a unique intervention will not significantly improve the masticatory function in stroke patients. Strengthening and increasing the co-ordination of the facial and chewing muscles is more l i k e l y t o i m p r o v e t h e m a s t i c a t o r y p e r f o r m a n c e . Malnutrition is an issue with stroke patients [38], and a good chewing efficiency is a prerequisite for a better food comminution and a wider food choice [39].
Maximum voluntary bite force
The current study reveals contradictory evidence to the maximum bite force in stroke patients. The results at T1
support findings from earlier studies which show no signifi-cant differences in bite force either between the contra- and ipsilesional sides [10,40–43] or between stroke patients and controls [10].
Furthermore, the present results suggest a considerable difference in the motor impairment between jaw adducting-and upper limb muscles following unilateral stroke. Whereas contralesional jaw closing forces were not reduced, the corresponding HGS was significantly compromised. This confirms findings of Kemppainen et al. [42], who detected significant side differences in finger grip force but not in maximum bite force, in their study involving 16 stroke patients with hemiparesis. The current study helps extending their findings through longitudinal observations. The different impairment patterns may be a result of dissim-ilarities in the cortical control of the jaw closing muscles and those of the upper limb. The contralateral primary motor cortex M1 is the main origin of fibre pathways ultimately descending to the spinal cord neurons which are engaged into unilateral hand movements [8]. In contrast, corticobul-bar fibres project from the cortical masticatory area to tri-geminal motor nuclei in the pons of both sides [6]. Using focal TMS of the cortical representation area of the masseter muscle, bilateral muscle evoked potentials can be induced, providing functional proof of bilateral corticobulbar projec-tions to the trigeminal motoneuron pools. Contralateral responses are larger than those evoked in the ipsilateral muscle, suggesting a stronger contralateral projection [7].
The ANOVA model demonstrated in follow-up patients significantly higher forces on the contralesional side than in their controls. Jaw closing forces are generated through the jaw closing muscles and peak bite force measurements depend significantly on the dental state [44,45]. The high number of occluding posterior teeth of the patients with follow-up might partly explain the results, although there was no significant difference in occluding units between patients and controls. However, six out of ten patients had teeth replaced in between T1 and T2, whereas the controls did not undergo any restorative treatments. This might have contributed to the difference in bite force, even though the chewing efficiency remained unchanged. It has to be born in mind that the assessment of unilateral biting forces is diffi-cult, since the mandible is a solid bone and acts as a lever. Exact unilateral forces between teeth are difficult to meas-ure, because activation of the contralateral jaw closing muscles will always influence ipsilateral forces.
Hand-grip strength and masseter muscle thickness
The current study revealed a significant weakness of the paretic hand and no significant improvement over time. Carin-Levy et al. [46] investigated longitudinal changes in 17 stroke patients. They did not detect differences in HGS of
the ipsilesional side and control patients, but significantly lower forces of the paretic hand with no significant improve-ment over 6 months [46]. Patients of the present study have been examined with a median delay of 40 days after stroke. It is known that most functional recovery is spontaneous or can be observed within the first 2 months after stroke [47]; hence this initial recovery is not considered in the present T1 assess-ments. During the subsequent 2-year observation period, no further significant improvement of HGS was noted. Patients might have adapted to their disability through using the con-tralesional arm as best as they can while compensating for functional deficits with the intact arm, which might have led to long-lasting learned non-use [48].
The results of the current study may allow comparing the morphological effects of unilateral stroke on the masseter muscle with literature findings on the upper limb muscles. In stroke patients, a significant muscle atrophy of the upper limb can be observed [13], which may be attributed to disuse or altered central neural innervation, yet morpholog-ical evidence is scarce. A recent systematic review com-bined results from four studies and reported significant lower lean tissue mass in the paretic compared with the non-paretic upper limb in patients at least 6 months post stroke [13].
As reported previously [12], a small, yet significant side difference in MMT was observed in the current study pop-ulation at T1. After 6 months, this difference was no longer present, but it has to be borne in mind that at this stage the study might have been underpowered. However, Uematsu et al. [49], who compared the cross-sectional area of masseter and medial pterygoid obtained by CT in 24 hemiplegic stroke patients support the present findings. They also did not find significant differences between contra- and
ipsile-sional sides more than 3 months after stroke [49].
Morphological recovery of the contralesional masseter muscles may have occurred within the first 6 months. Therefore, stroke seems to affect the upper limb muscles and the masseter muscle differently which supports the functional results of the currents study on a morphological level.
Study strengths and limitations
Mortality is high after acute ischemic stroke, about 25 % of patients die within the first 30 days after the event, and about half of the stroke patients within 1 year [50]. One-month mortality rates for hemorrhagic stroke are even worse with almost 50 % [51]. Following rehabilitation only 50–
60 % of stroke survivors will regain independence in activ-ities of daily living [47,50,52,53], with most improvement being seen in the first 6 months post stroke [11].
Thus, it is“disease-inherent” that drop-out rates are very high such as in the study of Carin-Levy et al. [46], who
reported on a 6-month observation period in stroke patients and showed drop-out rates similar to the current study (52 % to 88 % [46]).
Patient drop-out may be due to active refusal or passive loss to follow-up, such as death or severe impairment. Of the 21 patients who dropped out of the study, only six withdrew their consent and further three had moved abroad (active drop-out). The remaining 12 drop-outs were at the 6-months evaluation either dead, too disabled to participate or could not be traced down by means of the Swiss population registry and consequently have to be considered passive drop-outs.
The drop-out rate of the current study is 68 % which may prelude avoiding type II errors. This has to be considered an unavoidable, yet severe limitation. However, the current study seems the first report on longitudinal observations in stroke patients with regard to oro-facial impairment. Thus, no sample size calculation c ou ld be performed. Nevertheless, the final number of participants was suffi-ciently high to demonstrate significant differences in HGS, maximum lip force and a tendency for chewing efficiency.
Although an unexpected finding, drop-out could be predicted from poor dental state, low chewing efficiency and low maximum bite forces. These factors are symp-toms of oral-phase dysphagia [2, 3, 54] and thus might predict quality of life or even mortality. Further research is needed to study in depth the role of oral health in stroke rehabilitation.
In the current study the NIHSS did not predict a follow-up, although it was described to be significantly associated with long-term functional outcome after stroke [55, 56]. This might be due to the high drop-out rate which might have impeded statistical significance.
Summary and conclusion
Impaired chewing efficiency and reduced lip force are quan-tifiable symptoms of impairment following stroke. In absence of functional rehabilitation, these symptoms seem not to improve. Rehabilitation after stroke should also seek to improve the strength and co-ordination of oro-facial muscles to improve chewing efficiency and help avoiding weight loss and malnutrition. Additionally it might be con-cluded that stroke affects the upper limb- and the masseter muscle differently on a functional and morphological level. Further research is needed to evaluate the predictive value of oro-facial parameters on functional outcome after stroke.
Acknowledgements This study was supported by the Swiss National Science Foundation, grant no 3200B0-108239. The assistance of Dr. Panagiotis Christou during some of the experiments is gratefully acknowledged.
Disclosures The authors declare that they have no conflict of interest.
References
1. Onozuka M, Fujita M, Watanabe K, Hirano Y, Niwa M, Nishiyama K, Saito S (2002) Mapping brain region activity during chewing: a functional magnetic resonance imaging study. J Dent Res 81:743– 746
2. Axelsson K, Asplund K, Norberg A, Eriksson S (1989) Eating problems and nutritional status during hospital stay of patients with severe stroke. J Am Diet Assoc 89:1092–1096
3. Schimmel M, Leemann B, Christou P, Kiliaridis S, Schnider A, Herrmann FR, Müller F (2011) Oral health-related quality of life in hospitalised stroke patients. Gerodontology 28:3–11
4. Kim IS, Han TR (2005) Influence of mastication and salivation on swallowing in stroke patients. Arch Phys Med Rehabil 86:1986– 1990
5. Schimmel M, Leemann B, Herrmann FR, Kiliaridis S, Schnider A, Müller F (2011) Masticatory function and bite force in stroke patients. J Dent Res 90:230–234
6. Kuypers HG (1958) Corticobular connexions to the pons and lower brain-stem in man: an anatomical study. Brain 81:364–388 7. Nordstrom MA (2007) Insights into the bilateral cortical control of
human masticatory muscles revealed by transcranial magnetic stimulation. Arch Oral Biol 52:338–342
8. Kazennikov R, Roland PE, O'Sullivan BT (1999) Neural activity of supplemantary and primary motor areas in monkeys and its relation to bimanual and unimaual movement sequences. Neuroscience 89:661–674
9. Hall JL, Humbertson AO Jr (1968) The autonomic nervous sys-tem. Prog Neurol Psychiatry 23:253–270
10. Crow HC, Chutkow JG, Flanagan PM, McCall WD (1990) Jaw Force in stroke patients and normal subjects. J Dent Res 69:274, Abstract 1321
11. Kwakkel G, Kollen BJ, Wagenaar RC (2002) Long term effects of intensity of upper and lower limb training after stroke: a rando-mised trial. J Neurol Neurosurg Psychiatry 72:473–479
12. Schimmel M, Leemann B, Christou P, Schnider A, Müller F, Kiliaridis S (2010) Masseter muscle thickness in hospitalised stroke patients. J Oral Rehabil 37:726–730
13. English C, McLennan H, Thoirs K, Coates A, Bernhardt J (2010) Loss of skeletal muscle mass after stroke: a systematic review. Int J Stroke 5:395–402
14. Sheiham A, Steele J (2001) Does the condition of the mouth and teeth affect the ability to eat certain foods, nutrient and dietary intake and nutritional status amongst older people? Public Health Nutr 4:797–803
15. Brynningsen PK, Damsgaard EM, Husted SE (2007) Improved nutritional status in elderly patients 6 months after stroke. J Nutr Health Aging 11:75–79
16. Davalos A, Ricart W, Gonzalez-Huix F, Soler S, Marrugat J, Molins A, Suner R, Genis D (1996) Effect of malnutrition after acute stroke on clinical outcome. Stroke 27:1028–1032
17. FOODTrialCollaboration (2003) Poor nutritional status on admis-sion predicts poor outcomes after stroke: observational data from the FOOD trial. Stroke 34:1450–1456
18. Brott T, Adams HP Jr, Olinger CP, Marler JR, Barsan WG, Biller J, Spilker J, Holleran R, Eberle R, Hertzberg V et al (1989) Measurements of acute cerebral infarction: a clinical examination scale. Stroke 20:864–870
19. WHO (1987) Oral health surveys: basic methods, 3rd edn. World Health Organization, Geneva, pp 34–37
20. Kayser AF (1981) Shortened dental arches and oral function. J Oral Rehabil 8:457–462
21. Schimmel M, Christou P, Herrmann FR, Müller F (2007) A two-colour chewing gum test for masticatory efficiency: development of different assessment methods. J Oral Rehabil 34:671–678 22. van der Bilt A, Mojet J, Tekamp FA, Abbink JH (2010) Comparing
masticatory performance and mixing ability. J Oral Rehabil 37:79–84 23. Nakatsuka K, Usui T, Masuda Y, Rugh J, Kurihara S (2006) Accuracy and repeatability of the GM10 occlusal force-meter. Nihon Kyosei Shika Gakkai Taikai Puroguramu, Shorokushu 65:336
24. Mathiowetz V, Vizenor L, Melander D (2000) Comparison of baseline instruments to the Jamar dynamometer and the B&L engineering pinch gauge. Occup Ther J Res 20:147–162 25. Kiliaridis S, Kalebo P (1991) Masseter muscle thickness measured
by ultrasonography and its relation to facial morphology. J Dent Res 70:1262–1265
26. Botteron S, Verdebout CM, Jeannet PY, Kiliaridis S (2009) Orofacial dysfunction in Duchenne muscular dystrophy. Arch Oral Biol 54:26–31
27. Durrant GB (2005) Imputation methods for handling item— nonresponse in the social sciences: a methodological review. NCRM Methods Rev Pap 002:4.7
28. Harrell FE Jr, Lee KL, Califf RM, Pryor DB, Rosati RA (1984) Regression modelling strategies for improved prognostic predic-tion. Stat Med 3:143–152
29. Bourdiol P, Mioche L (2000) Correlations between functional and occlusal tooth-surface areas and food texture during natural chew-ing sequences in humans. Arch Oral Biol 45:691–699
30. Ikebe K, Matsuda K, Morii K, Furuya-Yoshinaka M, Nokubi T, Renner RP (2006) Association of masticatory performance with age, posterior occlusal contacts, occlusal force, and salivary flow in older adults. Int J Prosthodont 19:475–481
31. Mazari A, Heath MR, Prinz JF (2007) Contribution of the cheeks to the intraoral manipulation of food. Dysphagia 22:117–121 32. Schimmel M, Leemann B, Christou P, Kiliaridis S, Herrmann F,
Müller F (2011) Quantitative assessment of facial muscle impair-ment in patients with hemispheric stroke. J Oral Rehabil [Epub ahead of print]:doi:10.1111/j.1365-2842.2011.02219.x
33. Yildiz N, Ertekin C, Ozdemirkiran T, Yildiz SK, Aydogdu I, Uludag B, Secil Y (2005) Corticonuclear innervation to facial muscles in normal controls and in patients with central facial paresis. J Neurol 252:429–435
34. Morecraft RJ, Louie JL, Herrick JL, Stilwell-Morecraft KS (2001) Cortical innervation of the facial nucleus in the non-human primate — a new interpretation of the effects of stroke and related subtotal brain trauma on the muscles of facial expression. Brain 124:176–208
35. Yildiz S, Bademkiran F, Yildiz N, Aydogdu I, Uludag B, Ertekin C (2007) Facial motor cortex plasticity in patients with unilateral peripheral facial paralysis. NeuroRehabilitation 22:133–140 36. Hägg M (2007) Sensimotory brain plasticity in stroke patients with
dysphagia. Dissertation, University of Uppsala, Uppsala, pp 42–47 37. Page SJ, Gater DR, Bach YRP (2004) Reconsidering the motor recovery plateau in stroke rehabilitation. Arch Phys Med Rehabil 85:1377–1381
38. Foley NC, Martin RE, Salter KL, Teasell RW (2009) A review of the relationship between dysphagia and malnutrition following stroke. J Rehabil Med 41:707–713
39. Müller F, Nitschke I (2005) Oral health, dental state and nutrition in older adults. Z Gerontol Geriatr 38:334–341
40. Iwatsuki H, Yasutoshi I, Shinoda K (2001) Deep friction massage on the masticatory muscles in stroke patients increases biting force. J Phys Ther Sci 13:17–20
41. Kawasaka T, Shimodozono M, Ogata A, Tanaka N, Kawahira K (2010) Salivary secretion and occlusal force in patients with uni-lateral cerebral stroke. Int J Neurosci 120:355–360
42. Kemppainen P, Waltimo A, Palomaki H, Salonen O, Kononen M, Kaste M (1999) Masticatory force and function in patients with hemispheric brain infarction and hemiplegia. J Dent Res 78:1810– 1814
43. Okamoto I, Horiguchi M, Suganuma H, Kamakura K (1993) Biting force in stroke patients. Sogo Rihabiriteshon 21:45–50 44. Ikebe K, Matsuda K, Murai S, Maeda Y, Nokubi T (2010)
Validation of the Eichner index in relation to occlusal force and masticatory performance. Int J Prosthodont 23:521–524
45. Müller F, Hernandez M, Grütter L, Aracil-Kessler L, Weingart D, Schimmel M (2012) Masseter muscle thickness, chewing effi-ciency and bite force in edentulous patients with fixed and remov-able implant-supported prostheses: a cross-sectional multicenter study. Clin Oral Implants Res 23:144–150
46. Carin-Levy G, Greig C, Young A, Lewis S, Hannan J, Mead G (2006) Longitudinal changes in muscle strength and mass after acute stroke. Cerebrovasc Dis 21:201–207
47. Kwakkel G, Wagenaar RC, Kollen BJ, Lankhorst GJ (1996) Predicting disability in stroke—a critical review of the literature. Age Ageing 25:479–489
48. Taub E (1994) Overcoming learned non-use: a new approach to treatment in physical medicine. In: Carloson JG, Seifert SR, Birbaumer N (eds) Clinical and applied psychophysiology. Plenum, New York, pp 185–220
49. Uematsu H, Umezaki N, Sasaki N (1990) Computed tomographic of masticatory muscles in the hemiplegic patients due to cerebro-vascular accidents [in Japanese]. Jpn J Gerodont 4:33–36 50. Hankey GJ, Jamrozik K, Broadhurst RJ, Forbes S, Anderson CS
(2002) Long-term disability after first-ever stroke and related prognostic factors in the Perth Community Stroke Study, 1989– 1990. Stroke 33:1034–1040
51. Donnan GA, Fisher M, Macleod M, Davis SM (2008) Stroke. Lancet 371:1612–1623
52. Ostwald SK, Godwin KM, Cheong H, Cron SG (2009) Predictors of resuming therapy within four weeks after discharge from inpa-tient rehabilitation. Top Stroke Rehabil 16:80–91
53. Hankey GJ, Spiesser J, Hakimi Z, Bego G, Carita P, Gabriel S (2007) Rate, degree, and predictors of recovery from disability following ischemic stroke. Neurology 68:1583–1587
54. Konaka K, Kondo J, Hirota N, Tamine K, Hori K, Ono T, Maeda Y, Sakoda S, Naritomi H (2010) Relationship between tongue pressure and dysphagia in stroke patients. Eur Neurol 64:101–107
55. Frankel MR, Morgenstern LB, Kwiatkowski T, Lu M, Tilley BC, Broderick JP, Libman R, Levine SR, Brott T (2000) Predicting prognosis after stroke: a placebo group analysis from the National Institute of Neurological Disorders and Stroke rt-PA Stroke Trial. Neurology 55:952–959
56. Weimar C, Konig IR, Kraywinkel K, Ziegler A, Diener HC (2004) Age and National Institutes of Health Stroke Scale Score within 6 hours after onset are accurate predictors of outcome after cerebral ischemia: development and external validation of prognostic mod-els. Stroke 35:158–162