HAL Id: cea-02544394
https://hal-cea.archives-ouvertes.fr/cea-02544394
Submitted on 30 Apr 2020
HAL is a multi-disciplinary open access
archive for the deposit and dissemination of
sci-entific research documents, whether they are
pub-lished or not. The documents may come from
teaching and research institutions in France or
abroad, or from public or private research centers.
L’archive ouverte pluridisciplinaire HAL, est
destinée au dépôt et à la diffusion de documents
scientifiques de niveau recherche, publiés ou non,
émanant des établissements d’enseignement et de
recherche français ou étrangers, des laboratoires
publics ou privés.
A multiresolution image reconstruction method in X-ray
microCT
Marius Costin, Delphine Lazaro-Ponthus, Samuel Legoupil, Valerie
Kaftandjian
To cite this version:
Marius Costin, Delphine Lazaro-Ponthus, Samuel Legoupil, Valerie Kaftandjian. A multiresolution
image reconstruction method in X-ray microCT. 2009 IEEE Nuclear Science Symposium and Medical
Imaging Conference (NSS/MIC 2009), Oct 2009, Orlando, United States. pp.3871-3876,
�10.1109/NSS-MIC.2009.5401919�. �cea-02544394�
A Multiresolution Image Reconstruction Method in X-ray MicroCT
M. Costin1, D. Lazaro-Ponthus1, S. Legoupil1 and V. Kaftandjian21
CEA, LIST, Center of Saclay, F-91191 Gif-sur-Yvette, France
2
CNDRI, INSA-Lyon, F-69621 Villeurbanne, France
I.
I
NTRODUCTIONThe growing use of microCT systems was driven by the increasing need for higher resolution images in many applications, going from small animal studies to material structure characterization. The high resolution combined with the sample size usually implies the transversal truncation, problem addressed by local tomography techniques [1,2,3]. However, these reconstruction methods are not always suitable for applications in material characterization, where it may be required to reconstruct the object at different levels of details; i.e. with a very high resolution in the region-of-interest (ROI) and with a coarser one outside the ROI. In the present study, we propose a new method designed for such studies, which combines a zoom-in CT acquisition with a multiresolution processing based on the wavelets theory. The performances of the method have been assessed by a comparison with the filtered back-projection (FBP) algorithm on numerical simulations.
II.
M
ATERIAL ANDM
ETHODSA. Description of the multiresolution reconstruction algorithm
By employing a zoom-in type setup, we acquire two sets of projections at two different positions denoted pos 1 and pos 2 on Figure 1. We consider a ROI which is reconstructed with a higher resolution than the rest of the object, limited by the field-of-view (FOV) at pos 2. In order to allow more general settings, the ROI can be freely chosen inside or at the border of the object, but its centre must lie on the beam axis, at both acquisition positions. At pos 1, the sample must be inside the FOV for every angular increment as in Figure 1, which depicts a configuration with a ROI off-centered with respect to the borders of the object. The volume is reconstructed as a stack of 2D horizontal slices, processed independently.
Figure 1. Top view of the zoom-in CT setup.
In this setup, the two magnification factors are computed as Dsd/Dso, with Dsd and Dso the detector and source-to-object distances, respectively. β is the rotation angle of the fan beam with respect to its initial point. A pixel is defined by sk = nk.α, with α being the pixel size in the detector and k integer in the interval [-p, p]. The angle γ of a ray in the fan-beam with respect to the beam axis is given by arctan(s/Dsd) and is comprised in the interval [-γp, γp].
Our algorithm named ASDIR, consists of four steps as described below.
1. Sinogram creation
.
The two sets of projections P1(β1,s1) and P2(β2,s2) are combined into a single set P(β,s). Assuming a detector of N1 = 2np1 + 1 pixels, a virtual detector of N2 = 2np2 + 1 pixels is created with p2 = zr.p1, zr being the ratio between the magnification factors at both positions pos 1 and pos 2. For a divergent beam, a zoomed projection taken at pos 2 cannot be extended by a direct copy of the exterior points taken at pos 1 because the incidence angle changes. However, with simple geometrical arguments we derived a formula to compute the correct points to be used for projection extension:( )
(
(
)
)
≤ < ≤ = = = α α β α β β β β 2 1 1 2 2 2 1 1 1 2 2 2 2 , , , , , , p p p s s n s n s P n s s P s P , withβ
β
γ
κ
κ
arcsin tan arcsin 1 2 2 1 ⋅ = − + = sd D s and(
)
2 1 2 sinγ κ= Dso Dso ×In the enlarged sinogram, all the points outside the ROI are computed with this formula and the correct pixels are identified in the first set of data by rounding the calculated values. The classical ramp filtering is applied on the enlarged sinogram.
2. Sinogram transform. Each extended projection is decomposed into approximation and detail coefficients by applying line
wise a 1D discrete wavelet transform (DWT) based on the Cohen-Daubechies-Feauveau 9/7 mother wavelet. We find that decomposing on zr-1 levels is a good compromise between the image quality and speedup in the reconstruction process.
3. Multiscale backprojection. In this step we obtain two subimages of N1 × N1 pixels corresponding to the two resolutions. The
coarse subimage is obtained by backprojecting the part of the transformed sinogram containing the approximation coefficients.. The points corresponding to the ROI in the filtered sinogram are backprojected into the fine resolution subimage.
4. Image recovery. The final image of N2 × N2 pixels is recovered in a two step process. By applying the 2D inverse DWT with
the detail coefficients set to zero, we recover the coarse resolution image. In the second step, the fine resolution subimage is copied in its corresponding place.
B. Simulated phantom
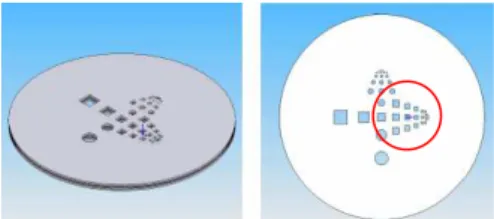
For the numerical study we created a disk phantom with a diameter of 15 mm, containing cylindrical and rectangular holes with decreasing diameters of 1.0, 0.8, 0.6, 0.5, 0.4, 0.3, 0.2, 0.1, 0.05 and 0.025 mm, as shown in Figure 2. For the holes smaller than 0.6 mm, transversal pairs of identical holes were added. A ROI with a diameter of 5.55 mm and centered on the 0.4 mm square hole was chosen for reconstruction. Two sets of 300 and 1200 projections over 360° were simulated with the X-ray simulation software VXI 1.0 [4] for pos 1 and 2 respectively. Each projection contained 1120×56 squared pixels of 100 µ m. Dso1, Dso2 and Dsd were set to 72 mm, 18 mm and respectively 360 mm.
Figure 2. Description of the simulated phantom;
the considered ROI is indicated by the red circle.
S1 S2 Detector Pos 2 ROI X-ray source Pos 1 γ2 γ1 Dso2 D so1 D sd
C. Image reconstruction and performance assessment
The simulated data sets were reconstructed into images of 4480×4480 pixels with a nominal pixel size of 5 µm. A complete set of 1200 projections at pos 2 for a 4480 pixels detector was generated in order to serve as reference. This data set was reconstructed using the classical FBP algorithm. All reconstructions were performed on a PC with an AMD Opteron processor running at 2.8 GHz. The performances of our method were assessed by comparing the reconstructed slices and associated profile plots. The mean squared error (MSE) was computed for the whole reconstructed image and separately for the ROI. The reconstruction speed was compared by taking the fastest times from several runs.
III.
R
ESULTS ANDD
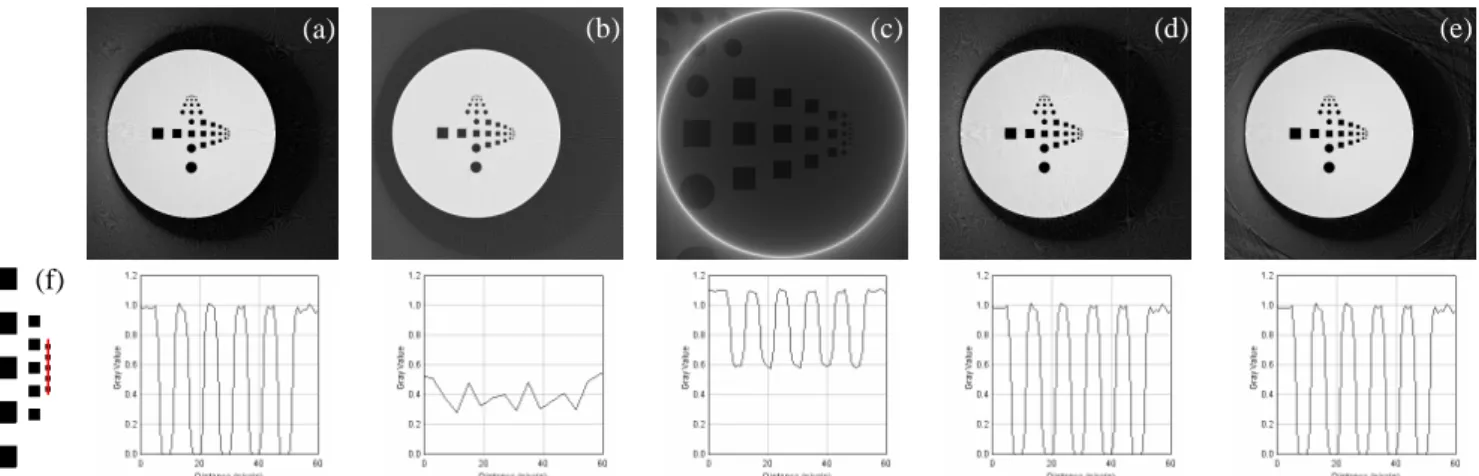
ISCUSSIONIn Figure 3 we present the central slices of the images reconstructed from the simulated data sets. The reference image obtained with a detector of 4480 pixels and 1200 projections is presented on column (a). The second column displays the image reconstructed at position 1, scaled by interpolation to 44802 pixels. The third column shows the image reconstructed from the truncated data acquired at position 2, and it is displayed with a different magnification for a better visualization. Column (d) displays the reconstruction with FBP of the enlarged sinogram obtained after the step 1 of our algorithm. Rightmost in column (e) it is displayed the multiresolution image obtained with our algorithm. The profile plots through the smallest squared holes, taken along the red line depicted in (f) are displayed on the second row.
Figure 3. Reconstructed slices: a) FBP 44802 pixels, b) FBP 11202 pixels scaled, c) FBP from truncated data at position 2, d) FBP on enlarged sinogram from step 1, e) ASDIR; f) zoomed region with the squared holes, the red line indicates the support for the profile plots displayed on the second row.
The reconstruction from non-truncated data in figure 3b) has insufficient resolution for the chosen detail size. In figure 3c), the result of FBP applied to truncated data shows the typical distortion, the cupping-like artifact and the shift of the gray values. The close agreement obtained between the profiles reconstructed using our method (figure 3e) and FBP (figure 3a), as well as the very small MSE values computed both in the whole image and the ROI demonstrates that the approximations introduced in our method induce very small deviations with respect to the conventional FBP algorithm. When comparing our method to FBP, MSE values of 4.84×10⁻³ and 2.3×10⁻⁶ were obtained for the whole image and for the ROI, respectively. The time needed for reconstruction was 1823 seconds for FBP, and only 249 seconds with our method, which represents a speedup factor of 7.32, in agreement with the expected value of 2zr-1. This gain is obtained due to the fact that we back-project only a fraction of the points needed by the FBP algorithm. While the points within the ROI are reconstructed with the same error as for the FBP, the MSE value for the entire image is lower with our method because of the denoising properties of the DWT.
It should be noted that our method can be easily adapted for the short-scan configuration, thus reducing further the number of samples required for accurate reconstructions.
IV.
C
ONCLUSIONWe presented an efficient algorithm for X-ray image reconstruction in microCT. Our method contains two novelties, the enlargement of the zoomed sinogram by an analytical formula and the multiresolution image recovery. The main advantage of our algorithm over the traditional FBP one lies in the fact that we need less sampling points for a comparable image quality. By using the multiresolution processing, we reduce both the acquisition time and the reconstruction time with important factors. Another advantage is the lower file storage requirements when only the subimages are saved.
V.
A
CKNOWLEDGMENTSWe thank the VXI group for providing the X-ray simulation software VXI 1.0. This work was partially supported by the European project SAPHIR (http://www.saphir-project.eu).
VI.
R
EFERENCES[1] A. Faridani, E. Ritman, and K. Smith. Local tomography. SIAM Journal on Applied Mathematics, 52(2):459-484, 1992. [2] F. Noo, R. Clackdoyle, and J. Pack, “A two-step Hilbert transform method for 2D image reconstruction,” Phys. Med. Biol., vol. 49, pp. 3903–3923, 2004.
[3] Y. Ye, H. Yu, Y. Wei, and G. Wang, “A general local reconstruction approach based on a truncated Hilbert transform,” International Journal of Biomedical Imaging, vol. 2007, pp. 1–8, 2007.
[4] I.N.S.A. Lyon, “Virtual X-ray Imaging software,” Laboratoire de Contrôle Non-Destructif par Rayonnements Ionisants. (f)
(a) (b) (c) (d) (e)