HAL Id: hal-00299476
https://hal.archives-ouvertes.fr/hal-00299476
Submitted on 4 Dec 2007
HAL is a multi-disciplinary open access
archive for the deposit and dissemination of
sci-entific research documents, whether they are
pub-lished or not. The documents may come from
teaching and research institutions in France or
abroad, or from public or private research centers.
L’archive ouverte pluridisciplinaire HAL, est
destinée au dépôt et à la diffusion de documents
scientifiques de niveau recherche, publiés ou non,
émanant des établissements d’enseignement et de
recherche français ou étrangers, des laboratoires
publics ou privés.
Detection of metallic and plastic landmines using the
GPR and 2-D resistivity techniques
M. Metwaly
To cite this version:
M. Metwaly. Detection of metallic and plastic landmines using the GPR and 2-D resistivity techniques.
Natural Hazards and Earth System Science, Copernicus Publications on behalf of the European
Geo-sciences Union, 2007, 7 (6), pp.755-763. �hal-00299476�
www.nat-hazards-earth-syst-sci.net/7/755/2007/ © Author(s) 2007. This work is licensed under a Creative Commons License.
and Earth
System Sciences
Detection of metallic and plastic landmines using the GPR and 2-D
resistivity techniques
M. Metwaly
National Research Institute of Astronomy and Geophysics, Cairo, Egypt currently at: Graduate School of Engineering, the University of Tokyo, Japan
Received: 5 July 2007 – Revised: 20 September 2007 – Accepted: 13 October 2007 – Published: 4 December 2007
Abstract. Low and non-metallic landmines are one of the
most difficult subsurface targets to be detected using several geophysical techniques. Ground penetrating radar (GPR) performance at different field sites shows great success in detecting metallic landmines. However significant limita-tions are taking place in the case of low and non-metallic landmines. Electrical resistivity imaging (ERI) technique is tested to be an alternative or confirmation technique for detecting the metallic and non-metallic landmines in suspi-cious cleared areas. The electrical resistivity responses using forward modeling for metallic and non-metallic landmines buried in dry and wet environments utilizing the common electrode configurations have been achieved. Roughly all the utilized electrode arrays can establish the buried metallic and plastic mines correctly in dry and wet soil. The accuracy differs from one array to the other based on the relative re-sistivity contrast to the host soil and the subsurface distribu-tion of current and potential lines as well as the amplitude of the noises in the data. The ERI technique proved to be fast and effective tool for detecting the non-metallic mines especially in the conductive environment whereas the per-formances of the other metal detector (MD) and GPR tech-niques show great limitation.
1 Introduction
Landmines are type of weapons which are placed onto or into the ground and explode when triggered by a vehicle or a person. Currently more than 70 countries have been con-taminated by around 80 to 110 Millions of different land-mines and Unexploded Ordinances (UXO), (S1). The efforts to establish mono (single) or dual (combined) techniques for landmine detections are growing since the World War II.
Dif-Correspondence to: M. Metwaly
(mmetwaly70@yahoo.com)
ferent varieties of landmines can be found depending on the casing materials (metallic or plastic), the landmine size and the purpose of using (antipersonnel or antitank) (Daniels, 2004; Van Dam et al., 2005). In practice landmine fields are generally designed to be very complex. The military en-gineers are eagerly integrating natural difficulties beside dif-ferent mine types and shapes that make the detections are not easily process. Such varieties in landmine shapes, materials as well as the nature of the hosting environments make no single detection technique can be operating effectively in all environments and for all landmine types. The combination and integration between different techniques increases the rate of detection and consequently decrease the false alarm rates. Egypt is one of the most contaminated landmine coun-tries. The problem of landmines in Egypt stared up since the World Ware II in the northern part of western desert. The military operations carried out by the Allied Forces and the Axis Power from 1941–1943 left varieties of about 22 Mil-lion landmines and UXO in western desert nearly along the coast of Mediterranean sea. Not only thousands of civilians killed and injured each year, but also the social, economics and environmental impacts of those mines are disgraceful (NCHR, 2005).
The current conventional deminer tools include in princi-ple metal detector (MD), mechanical prods (like steel prod or screw diver) and sometimes well trained doges (MacDonald et al., 2003). However, the MD technique does not entirely detect low and non-metallic landmines moreover the limi-tation is significant in the highly ferruginous soil environ-ment (Lopera and Milisavljevic, 2007). Recently, there are a number of noninvasive geophysical techniques have been in-cluded in the landmine detections. Among these techniques is the ground penetrating radar (GPR) which is potentially promising in locating metallic, low and non-metallic mines at different host soil (MacDonald et al., 2003). The success of GPR performance is remarkably whereas there is a consid-erable contrast in dielectric properties between the landmine
756 M. Metwaly: Detection of metallic and plastic landmines
Figure (1): (a) Metallic landmine object, (b) Real m
Fig. 1. (a) Metallic landmine object, (b) Real metallic antitank mine
T-80, (c) Different plastic landmine objects, (d) Real plastic antiper-sonnel mine Ts-50, (e) Low metallic landmine object showing the iron grind content, and (f) Overview of the test site.
and the host soil (Chen et al., 2001; Daniels, 2004). How-ever, this performance is getting to be poor in conductive soil (Miller et al., 2004; Van Dam et al., 2005) and when there are some shallow subsurface inhomogeneities and clut-ters. Another promising technique is the electrical resistivity imaging (ERI) which can be effectively in locating metallic and non-metallic landmines in conductive soils like wet en-vironments, beach and marshes areas (Chruch et al., 2006). Nevertheless, like the other geophysical methods, there are some limitations to apply this technique alone in demining activities especially when there is either excessive dryness at the surface or there are electrical noises close to the surveyed site.
Therefore, the motivations of this paper include; study-ing the ability of GPR technique to get significant signa-tures from different metallic, low metallic and non-metallic (plastic) landmine-like objects buried at different depths in sand soil similar to that are dominant at the western desert of Egypt. The limitation of the GPR techniques in locating the non-metallic mines will be primarily prevailed using the 2-D modeling of the ERI technique utilizing most of the common electrode arrays.
2 The field model
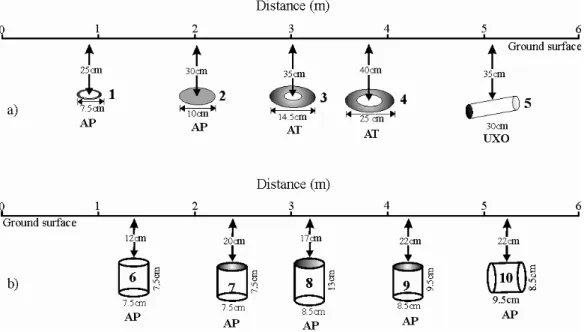
In order to simulate the actual field conditions and the land-mine types in the northern part of the Egyptian Western Desert, a small test site with the dimensions of 2.5×6.0 m has been constructed. The host materials have been replaced (up to 1.0 m depth) by homogenous sand (Fig. 1a). Sets of metallic, low metallic and non-metallic (plastic) landmines-like objects have been buried at different depths along two profiles, (Figs. 1 and 2). The large metallic objects are similar to the metallic antitank mine (T-80) while most of plastic ob-jects are comparable to antipersonnel mine (Ts-50), (Fig. 1c and e). The shapes, buried depths, dimensions and type of each object are shown in Fig. 2.
3 GPR field test
The GPR data have been acquired using SIR 20 system (from GSSI) operating with 400, 900 and 1500 MHz an-tennae towed with constant speed along the surface of the test site (Fig. 1a). The system was calibrated to acquire 32 scans/sec whereas the sampling rate was 512 samples/scan. The acquired GPR profiles using three different frequencies (400, 900 and 1500 MHz) along the center of buried metal-lic and plastic landmine-like objects are shown in Figs. 3 and 4. The commercial REFLEX software has been used for processing and displaying the GPR data. Background removals followed by band pass filter have been applied to emphasis the buried bodies reflections and suppress the other noise signals. GPR technique has a great success in detect-ing the metallic landmines because they are typically conduc-tors and have dielectric constant relatively high (Miller et al., 2004). On the GPR profile, metallic landmines cause perfect reflected signals whatever the soil conditions are (Metwaly, 2007). Strong reflected signals from the top of all metallic bodies can be observed in the form of different hyperbolae with some specific details about the shapes of each body in-dividually (marked with 1 to 5, Fig. 3). The strong reflected signals below 11 ns (marked with litter C) are due to the metallic sheet in the vicinity of the test site while the base of the test site (marked with litter G) is detected around 10 ns (Fig. 3). As the antenna frequency increase the resolution of the reflected signal increase and consequently some signif-icant details about each metallic body character can be ob-served, (Fig. 3c). Bodies’ numbers (1 and 2) have simple and smooth reflected hyperbolae and their dimensions are com-parable with the buried body’s diameters. Bodies’ numbers (4 and 5) are shown with relatively complicated shapes due to the interference of the reflected signals from the body’s sides. Moreover, the reflected signals of the bar body (No. 5) are wide and flat on the top.
Low and non-metallic landmines are one of the subsur-face targets that can not be easily detected using either con-ventional metal detectors or even GPR techniques (Van Dam
Figure (2): Shapes, geometries and buried depths for landmine-like objects. (a) Metallic
Fig. 2. Shapes, geometries and buried depths for landmine-like objects. (a) Metallic objects, (b) low metallic content and plastic objects, AP
= antipersonnel mine, AT = antitank mine, UXO = Unexploded ordinance.
Figure (3): Typical processed GPR profiles for different metallic landmine-like objects.
Fig. 3. Typical processed GPR profiles for different metallic landmine-like objects. Numbers referred to the metallic objects in Fig. 2a, C: is reflected signals from metal plate close to the test site, G: is reflected signals from test site base. (a) using 400 MHz, (b) using 900 MHz, (c) using 1500 MHz.
et al., 2005). This refers to the fact that the reflected GPR signals from the plastic mine are quite weak due to its non significant dielectric constant contrast with the surrounding medium (Miller et al., 2004). The GPR profiles for the ac-quired data along the buried low and non-metallic
landmine-Figure (4): Typical processed GPR profiles for different plastic and low me
Fig. 4. Typical processed GPR profiles for different plastic and low
metallic content landmine-like objects. Numbers referred to the ob-jects in Fig. 2b, C and G: as in Fig. 5, (a) using 400 MHz, (b) using 900 MHz, (c) using 1500 MHz.
like objects using three different frequencies (400, 900 and 1500 MHz) are presented in Fig. 4. The recorded signals using 400 MHz frequency show only three distinctive hy-perbolae (No. 7, 8 and 9) comparable with the three low metallic objects, (Fig. 4a). The other received signals from the completely plastic objects (No. 6 and 10) are hardly to
758 M. Metwaly: Detection of metallic and plastic landmines
Figure (5): Common arrays used in electrical resistivty imaging, black dotes represent the
Fig. 5. Common arrays used in electrical resistivty imaging, black dotes represent the electrode locations, C1 and C2 are the current
electrodes, P1 and P2 are the potential electrodes, a is the electrode spacing; n is the dipole spacing factor.
be recognized. Increasing the applied frequency slightly enhances the reflected signals particularly from the non-metallic objects (No. 6 and 10), (Fig. 4b and c). However, the attenuation of radar wave propagation increases with increas-ing the utilized radar frequency. The reflected signals from body number (6) are rather attenuated and concealed under the other background signals that are relatively enhanced.
4 Electrical Resistivity Modeling
Generally electrical resistivity technique is one of the widely used geophysical tools for fast subsurface evaluation. The ease of using the technique makes it effectively applies for different engineering, hydrology, and environmental inves-tigations (Ogilvy et al., 1999; Slater et al., 2000; Marescot et al., 2004). The applications of the electrical resistivity technique in the field of landmine detection are very lim-ited. This is due to the though that laying out the electrodes might be detonate the mines. However the recent technical improvements in the technique using the advanced contin-uous profiling (dynamic system) make the system applica-ble for landmine detections as at least confirmation tool for the suspicious cleaned regions (El-Qady and Ushijima, 2005; Chruch et al., 2006). The coupling in the dynamic system can be achieved through capacitive electrodes coupled car-pet pulling on the ground surface without any needs to insert the electrodes into the ground (Gerard and Tabbagh, 1991; Shima et al., 1996; Panissod et al., 1998). Landmine de-tection using electrical resistivity imaging technique is based on detections the perturbations in subsurface conductivities caused by buried landmines at shallow depths. Consequently especial attentions will be suited for non-metallic mines de-tection in dry and wet environments while other GPR and MD techniques might be confounded. The 2-D resistivity
modeling and the subsequent inversion is performed using the commercial RES2DMOD/INV software.
4.1 Landmine and host soil modeling
The forward calculations are used for determining the appar-ent resistivity pesudosections applying seven differappar-ent elec-trode configurations (Fig. 5), running over the center of pro-posed buried landmine targets. The host sand resistivity set to be 1000 and 10 Ohm m for dry and wet host sand. The landmine resistivities were set to be 0.2 and 100 Ohm m to represent metallic antitank and non-metallic antipersonnel landmines respectively placed horizontally at depths 0.1 and 0.2 cm (Fig. 6a and i). The electrode spacing (a) is ranging from 0.05 to 1.5 m for all electrode configurations and (n) is set to one (Fig. 5). The profile length is 4.5 m which requires to maximum 90 electrodes to cover the proposed profile. The two dimensional model involves a finite element calculation mesh which divides the subsurface into a number of rectan-gular blocks, (Dey and Morrison, 1979b). Then the inverse calculations have been carried out using least square sense using Marquardt’s algorithm (Loke and Barker, 1996a) to at-tain the physical models that are consistent with the forward calculations. The better forward calculating model is the bet-ter fitting can be achieved during the inversion process (Nyari and Kanli, 2007). The pseudosection gives approximate pic-ture of the subsurface resistivity distributions because it de-pends principally on the type of the electrode arrays rather than on the subsurface resistivity. For that the inverted resis-tivity sections will be considered only in the following dis-cussions.
Figure 6 shows the inverted models for plastic and metal-lic mine-like objects buried in dry and wet sand respec-tively. Like GPR and MD techniques, the ERI can detect the metallic mine buried either in dry or wet environments.
Figure (6): Inverted ERI models using robust inversion for plastic and metallic objects
760 M. Metwaly: Detection of metallic and plastic landmines 0 5 10 15 20 25 30 35 1 2 3 4 5 6 7 8
Iterantion num bers
R M S ( % ) Wenner alpha "Wenner betta "Wenner gamma Pole pole Equatorial dipole Dipole dipole Pole dipole 0 1 2 3 4 5 6 7 8 9 1 2 3 4 5 6 7 8
Iteration num bers
R M S ( % ) Wenner alpha "Wenner betta "Wenner betta Pole pole Equatorial dipole Dipole dipole Pole dipole 0 5 10 15 20 25 30 35 40 45 1 2 3 4 5 6 7 8
Iteration num bers
R M S ( % ) "Wenner alpha "Wenner betta "Wenner gamma Pole pole Equatorial dipole Dipole dipole Pole dipole 6 7 8 9 10 11 12 13 14 1 2 3 4 5 6
Iteration num bers
R M S ( % ) Wenner alpha "Wenner betta "Wenner gamma Pole pole Equatorial dipole Dipole dipole Pole dipole
Figure (7): The RMS errors versus the num
(a)
(b)
(c)
(d)
Fig. 7. The RMS errors versus the number of iterations for utilized
electrode arrays, (a) dry soil, (b) wet soil, (c) dry soil with 10% noise, (d) wet soil with 10% noise.
However the plastic mine shows significant electrical resis-tivity anomalies with different accuracy differs from one ar-ray to the other based on the subsurface distributions of the current and potential lines.
In dry condition the electrical resistivity contrast between the plastic mine and host soil is 1:10, while this contrast is 1:5000 for the metallic one. The metallic mine shows some evidences of distorted anomaly using the seven elec-trode configurations. The lower boundary of the mine can not be detected effectively (Fig. 6b–h). This is not a big landmine detection problem as the metallic mine buried in dry soil is the favorite target for the other metal detector and GPR tech-niques. The interesting point is the detection of plastic mine in dry environment. All the seven electrode configurations are effectively detecting this small (15cm x 20cm) plastic mine in the dry conditions (Fig. 6b–h). Dipole dipole config-uration shows the highest resistivity resolution and relatively undistorted signals (Fig. 6g), although it has a relatively high RMS error (Fig. 7a).
In the wet soil, the resistivity contrast between the host soil and the plastic and metallic mines decreased to be 10:1 and 1:50 respectively. This consequently decreases the RMS errors by factor of about 1/3 for all electrode configurations relative to the dry soil condition, (Fig. 7b). Figure 6j–p shows the results of inverted data sets using different iteration num-bers which reach to 8 to achieve reasonable RMS values and consistent resistivity images with the original models. The wet and conductive environments like beaches, rice paddy fields, marshes and swamps, which are considered harsh en-vironments for conducting the GPR and MD techniques are the best conditions for performing ERI. Such conductive en-vironments ensure a good electrical coupling with the ground and consequently provide efficient resistivity data. The reso-lution of the inverted resistivity images for the metallic mine in wet environment are better than that are in the dry environ-ment. Almost all electrode arrays except the Wenner alpha successfully detect the mine body (Fig. 6j–p). However, the bottom of the mine is not defined well. Likely, the plastic mine in the wet soil can be detected using almost the utilized electrode arrays (Fig. 6j–p). However, Wenner alpha is the relatively poor performing configuration while Dipole dipole array is the robust one (Fig. 6o).
4.2 Noise effects
Adding of Gaussian random noise (Press et al., 1992) with 10% amplitude to the apparent resistivity data makes it sim-ilar to that is acquired at many different areas. The inverted data (Fig. 8) is relatively distorted in comparisons with the noise free data sets (Fig. 6). This is evident with inspec-tion the shifted up RMS values relative to the dry and wet soils (Fig. 7c and d). The inverted resistivity images for metallic mine in dry soil are slightly distorted and the com-plete configure of the body can’t be detected using any of the utilized electrode arrays (Fig. 8b–h). Although,
Figure (8): Inverted ERI models with 10% amplitude of random noise using robust
Fig. 8. Inverted ERI models with 10% amplitude of random noise using robust inversion for plastic and metallic objects buried in dry (left)
762 M. Metwaly: Detection of metallic and plastic landmines
ing the metallic body in wet environment shows subtle en-hancements (Fig. 8j–p). The detection of the plastic mine either in dry or wet noisy soil using the resistivity imaging technique is efficient. Almost all the electrode arrays except pole-pole and equatorial dipole efficiently detected the plas-tic mine in dry soil (Fig. 8b–h). The Wenner gamma, Dipole dipole and Pole dipole arrays are shown the robust inversion results for resolving the plastic mine in wet soil (Fig. 8l, o, and p). The other electrode arrays show the location of the plastic mine with different inversion smearing and artifacts due to the noise effects in the resistivity data.
5 Conclusions
A physical model has been built using metallic, low and non-metallic landmine-like objects buried in sandy environment to simulate the actual landmines field at the Western desert of Egypt. The performance of GPR technique has been tested and showed that the technique is an effective tool for detect-ing the various metallic landmines. The metallic landmines are much easier to be detected using GPR as they cause ro-bust reflected signals. This refers to the high conductivity of the metallic mines and the relatively high dielectric contrast with the host soil. The success of GPR technique in detect-ing the low and non-metallic landmines is controlled with the presence of significant contrast with the surrounding soil. As one assessment to cover the partial failing of GPR technique in detecting the low and non-metallic landmines buried in the conductive environment, simple forward modeling of elec-trical resistivity imaging using different electrode configura-tions and the physical properties of both host soil and various landmine types have been achieved. The metallic mines in dry and wet environments show significant distorted resistiv-ity anomalies and the lower boundary can not be detected ef-fectively. However such targets in these environments are the preferable intend of the other metal detector and GPR tech-niques. Detections of plastic mines in dry and wet conditions show robust resistivity images using all utilized electrode ar-rays. The wet environment, which is considered one of prob-lematic conditions for most of the detecting techniques, is the best environment for performing the ERI technique.
Adding 10% Gaussian random noise to modeled resistivity data makes the inverted images are relatively distorted. The resistivity images for metallic mine in dry soil are slightly indistinct and the complete body configuration can not be detected using any of the electrode arrays. However, sub-tle enhancements can be noticed for detecting this metallic body in the wet environment. Landmine detection in wet and noisy environment is considered type of challenging for most of landmine detecting techniques. The resistivity imaging technique shows a competent inversion results for detecting the plastic mine either in wet or dry environments. The res-olutions of the inverted images are differ from one array to
another based on the electrode configuration and the amount of noise in the data.
Acknowledgement. The author would like to thank A. Abbas and
G. El-Qady for their help in conducting the GPR field measure-ments. This work was supported by postdoctoral fellowship of Japanese Society of the Promotion of Science (JSPS).
Edited by: M. Keiler, S. Fuchs, and T. Glade Reviewed by: Z. Nyari and A. Kanli
References
Chen, C., Rao, K., and Lee, R.: A tapered-permittivity rod antenna for ground penetrating radar applications, J. Appl. Geophys., 47, 309–316, 2001.
Church, P., McFee, J. E., Gagnon, S., and Wort, P.: Electrical Impedance Tomographic imaging of buried landmines, IEEE T. Geosci. Remote, 44, 2407–2419, 2006.
Daniels, D.: GPR for landmine detection, an invited review paper, 10th International Conference on Ground Penetrating Radar, 21– 24 June, Delft, The Netherlands, PIP.2, 2004.
Davis, J. L. and Annan, A. P.: Ground-Penetrating radar for high-resolution mapping of soil and rock stratigraphy, Geophys. Prospect., 37, 531–551, 1989.
Dey, A. and Morrison, H. F.: Resistivity modeling for arbitrary shaped two dimensional structures, Geophys. Prospect., 27, 1020–1036, 1979b.
El-Qady, G. and Ushijima, K.: Detection of UXO and landmines using 2-D modeling of geoelectrical resistivity data, Proceedings of SAGEEP Meeting, 1176–1182, 2005.
Gerard, R. and Tabbagh, A.: A mobile four electrodes array and its application to electrical survey of planetary grounds at shallow depths, J. Geophys. Res., 96(B3), 4117–4123, 1991.
Lopera, O. and Milisavljevic, N.: Prediction of the effects of soil and target properties on the antipersonnel landmine detection performance of ground-penetrating radar: A Colombian case study, J. Appl. Geophys., 63, 13–23, 2007.
Loke, M. H. and Barker, R. D.: Rapid least squares inversion of ap-parent resistivity psedusections by a qusi-Newton method, Geo-phys. Prospect., 44, 131–152, 1996a.
MacDonald, J., Loockwood, J., Altshuler, T., Broach, T., Carin, L., Harmon, R., Rappaport, C., Scott, W., and Weaver, R.: Alterna-tives for landmine detection, RAND, USA, 336 pp., 2003. Marescot, L., Palma Lopes, S., Rigobert, S., Piau, J. M., Humbert,
P., Lagabrielle, R., and Chapellier, D.: Forward and inversion re-sistivity modeling on complex three dimensional structures using the finite element methods, Proceedings of SAGEEP Meeting, 589–595, 2004.
Metwaly, M. A.: Metallic and plastic landmine-like objects assess-ment using GPR technique, Proceedings of SAGEEP Meeting, 850–860, 2007.
Miller, T., Hendrickx, J., and Borchers, B.: Radar detection of buried landmines in field soils, Vadose Zone J., 3, 1116–1127, 2004.
National Council of Human Rights (NCHR): Egypt and the prob-lem of landmines, Background paper, The international confer-ence for development and landmine clearance in the North West Coast, Cairo 27–29 December, Abstr. No. 12, 2005.
Nyari, S. and Kanli, A. I.: Imaging of buried 3D objects by using electrical profiling methods with GPR and 3D geoelectrical mea-surements, J. Geophys. Eng., 4, 83–93, 2007.
Ogilvy, R., Meldrum, P., and Chambers, J.: Imaging of industrial waste deposits and buried quarry geometry by 3-D resistivity to-mography: European J. Environ. Eng. Geoph., 3, 103–113, 1999. Panissod, C., Dabas, M., Hesse, A., Jolivet, A., Tabbagh, J., and Tabbagh, A.: Recent developments in shallow depth electrical and electrostatic prospecting using mobile arrays, Geophysics, 65, 1542–1550, 1998.
Press, W. H., Teukolsky, S. A., Vetterling, W. T., and Falnnery, B.: Numerical Recipes in C (2nd edition) Cambridge University Press, 1020 pp., 1992.
S1, Global Mine Crisis, www.landmines.org, Tech. Report 2005. Shima, H., Sakashita, S., and Kobayashi, T.: Developments of
non-contact data acquisition techniques in electrical and electromag-netic explorations, J. Appl. Geophys., 35, 167–173, 1996. Slater, L., Binley, A. M., Daily, W., and Johnson, R.: Cross-hole
electrical imaging of a controlled saline tracer injection, J. Appl. Geophys., 44, 85–102, 2000.
Van Dam, R. L., Borchers, B., and Hendrickx, J. M. H.: Strength of landmine signatures under different soil conditions: implications for sensor fusion, Int. J. Syst. Sci., 36, 573–588, 2005.