HAL Id: hal-02882190
https://hal.archives-ouvertes.fr/hal-02882190
Submitted on 1 Apr 2021
HAL is a multi-disciplinary open access
archive for the deposit and dissemination of
sci-entific research documents, whether they are
pub-lished or not. The documents may come from
teaching and research institutions in France or
abroad, or from public or private research centers.
L’archive ouverte pluridisciplinaire HAL, est
destinée au dépôt et à la diffusion de documents
scientifiques de niveau recherche, publiés ou non,
émanant des établissements d’enseignement et de
recherche français ou étrangers, des laboratoires
publics ou privés.
Distributed under a Creative Commons Attribution| 4.0 International License
and Educational Intervention in Thermal Resort on
Anthropometric and Biological Parameters, and the
Disease-Free Survival after Breast Cancer Treatment
Completion (PACThe)
Marie-Paule Vasson, Fabrice Kwiatkowski, Adrien Rossary, Sylvie Jouvency,
Marie-Ange Mouret-Reynier, Martine Duclos, Isabelle van Praagh-Doreau,
Armelle Travade, Yves-Jean Bignon
To cite this version:
Marie-Paule Vasson, Fabrice Kwiatkowski, Adrien Rossary, Sylvie Jouvency, Marie-Ange
Mouret-Reynier, et al.. Effectiveness of a Global Multidisciplinary Supportive and Educational Intervention
in Thermal Resort on Anthropometric and Biological Parameters, and the Disease-Free Survival after
Breast Cancer Treatment Completion (PACThe). Journal of Oncology, Hindawi Publishing
Corpora-tion, 2020, 2020, pp.4181850. �10.1155/2020/4181850�. �hal-02882190�
Clinical Study
Effectiveness of a Global Multidisciplinary Supportive and
Educational Intervention in Thermal Resort on Anthropometric
and Biological Parameters, and the Disease-Free Survival after
Breast Cancer Treatment Completion (PACThe)
Marie-Paule Vasson ,
1,2Fabrice Kwiatkowski,
3,4Adrien Rossary,
2Sylvie Jouvency,
1Marie-Ange Mouret-Reynier,
5Martine Duclos,
6Isabelle Van Praagh-Doreau,
5Armelle Travade,
7and Yves-Jean Bignon
31Jean Perrin Comprehensive Cancer Centre, Department of Nutrition, 58 Rue Montalembert, 63011 Clermont-Ferrand, France 2University of Clermont Auvergne, INRA, UMR 1019 Human Nutrition Unit, CRNH-Auvergne, 28 Place Henri Dunant,
63000 Clermont-Ferrand, France
3Jean Perrin Comprehensive Cancer Centre, Department of Oncogenetics, 58 Rue Montalembert,
63011 Clermont-Ferrand, France
4University of Clermont-Auvergne, Laboratory of Mathematics, Probabilities and Applied Statistics, 28 Place Henri Dunant,
63000 Clermont-Ferrand, France
5Jean Perrin Comprehensive Cancer Centre, Department of Oncology, 58 Rue Montalembert, 63011 Clermont-Ferrand, France 6Gabriel Montpied University Hospital, Department of Sport Medicine and Functional Explorations, 58 Rue Montalembert,
63000 Clermont-Ferrand, France
7Centre R´epublique, Department of Senology, 99 Avenue de La Republique, 63100 Clermont Ferrand, France
Correspondence should be addressed to Marie-Paule Vasson; m-paule.vasson@uca.fr
Received 18 June 2019; Revised 6 November 2019; Accepted 7 February 2020; Published 5 May 2020 Guest Editor: Cigdem Selli
Copyright © 2020 Marie-Paule Vasson et al. This is an open access article distributed under the Creative Commons Attribution License, which permits unrestricted use, distribution, and reproduction in any medium, provided the original work is properly cited. A growing knowledge highlights the strong benefit of regular physical activity in the management of breast cancer patients, but few studies have considered biological parameters in their outcomes. In the prospective randomised trial after breast cancer treatment completion “PACThe,” we determined the effects of physical activity and nutritional intervention on the biological and anthropometric status of patients after one year of follow-up, and clarified the link between biomarkers at allocation and disease-free survival. 113 patients from the population of the “PACThe” study (n � 251) were analysed for biological parameters. Patients were randomized after chemotherapy in two arms: the intervention “SPA” receiving a 2-week session of physical training, dietary education, and physiotherapy (n � 57), and the control “CTR” (n � 56). Diet questionnaire, anthropometric measures, and blood parameters were determined at allocation and one year later. Survival and recurrence were checked over 7 years. Data were considered as a function of BMI, i.e., ≤25 for normal, 25–30 for overweight, and >30 for obese patients. At allocation, the large standard deviation for nutrient-intake values reflected an unbalanced diet for some patients in the three groups. At one-year follow-up, we noticed an increase in glucose (p < 10−6), insulin (p < 10−7), and adiponectin (p < 0.022) plasma levels for both intervention arms, which were more accentuated for the >30 groups. Using the Cox model, we demonstrated that the highest testosterone plasma values were linked to an increase of the recurrence risk (HR [CI–95%] � 5.06 [1.66–15.41]; p � 0.004). One-year after a global multidisciplinary supportive and educational intervention, we found few anthropometric and biological changes, mainly related to the patient’s initial BMI. We highlighted the importance of plasma testosterone in the evaluation of patient’s recurrence risk. Future studies would help better understand the mechanisms by which such multidisciplinary in-terventions could interact with breast cancer recurrence and define the most effective modalities.
Volume 2020, Article ID 4181850, 13 pages https://doi.org/10.1155/2020/4181850
1. Introduction
Over many years, growing knowledge has indicated the strong benefit of regular physical activity in the management of breast cancer patients [1]. Despite an extensive literature of clinical trials, data from these studies showed positive but modest effects, which may be underestimated due to great variability in the intervention strategies and intensity of monitoring [2, 3]. These interventions produce short-term changes in physical activity and patient behaviour, but data are scarce on recurrence and long-term follow-up. Some studies have highlighted long-term barriers to exercise after diagnosis of breast cancer, including psychological barriers (e.g., low motivation and dislike of gym), environmental barriers (e.g., employment priority and low access to fa-cilities), and lack of time [4]. Regarding the large variability of practice procedures, further research is required to in-vestigate how to sustain positive effects of exercise over time and to determine essential attributes of exercise (mode, intensity, frequency, duration, and timing) by cancer type and cancer treatment for optimal effects [5]. The intro-duction of wearable activity monitors into cancer care could improve the understanding of the association between physical activity and patient behaviour, as previously sug-gested [1].
Moreover, analyses are needed to provide insight into how physical activity interventions work. Such studies should accelerate the identification of effective behaviour changes and permit the development of evidence-based practice with better standardisation. Currently, the mech-anisms by which physical activity mediates its benefits re-main unclear [6]. Most hypotheses regarding the biological pathways have focused on the impact of obesity on breast cancer risk and recurrence. In that field, the main research axes are, first, the implication of sex hormones, including both oestrogens and androgens (testosterone) [7]; second, the implication of metabolic hormones, such as insulin/ insulin-like growth factor (IGF) axis and adipocytokines (leptin and adiponectin) [8]; and third, the implication of inflammatory factors (C reactive protein, CRP) [9]. None of these axes has clearly demonstrated efficiency in clinical trials, despite evidence of increased quality of life (QoL), reduced body weight in obese patients, and reduced recurrence.
The majority of studies that investigate the benefits of physical activity and nutritional interventions in breast cancer focus on weight loss, cardiorespiratory capacity, QoL, and overall well-being [5, 10, 11], but few of them considered the biological parameters of the patients in their outcomes [12, 13].
Taking into account these data and the interactions between physical activity and BMI, we performed a pro-spective randomized trial “Programme of Accompanying women after breast Cancer treatment completion in Ther-mal resorts” (PACThe) for complete-responder breast cancer patients after chemotherapy. In this trial, we dem-onstrated that the 2-week intervention durably influences the QoL of breast cancer patients after both short-term [14] and long-term treatment [15]. In the present study, we
determined the effects of PACThe intervention on the bi-ological and anthropometric status of patients after one-year follow-up and the link between the biomarkers and disease-free survival with seven years of follow-up after completion of breast cancer treatment.
2. Patients and Methods
2.1. Participants. Two hundred and fifty-one nonmetastatic breast cancer patients were enrolled between 2008 and 2010, as previously described [14]. The main inclusion criteria were notably invasive nonmetastatic breast carcinoma; less than 9 months after chemotherapy/radiotherapy
comple-tion, complete remission, 18.5 < BMI < 40 kg/m2,and
writ-ten informed consent. Half of the 251 patients (n � 113) were investigated for biological parameters in the present study. 2.2. Study Design. Patients were randomized into two groups: “SPA,” for the group attending the 2-week session in thermal centres, and “CTR,” for the control group. The 2-week session performed in thermal centres included con-sultations with physicians, nutritionists, and psycho-on-cologists; physical activity supervised by a physiotherapist for 2 h daily with endurance activities, strength training, and flexibility/stretching; SPA care consisting of bath, shower, and massage for half an hour per day; aesthetic care; and dietary meals with adapted menus, dietary education, and caloric intake limited to 1700–2000 kcal/day.
Besides standard oncological follow-up of the patients in the two groups, personal consultations with a dietician were organized to perform anthropometric measurements, pro-vide dietary advice, and give encouragement for daily physical activity. Evaluation of survival/recurrence was made by patients’ oncologist, with a follow-up period of 7 years [14]. The overall protocol design is available in a supplementary file.
2.3. Data Collection. Before randomization and at one year, the following analyses were performed on half of the pop-ulation (SPA: n � 57; CTR: n � 56):
(1) Diet questionnaire
Dietitians evaluated oral intake based on a 72-h self-reported diet questionnaire.
(2) Body composition
Body weight was measured at each personal con-sultation. Lean body mass (LBM), fat mass (FM), and total body water were evaluated by multifrequency bioelectrical impedance analysis (Bodystat Quadscan 4000) using 5, 50, 100, and 200 kHz. Tricipital skin-fold thickness was measured using a skin-skin-fold caliper (Harpenden caliper). To assess central fat distribu-tion, the waist circumference (WC) was evaluated to the nearest 0.5 cm using a standard tape measure placed between the lowest rib and the iliac crest, with the patient in the standing position. The hip cir-cumference (HC) was estimated using a standard
tape measure placed horizontally at the widest point on the hip.
(3) Blood sampling and biological assays
Blood samples were collected at allocation and at one year. Plasma levels of biomarkers were determined as follows: glucose and HDL-cholesterol (colorimetry methods), C-reactive protein, and transthyretin (immunonephelometry) were determined at the biomedical laboratory of the recruiting centre; in-sulin and testosterone (ELISA) were determined at the hospital biochemistry laboratory (Clermont-Ferrand); IGF-1, leptin, and adiponectin (luminex) were determined at the Genotool platform (Tou-louse); and CA 15-3 was determined at the anti-cancer centre radiobiology laboratory (Clermont-Ferrand).
(4) Recurrence follow-up
Disease-free interval was computed as months elapsed from date of randomization to documented breast cancer recurrence during seven years after breast cancer treatment completion. All recurrence types were considered, either local or distant (nodes, metastatis, and/or contralateral breast cancer).
2.4. Statistical Considerations. Protocol design consisted of a multicentre parallel randomized prospective trial. Data were analysed using the intention-to-treat principle. Descriptive statistics are presented with mean ± standard deviation (SD) for Gaussian quantitative variables. Outcomes are shown with 95% confidence intervals. Categorical variables are described using counts by class and frequencies (%).
Comparison of outcomes per allocation group and per BMI class was tested with Student’s t-test, one-way analysis of variance (ANOVA), or the Kruskal-Wallis H-test depending on homoscedasticity or normality of distribu-tions. Two-way ANOVA was used to compare longitudinal variations between allocation groups, but without an in-teraction test because of unequal class sizes. Categorical data
were compared with chi2test. To test the association between
two quantitative parameters, Pearson’s correlation coeffi-cient was used, or Spearman’s rank correlation if distribu-tions were not Gaussian. Survival curves were drawn using Kaplan-Meier’s method, and comparison of curves was performed using the Log-rank test. A backward and stepwise Cox proportional hazard regression model was used to perform the multivariate analysis of survival. Cutoff values of biological parameters to draw survival curves were chosen among quartiles of distribution.
All tests were two-sided and the nominal level of sig-nificance was 5%. Randomisation and statistics were per-formed using SEM software [16].
3. Results
Biological parameters were evaluated at allocation for half of the 251 patients: n � 57 for the “SPA” experimental group and n � 56 for the “CTR” control group (Figure 1). These 113
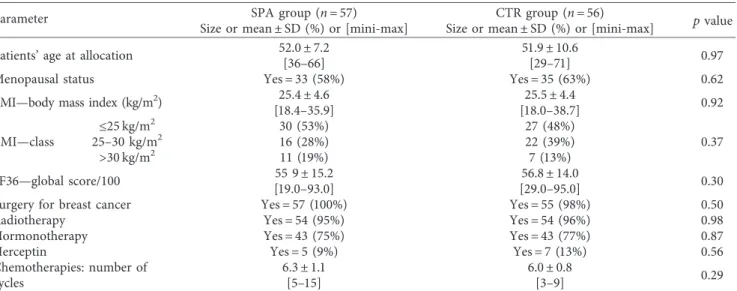
patients are referred to hereafter as the biological study population. At one year post-inclusion, 13 patients withdrew for familial or professional reasons, and 53 and 47 patients remained, respectively, for the SPA and CTR groups. The main covariates were distributed similarly between the al-location groups (Table 1). Cancer treatments were similar and standard for invasive tumours. Most patients’ tumours were HR positive and treated using hormonotherapy, and a few (Her2+ tumours) using targeted therapy.
3.1. Diet, Body, and Biological Parameters at Allocation. Results of the biological study population were considered in function of BMI scale and divided into three subgroups, i.e.,
≤25 kg/m2for normal BMI, [25–30 kg/m2] for overweight,
and >30 for obesity (Tables 2 & 3). Overall diet mean results (Table 2) were within adult nutritional recommendations (17.3% ± 4.1, 46.7% ± 10.4, and 35.5% ± 8.6, respectively, for protein, carbohydrate, and lipid intakes). A large dispersion of values was observed, resulting in no significant difference between BMI subgroups except for total energy intake (TEI) (p � 0.038) and lipid intake in gram/day (p � 0.034). The large standard deviation for each nutrient-intake value re-flected an unbalance diet for some patients in the three BMI subgroups.
All body parameters (Table 2) differed significantly by BMI subgroup (p < 10 − 7). As expected, the lean mass/fat mass ratio decreased with the BMI due to the expansion of the body fat mass, i.e., 2.4 ± 0.6, 1.7 ± 0.3, and 1.3 ± 0.3, respectively, for normal, overweight, and obese subgroups (p < 10 − 7).
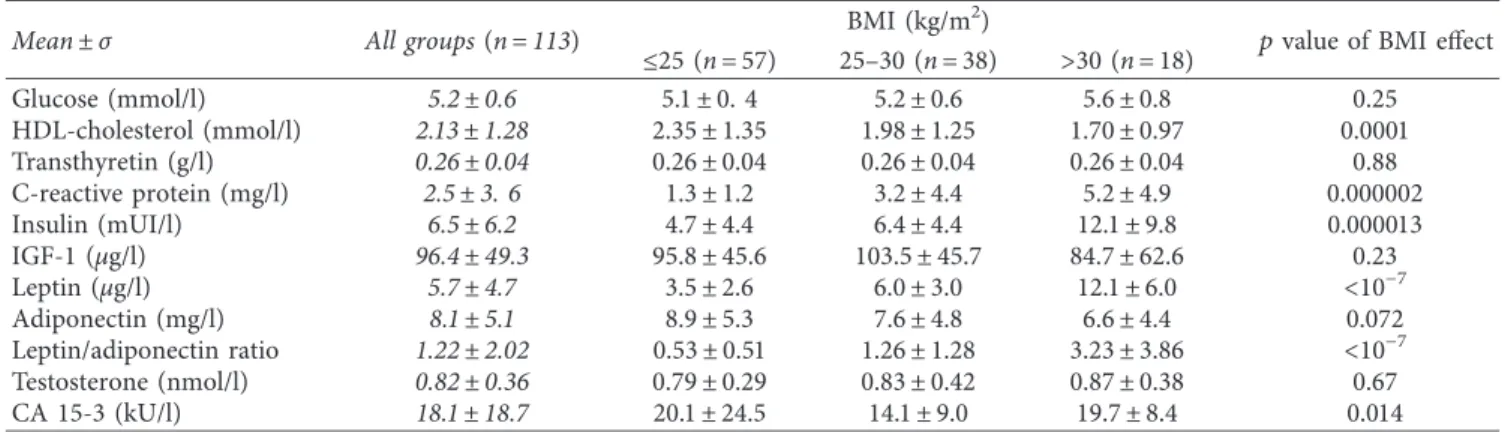
As previously noticed, we observed a large dispersion of all biological parameter values (Table 3) regardless of BMI subgroup. Increased plasma levels of CRP (p < 10 − 5), in-sulin (p < 10 − 4), and leptin (p < 10 − 7) showed dysme-tabolic disorders associated with overweight/obesity. As expected, the ratio of leptin/adiponectin significantly in-creased with BMI (0.53 ± 0.51, 1.26 ± 1.28, and 3.23 ± 3.86, respectively, for normal, overweight, and obese groups,
p< 10 − 7). Conversely, a significant decrease in HDL-C
level with BMI (p < 10 − 4) was observed. Transthyretin, similar between groups, was in the physiological range, showing no malnutrition disorders in the studied pop-ulation. Other parameters (glucose, IGF-1, testosterone, and CA 15-3) were in the normal range, with no difference between BMI groups except for CA 15-3 (p � 0.014).
3.2. Changes in Diet, Body, and Biological Parameters One Year Later. One year after inclusion, Diet consumption, body, and biological parameters of patients were reevaluated one year after inclusion. All the raw data are presented by BMI subgroups in two supplementary data files: one for the SPA group (Supplementary Table 1) and one for the CTR group (Supplementary Table 2). Variations in each pa-rameter between inclusion and one-year follow-up are shown in Tables 4 and 5 and analyzed according to the intervention group (SPA effect), one-year follow-up (time effect), and BMI subgroups (BMI effect).
No significant difference was observed for diet pa-rameters (Table 4) regardless of the intervention group, the time window, or the BMI subgroup, except for the total energy intake with time (p � 0.039). For the SPA group, total energy intake remained stable for BMI subgroups ≤25
and [25–30 kg/m2], whereas a strong reduction (−400 kcal/
d) in the BMI >30 subgroup led to both carbohydrate (−21.5%) and lipid (−13.8%) intake decreases without change in patients’ weight. For the CTR group, total energy intake decreased for ≤25 and >30 BMI subgroups due to a reduction in protein, carbohydrate, and lipid intakes. However, an increase in the mean body weight of 1 kg was observed for each BMI subgroup (supplementary data), which was not significant because of the large dispersion of individual values.
For body parameters (Table 4), we observed that only the
BMI effect was significant (p < 10−7). All the parameters
were significantly related to BMI but remained stable
considering both SPA and time effects. For the SPA and CTR >30 BMI subgroups, a reduction in brachial and abdominal circumferences tended to correlate with an increase in hip circumference.
No significant SPA effect was observed for biological parameters (Table 5), except for transthyretin (p � 0.041) and CA 15-3 (p � 0.04) plasma levels, although these remained in the normal ranges. For the time effect, a sig-nificant increase in both glucose (p � 0.04) and insulin (p � 0.035) and a decrease in HDL-C (p � 0.027) plasma levels were observed. As expected, several parameter vari-ations were related to BMI in the two groups as previously shown at allocation. Notably, we noticed an increase in glucose (p < 10 − 6), insulin (p < 10 − 7), and adiponectin (p � 0.022) plasma levels regardless of the intervention group and more accentuated plasma levels for the >30 BMI subgroups. Conversely, a decrease in HDL-C plasma levels was observed (p � 0.007).
Assessed for eligibility (n = 450)
Randomized (n = 251) Enrollment
Allocation
Allocated to intervention (n = 125) Received CTR intervention (n = 115) Did not received CTR intervention (n = 10) Allocated to intervention (n = 126)
Received SPA intervention (n = 117) Did not received SPA intervention (n = 9)
Biology analysis on half of the population
Survival (n = 56) Follow-up (years) median = 5.2 [0.5-6.9] 1 lost of view Survival (n = 55) Follow-up (years) median = 4.8 [0.3-6.8] 1 lost of view Biology and diet∗ (n = 56) Allocation
Biology and diet∗ (n = 57) Allocation
Early exit < 1 year 3 for personal reasons Early exit < 1 year
3 for personal reasons
199 patients refused to participate: (I) personal reasons (n = 58) (II) health difficulties (n = 45) (III) not interested (n = 36) (IV) familial reasons (n = 28) (V) transport problems (n = 15) (VI) work resumption (n = 12) (VII) want to forget the cancer (n = 5)
Follow-up
6 because randomized to CTR group 4 refused to continue
6 for personal reasons 3 for professional reasons
1-year follow-up (n = 55) 2 samples missing
1-year follow-up (n = 49) 7 samples missing
We found significant positive correlations in the bio-logical study population between leptin/adiponectin ratio and insulin (r � 0.46, p < 10 − 7) and CRP (r � 0.46,
p< 10 − 7) and a negative correlation with HDL-C
(p � −0.46, p < 10 − 7). The leptin/adiponectin ratio was strongly correlated with waist circumference (r � 0.67,
p< 10 − 7), BMI (r � 0.51, p < 10 − 7), and cell mass (r � 0.46,
p< 10 − 7). Moreover, despite the absence of variation in
Table 1: Study population characterization.
Parameter Size or mean ± SD (%) or [mini-max]SPA group (n � 57) Size or mean ± SD (%) or [mini-max]CTR group (n � 56) pvalue
Patients’ age at allocation 52.0 ± 7.2 51.9 ± 10.6 0.97 [36–66] [29–71]
Menopausal status Yes � 33 (58%) Yes � 35 (63%) 0.62 BMI—body mass index (kg/m2) 25.4 ± 4.6 25.5 ± 4.4 0.92
[18.4–35.9] [18.0–38.7] ≤25 kg/m2 30 (53%) 27 (48%) 0.37 BMI—class 25–30 kg/m2 16 (28%) 22 (39%) >30 kg/m2 11 (19%) 7 (13%) SF36—global score/100 55 9 ± 15.2 56.8 ± 14.0 0.30 [19.0–93.0] [29.0–95.0]
Surgery for breast cancer Yes � 57 (100%) Yes � 55 (98%) 0.50 Radiotherapy Yes � 54 (95%) Yes � 54 (96%) 0.98 Hormonotherapy Yes � 43 (75%) Yes � 43 (77%) 0.87 Herceptin Yes � 5 (9%) Yes � 7 (13%) 0.56 Chemotherapies: number of
cycles
6.3 ± 1.1 6.0 ± 0.8
0.29
[5–15] [3–9]
The main covariates of the studied population at allocation are presented with mean ± standard deviation (SD) for Gaussian quantitative variables. Outcomes are shown with 95% confidence intervals. Categorical variables were described using counts by class and frequencies (%). Comparison of outcomes was tested with Student’s t-test or the Kruskal-Wallis H-test depending on homoscedasticity or normality of distributions. Categorical data were compared with the chi2 test. All tests were two-sided, and the nominal level of significance was 5%.
Table 2: Diet and Body parameters at allocation.
Mean ± σ All groups (n � 113) BMI (kg/m
2)
pvalue of BMI effect ≤25 (n � 57) 25–30 (n � 38) >30 (n � 18)
Diet parameters
Total energy intake (TEI) (kcal/d) 1492 ± 450 1540 ± 358 1325 ± 378 1689 ± 678 0.038 Protein intake (g/d) 63.6 ± 20.2 65.3 ± 15.1 58.7 ± 20.0 68.8 ± 30.1 0.86 (% TEI) 17.3 ± 4.1 17.2 ± 3.5 17.9 ± 5.2 16.4 ± 3.1 0.71 Carbohydrate intake (g/d) 172.6 ± 61.5 175.3 ± 54.1 156.8 ± 53.7 197.2 ± 85.1 0.65 (% TEI) 46.7 ± 10.4 45.4 ± 9.5 48.1 ± 12.8 47.8 ± 6.5 0.75 Lipid intake (g/d) 59.7 ± 25.4 63.5 ± 22.3 50.6 ± 23.6 66.8 ± 31.8 0.034 % TEI 35.5 ± 8.6 36.8 ± 8.4 33.5 ± 9.8 35.8 ± 5.0 0.14 Body parameters Body weight (kg) 65.2 ± 12.5 56.6 ± 6.4 68.5 ± 5.8 85.3 ± 10.7 <10−7 Lean mass (LM) (kg) 42.1 ± 5.8 39.6 ± 4.5 43.0 ± 4.8 47.9 ± 6.3 <10−7 (%) 65.2 ± 6.8 69.6 ± 5.3 62.9 ± 3.7 56.3 ± 4.5 <10−7 Fat mass (FM) (kg) 23.0 ± 7.8 17.2 ± 3.7 25.5 ± 3.1 36.2 ± 5.1 <10−7 (%) 34.6 ± 6.7 30.1 ± 5.0 37.3 ± 3.8 43.1 ± 4.4 <10−7 Ratio LM/FM 2.0 ± 0.6 2.4 ± 0.6 1.7 ± 0.3 1.3 ± 0.3 <10−7 Cell mass (kg) 25.0 ± 4.0 22.8 ± 2.5 25.5 ± 3.3 30.7 ± 3.5 <10−7 Total water (l) 32.9 ± 3.9 31.1 ± 2.6 33.2 ± 2.7 38.1 ± 4.6 <10−7 (%) 51.3 ± 5.4 55.1 ± 4.0 48.5 ± 3.2 44.9 ± 2.8 <10−7 Extracellular water (%) 24.3 ± 3.4 25.7 ± 1.7 23.1 ± 2.1 22.8 ± 6.5 <10−7 Intracellular water (%) 27.1 ± 2.4 28.2 ± 1.8 26.1 ± 2.8 25.6 ± 1.2 <10−7 Tricipital fold thickness (cm) 17.4 ± 8.6 12.5 ± 5.2 18.8 ± 7.2 29.6 ± 6.4 <10−7
Arm circumference (cm) 30.2 ± 3.8 27.7 ± 2.2 31.1 ± 1.7 36.4 ± 3.3 <10−7 Waist circumference (WC) (cm) 84.0 ± 13.5 75.4 ± 7.7 86.8 ± 9.0 105.5 ± 8.9 <10−7 Hip circumference (HC) (cm) 101.1 ± 9.1 95.0 ± 4.9 103.5 ± 5.5 115.7 ± 5.6 <10−7
Ratio WC/HC 0.83 ± 0.09 0.79 ± 0.07 0.84 ± 0.09 0.92 ± 0.08 0.000017
Diet parameters for food intake are expressed in raw value (gram/day) and in % of total energy intake. Body parameters are expressed in raw value (kilogram or liter) and in % of body mass. Comparison of outcomes per BMI group at allocation was tested with one-way analysis of variance (ANOVA). The test was two-sided, and the nominal level of significance was 5%.
testosterone plasma level with SPA, time, or BMI effects, this parameter was significantly associated (i) positively with body weight (r � +0.15, p � 0.03), cell mass (r � +0.19,
p �0.0072), arm circumference (r � +0.15, p � 0.026), WC/
HC ratio (r � +0.15, p � 0.027), and transthyretin (r � +0.15,
p �0.028) and (ii) negatively with TEI (r � −0.16, p � 0.022)
and HDL-C (r � −0.19, p � 0.007).
3.3. Biological Parameters and Recurrence Relation. We tested the association between biomarker plasma levels at allocation expressed in quartiles and the risk of recurrence during the seven-year follow-up. Highest HDL-cholesterol values were associated with the best survival without re-currence (p � 0.047). Conversely, the lowest testosterone and CA 15-3 values were associated with longer disease-free survival (p � 0.001 and 0.03, respectively) (Table 6).
The survival curves for these three biomarkers were done in function of the calculated significant threshold values (2.13 mmol/l, 0.9 nmol/l, and 20 kUI/l, respectively, for HDL-C, testosterone, and CA 15-3) (Figures 2(a), 2(b), 2(e)). For testosterone, two other survival curves were plotted taking into account the hormonotherapy status of patients (Figures 2(c), 2(d)). These latter showed that testosterone was relevant for disease-free survival only in patients treated with hormonotherapy (p � 0.012 vs. p � 0.69, respectively, for patients with and without hormonotherapy). Using the Cox model, the link between these variables and disease-free survival was tested and demonstrated that only the highest testosterone values predicted increased recurrence risk (HR [CI–95%] � 5.06 [1.66–15.41], p � 0.004) (Figure 2(f )).
4. Discussion
In the present study, we determined the effects of PACThe intervention (i.e., medical, nutritional, and psychological monitoring; physical activity training; SPA; and aesthetic care) on the biological and anthropometric status of patients at allocation and after one-year follow-up.
As obesity has an impact on biological status and is a risk factor for breast cancer, we chose to discuss the data according to three BMI subgroups defined as follows:
≤25 kg/m2for normal BMI, [25–30 kg/m2] for overweight,
and >30 for obesity. At allocation, the study population’s repartition into BMI subgroups was similar to that of the same-age female French population, as previously described [17]. The diet intakes are in accordance with the adult nutritional recommendations for all groups. We noted no difference between the three subgroups but a great variation in declared intakes, particularly in the obese group, raising doubts as to the reliability of the consumption-data col-lection based on a 72-h self-report.
At allocation, after the completion of breast cancer treatment, the biological and body parameters of the pop-ulation were in accordance with the usual observed values for normal, overweight, and obesity status. Considering the mean value for each parameter defined as EGIR metabolic syndrome criteria (glucose > 6.1 mmol/l, HDL-C < 1 mmol/l, insulin >18 mUI/l (QR4), and waist circumference > 80 cm), neither overweight nor obesity subgroups met the three required criteria [18]. Among these parameters, only the central criterion of obesity (waist circumference) was above the limit value and emerged as the earliest criterion of metabolic syndrome under our conditions. However, con-sidering the large value dispersion of all these parameters, some patients of both overweight and obese groups could present a metabolic syndrome.
Obesity is well-known to be associated with elevated circulating levels of insulin, insulin-like growth factor 1 (IGF-1), leptin, and inflammation [19]. In our study, we observed a significant increase in CRP, insulin, leptin plasma levels, and the ratio leptin/adiponectin in parallel with significantly increased adiposity markers (fat mass, arm, waist, and hip circumferences). As expected, circu-lating anti-inflammatory adiponectin was decreased, reinforcing the sub-chronic inflammation associated with obesity and related to the risk of recurrence [20]. Sur-prisingly, no difference was observed for IGF-1 and
tes-tosterone plasma contents, contrary to previous
observations [8, 13], probably due to the huge variability of individual values. Their plasma concentrations were maintained in the physiological range for the female population of corresponding age [21, 22].
Table 3: Biological parameters at allocation.
Mean ± σ All groups (n � 113) BMI (kg/m
2)
pvalue of BMI effect ≤25 (n � 57) 25–30 (n � 38) >30 (n � 18) Glucose (mmol/l) 5.2 ± 0.6 5.1 ± 0. 4 5.2 ± 0.6 5.6 ± 0.8 0.25 HDL-cholesterol (mmol/l) 2.13 ± 1.28 2.35 ± 1.35 1.98 ± 1.25 1.70 ± 0.97 0.0001 Transthyretin (g/l) 0.26 ± 0.04 0.26 ± 0.04 0.26 ± 0.04 0.26 ± 0.04 0.88 C-reactive protein (mg/l) 2.5 ± 3. 6 1.3 ± 1.2 3.2 ± 4.4 5.2 ± 4.9 0.000002 Insulin (mUI/l) 6.5 ± 6.2 4.7 ± 4.4 6.4 ± 4.4 12.1 ± 9.8 0.000013 IGF-1 (μg/l) 96.4 ± 49.3 95.8 ± 45.6 103.5 ± 45.7 84.7 ± 62.6 0.23 Leptin (μg/l) 5.7 ± 4.7 3.5 ± 2.6 6.0 ± 3.0 12.1 ± 6.0 <10−7 Adiponectin (mg/l) 8.1 ± 5.1 8.9 ± 5.3 7.6 ± 4.8 6.6 ± 4.4 0.072 Leptin/adiponectin ratio 1.22 ± 2.02 0.53 ± 0.51 1.26 ± 1.28 3.23 ± 3.86 <10−7 Testosterone (nmol/l) 0.82 ± 0.36 0.79 ± 0.29 0.83 ± 0.42 0.87 ± 0.38 0.67 CA 15-3 (kU/l) 18.1 ± 18.7 20.1 ± 24.5 14.1 ± 9.0 19.7 ± 8.4 0.014
Plasma biological parameters are expressed in usual unit per liter. Comparison of outcomes per BMI group at allocation was tested with one-way analysis of variance (ANOVA). The test was two-sided, and the nominal level of significance was 5%.
T able 4: Variation in diet and body parameters between one-year follow-up and allocation. SPA arm (n � 55) CTR arm (n � 49) p value effect of ≤ 25 (n � 29) ]25–30] (n � 15) > 30 (n � 11) ≤ 25 (n � 23) 25–30 (n � 19) > 30 (n � 7) SPA T ime BMI Diet parameters T otal energy intake kcal/d − 41.7 ± 400.5 +25.5 ± 556.4 − 400. 1 ± 527.6 − 227.9 ± 362.6 +165.6 ± 410.4 − 437.6 ± 955. 1 0.9 1 0.039 0. 15 (-0.02%) (+10.8%) (− 18.7%) (-12.3%) (+20. 1%) (− 10.3%) Protein intake g/d − 4.6 ± 17.9 +3.2 ± 25.5 − 5.8 ± 19.0 − 1.78 ± 27. 1 +5. 1 ± 21.4 − 15.4 ± 45.4 0.7 1 0.24 0.35 (-3.9%) (+17.5%) (-3. 1%) (+6.0%) (+26. 1%) (− 1.4%) Carbohydrate intake g/d +8.4 ± 52.2 +6. 1 ± 63.7 − 57.9 ± 78.3 − 28.4 ± 54.8 +6.7 ± 51.2 − 46.7 ± 12 1. 1 0.84 0. 10 0.38 (+10. 1%) (+16.7%) (− 21.5%) (− 9.8%) (+7.5%) (− 1.5%) Lipid intake g/d − 5.5 ± 26.4 − 1.3 ± 36.4 − 12.7 ± 25.2 − 9.4 ± 19.8 +13.0 ± 13.0 − 24.6 ± 45.4 0.89 0.099 0. 15 (+0.2%) (+24.0%) (− 13.8%) (− 7.9%) (+67.3%) (− 21. 1%) Body parameters Body weight kg − 0. 10 ± 2. 16 +1.47 ± 4.00 − 0.73 ± 5.76 − 0.24 ± 2.67 +0.26 ± 3.86 +0.93 ± 2.4 1 0.56 0.45 <10 –7 (− 0.2%) (+2.2%) (− 0.3%) (− 0.5%) (+0.4%) (+1. 1%) Lean mass (LM) % +1.03 ± 3.63 − 0.25 ± 1.66 − 0.34 ± 5.85 0.00 ± 3.20 − 0.02 ± 3. 14 +3.09 ± 7.07 0. 18 0.85 <10 –7 (+1.7%) (− 0.4%) (− 0.0%) (− 0.0%) (+0. 1%) (+6.0%) Fat mass (FM) % − 0.85 ± 3.50 +0.25 ± 1.66 +0.3 1 ± 5.90 − 0.00 ± 3.20 +0.02 ± 3. 14 − 1.64 ± 6.05 0. 11 0.86 <10 –7 (− 2.7%) (+0.6%) (+2.0%) (0.0%) (+0.6%) (-3.6%) LM/FM ratio +0. 10 ± 0.39 − 0.0 1 ± 0. 14 − 0.03 ± 0.37 +0.04 ± 0.40 − 0.0 1 ± 0.29 +0. 17 ± 0.39 0.20 0.77 <10 –7 (+5.0%) (− 0.6%) (+1.6%) (+1.7%) (+0.9%) (+14.4%) Cell mass kg +1.34 ± 6.57 +0.95 2.2 1 +0.54 ± 3.02 − 0.83 ± 4.52 − 0.66 ± 4.74 +2. 15 ± 5.82 0. 19 0.34 <10 –7 (+6.8%) (+5.2%) (+2.0%) (− 2.8%) (− 1.7%) (+7.3%) T otal water l +0.25 ± 1.62 +0.5 1 ± 1.45 +0. 13 ± 2.53 − 0.06 ± 1.02 +0. 11 ± 1.86 +1.07 ± 5. 15 0.22 0.40 <10 –7 (+0.9%) (+1.7%) (+0.8%) (− 0. 1%) (+0.5%) (+3.2%) Extracellular water % +0.5 1 ± 1.72 − 0.67 ± 1.67 +0.02 ± 2.33 +1. 14 ± 4. 1 0.98 ± 3.72 − 3.97 ± 10.72 0.80 0.86 <10 –7 (+2.0%) (− 2.3%) (+0.6%) (+4.9%) (+4.3%) (− 7.2%) Intracellular water % +2.2 1 ± 9.32 +0.6 1 ± 1.32 − 0.08 ± 1.99 − 0.35 ± 4.76 − 0.59 ± 4.68 +1.65 ± 4.55 0.28 0.53 0.000 12 (+7.7%) (+3.2%) (− 0.2%) (− 1.3%) (− 1.9%) (+7.0%) T ricipital fold thickness cm +0.46 ± 3.74 − 0.57 ± 7.78 − 3.25 ± 5.4 1 +0.23 ± 5.05 +2.98 ± 5.60 − 2.5 1 ± 4.95 0.36 0.69 <10 –7 (+10.7%) (+1.5%) (− 7.5%) (+14. 1%) (+25.3%) (− 6.3%) Arm circumference cm − 0. 10 ± 1.77 − 1.00 ± 1.49 − 1.46 ± 1.94 − 0.46 ± 1.7 1 − 0.32 ± 2. 16 − 0.93 ± 2.0 1 0.58 0.32 <10 –7 (− 0.3%) (− 3. 1%) (− 3.6%) (− 1.7%) (− 1. 1%) (− 2.4%) Waist circumference (WC) cm − 2.93 ± 4.4 1 +0.43 ± 3.68 − 1.09 ± 5.00 − 0.46 ± 5.65 +1.45 ± 8.5 1 − 3.36 ± 6.24 0.73 0.8 1 <10 –7 (− 3.7%) (− 0.4%) (− 1.0%) (− 0.4%) (+2.7%) (− 3.0%) Hip circumference (HC) cm − 0.59 ± 2.80 1.77 ± 2.83 0.23 ± 5.85 − 1.30 ± 3.56 − 0. 13 ± 3.7 1 2.79 ± 5.53 0.80 0.66 <10 –7 (− 0.6%) (+1.7%) (+0.4%) (− 1. 1%) (− 0. 1%) (2.5%) WC/HC ratio − 0.03 ± 00.05 − 0.0 1 ± 0.02 − 0.0 1 ± 0.07 +0.0 1 ± 0.05 +0.2 ± 0.08 − 0.05 ± 0.06 0.66 0.6 1 <10 –7 (− 2.9%) (− 1.5%) (− 1. 1%) (+0.9%) (+3. 1%) (− 4.9%) Variation for each parameter is expressed in raw value (one-year follow-up value minus allocation value) and in percentage of the allocation value: + sign indicates an increase and –sign indicates a decrease. T wo-way ANOVA was used to compare longitudinal variations between allocation arms (SPA effect), or one-year follow-up (time effect), or BMI groups (BMI effect), but without interaction test because of unequal class sizes. All tests were two-sided, and the nominal level of significance was 5%. Significant p values are indicated in bold.
T able 5: Variation in biological parameters between one-year follow-up and allocation. SPA arm (n � 55) CTR arm (n � 49) p value effect of ≤ 25 25–30 > 30 ≤ 25 25–30 > 30 SPA T ime BMI (n � 29) (n � 15) (n � 11) (n � 23) (n � 19) (n � 7) Glucose mmol/l 0.007 ± 0.446 0.459 ± 0.748 0.749 ± 1.358 − 0.089 ± 0.326 0.226 ± 0.394 1.75 ± 2.775 0.23 0.04 <10 –6 (0.6%) (8.9%) (15.9%) (− 1.6%) (4.4%) (25.9%) HDL-cholesterol mmol/l − 0.438 ± 1.47 1 − 0.24 1 ± 1.34 − 0.542 ± 1.3 1 − 0.436 ± 1.384 − 0.333 ± 1.635 − 0.028 ± 0. 198 0.4 1 0.027 0.007 (− 5.6%) (3.4%) (− 13%) (− 4.8%) (7%) (− 1.3%) T ransthyretin g/l 0.00 1 ± 0.038 0.009 ± 0.026 − 0.005 ± 0.027 0.00 1 ± 0.033 − 0.007 ± 0.03 1 0.002 ± 0.05 1 0.04 1 0.75 0.79 (1%) (3.5%) (− 1.5%) (0.8%) (− 2%) (3.2%) C-reactive protein mg/l − 0. 146 ± 1. 142 0.238 ± 2.8 18 − 0. 127 ± 1.48 1 0.264 ± 1. 168 − 0. 135 ± 4.736 − 1 ± 5.545 0. 11 0.73 <10 –7 (11. 1%) (27.3%) (8.9%) (4 1.8%) (4 1. 1%) (− 6.6%) Insulin mUI/l 0. 17 ± 3.79 1.97 ± 4.59 2.5 1 ± 10. 19 0.22 ± 6.58 4.47 ± 10.5 1 4.53 ± 6.24 0.4 1 0.035 <10 –7 (25.7%) (115.7%) (58.4%) (36. 1%) (50.9%) (78.4%) IGF-1 μ g/l − 0.79 ± 27.5 1 − 26.6 1 ± 27.25 − 18.78 ± 23.9 − 13. 18 ± 39.9 − 12.4 1 ± 34.83 9. 13 ± 16.55 0.32 0.072 0.3 1 (6.3%) (− 19.7%) (− 24%) (− 4.2%) (− 12.2%) (16.5%) Leptin μ g/l − 0.03 ± 1.57 − 0.02 ± 2.72 − 2.42 ± 6.24 0. 12 ± 2.38 1.64 ± 6.28 − 0.93 ± 3.78 0.66 0.8 1 <10 –7 (15.6%) (9%) (− 2.4%) (2 1.7%) (23.6%) (− 7.4%) Adiponectin mg/l 2.33 ± 4. 19 1.29 ± 2.3 0.57 ± 1.3 0.99 ± 2.5 1 1. 15 ± 2.65 0.65 ± 1.0 1 0.33 0.082 0.022 (32.6%) (17.3%) (18%) (13.9%) (11.5%) (5.6%) Leptin/adiponectin ratio − 0. 1 ± 0.27 − 0.08 ± 0.52 − 1.68 ± 2.92 0. 13 ± 1.2 1 1.2 ± 4.07 − 0.27 ± 0.29 0.73 0.9 1 2 × 10 –6 (− 2.9%) (− 0.4%) (− 18%) (24.2%) (16.6%) (− 13.6%) T estosterone nmol/l − 0.033 ± 0.299 − 0.0 13 ± 0.098 0.045 ± 0.347 − 0.05 1 ± 0.244 0.0 15 ± 0.332 0.029 ± 0.757 0.086 0.83 0.27 (− 3.6%) (5%) (10.7%) (− 5%) (3.4%) (2 1.8%) CA 15-3 kU/l 2.32 ± 3.08 0.62 ± 1.78 0.27 ± 1.7 1 − 5.32 ± 28.45 1.56 ± 2.06 2.7 1 ± 1.48 0.04 0.68 0.07 (18.2%) (6.8%) (4.7%) (1.4%) (12.5%) (14%) Variation for each parameter is expressed in raw value (one-year follow-up value minus allocation value) and in percentage of the allocation value: + sign indicates an increase and – sign indicates a decrease. T wo-way ANOVA was used to compare longitudinal variations between allocation arms (SPA effect), or one-year follow-up (time effect), or BMI groups (BMI effect), but without interaction test because of unequal class sizes. All tests were two-sided, and the nominal level of significance was 5%. Significant p values are indicated in bold.
Table 6: Prognostic value of biological parameters on disease-free survival over 7 years. Parameters at allocation (n � 111) Median (quartiles) Threshold
≤1stquartile ≤ Median ≤3rdquartile
Cholesterol-HDL (mmol/l) 1.78 [1.46–2.13] p �0.64 p �0.22 p �0.047(+) Testosterone (nmol/l) 0.7 [0.7–0.9] ND p �0.049(−) p �0.001(−)
CA 15-3 (kU/l) 14 [10–20] p �0.28 p �0.07(−) p �0.03(−)
Association of biological parameters at allocation with the recurrence risk was tested using a two-sided chi2test. The nominal level of significance was
5%. + sign indicates that high values are in favour of a better prognosis, while – sign indicates that these high values worsen prognosis.
100 75 50 25 0 Dis eas e-f re e sur vi val 0 years 2 4 6 8 p = 0.047 HDL-C ≥ 2.13 nmol/l (N = 31) HDL-C < 2.13 nmol/l (N = 80) (a) 100 75 50 25 0 Dis eas e-f re e sur vi val 0 years 2 4 6 8 p = 0.001 Testo. < 0.9 nmol/l (N = 87) Testo. ≥ 0.9 nmol/l (N = 24) (b) 100 75 50 25 0 Dis eas e-f re e sur vi val 0 years 2 4 6 8 p = 0.76 Testo. ≥ 0.9 nmol/l (N = 3) Testo. < 0.9 nmol/l (N = 23) (c) 100 75 50 25 0 Dis eas e-f re e sur vi val 0 years 2 4 6 8 p = 0.0053 Testo. < 0.9 nmol/l (N = 64) Testo. ≥ 0.9 nmol/l (N = 21) (d) 100 75 50 25 0 Dis eas e-f re e sur vi val 0 years 2 4 6 8 p = 0.03 CA 15-3 ≤ 20kUl/l (N = 84) CA 15-3 > 20kUl/l (N = 27) (e) Covariables (n = 111) Hazard ratios [CI‐95%] HDL cholesterol 0.29 [0.05 – 1.72] 5.06 [1.66 – 15.41] 0.0044 Testosterone 1.01 [0.99 – 1.03] 0.48 CA 15‐3 0.17 p 0 1 6 (f )
Figure 2: Survival curves and hazard ratios for HDL-cholesterol, testosterone, and CA 15-3. (a) HDL-cholesterol. (b) Testosterone—all patients. (c) Testosterone—patients without hormonotherapy. (d) Testosterone—patients with hormonotherapy. (e) CA 15-3. (f ) Hazard ratios (Cox model). Threshold values for HDL-cholesterol, testosterone, and CA 15-3 at allocation correspond to the 75% percentile values. They were used to draw survival curves using Kaplan-Meier’s method. Comparison of curves was performed using the Log-rank test. Backward stepwise Cox proportional hazard regression model was used to perform the multivariate analysis of survival. All tests were two-sided, and the nominal level of significance was 5%.
Globally, as measurements were performed after completion of breast cancer treatment, body and biological parameters seemed to be more linked to BMI status than to breast disease. Nevertheless, as previously described [23–25], we cannot exclude that the breast cancer therapy may be another cause of metabolic disturbances at allo-cation. That may be the reason for the great variability observed for all parameters regardless of the BMI subgroup.
One year after inclusion, the impact of the SPA inter-vention on diet, body, and biological parameters was evaluated. Only transthyretin and CA 15-3 plasma levels were significantly affected by the SPA intervention. Trans-thyretin, one of the thyroid hormone carriers, is recognized as an acute malnutrition marker whose hepatic synthesis is reduced in case of inflammation [26]. In our study, trans-thyretin levels remained in the normal range and seemed to be without biological meaning in regard of their tiny vari-ations and the absence of inflammation and of lean mass changes. Breast cancer is generally not associated with malnutrition or sarcopenia, especially so long after treat-ment [27]. CA 15-3 is frequently used for diagnosis and follow-up of breast cancer [28]. In our study, an a posteriori bias appeared for these biomarker data because the CTR group patients presented higher CA 15-3 concentrations than the SPA group at allocation (Supplementary Table 2). One year after treatment completion, as none of the patients was in recurrence, CA 15-3 values decreased under the threshold of 30 kU/l, confirming the efficacy of the therapy [29, 30]. In accordance with previous studies showing modest effects on body and biological parameters of physical activity and nutritional interventions [31, 32], our study shows the lack of one-year impact of a 2-week SPA intervention.
Some metabolic disorder changes were pointed out at one-year follow-up (time effect). Despite a decrease in total energy intake, patients presented an increase in glucose and insulin plasma levels associated with a decrease in HDL-C. These parameters suggest the development of insulin re-sistance independently of the BMI effect for overweight patients and the reinforcement of insulin resistance for obese patients. These observations are in agreement with previous studies which considered breast cancer as a metabolic dis-ease, with insulin resistance, sub-chronic inflammation, and dysmetabolism induced by therapy [33, 34]. Moreover, an increased risk for metabolic syndrome and obesity has been described in long-term breast cancer survivors [35].
If women with breast cancer frequently lose weight during chemotherapy, a common unwanted long-term effect of this therapy is weight gain, which often ranges 2–6 kg [10, 36] and penalizes mainly patients with adjuvant therapy [37]. In our study, weight gain was modest (less than 1 kg) and concerned mainly the overweight BMI groups, of whom the majority were under hormonal adjuvant therapy. Thus, weight control and diet intervention are important to im-prove care and control of recurrence risk in posttreatment breast cancer patients [38]. In our study, the reduction in the total energy intake provided by diet modification, especially
carbohydrate and lipid intakes, demonstrated the efficacy of patient’s nutritional information.
As described at allocation, BMI was the major factor conditioning body and biological parameter changes one year later. For body parameters, we noted high central adiposity (waist and hip circumferences) in the overweight and obese groups. The same biomarker variations were observed and reinforced for the overweight and obese subgroups (i.e., increase in insulin, leptin, and CRP, and decrease in HDL-C). Moreover, these metabolic disorders induced an increased glycaemia and a decreased adipo-nectinemia in relation to more pronounced insulin resis-tance and sub-chronic inflammation [20]. Thus, the obese groups presented two EGIR criteria for metabolic syndrome (glucose and waist circumference) one year after breast cancer treatment completion. This confirms previous studies establishing that breast cancer posttreatment increases the risk of metabolic syndrome [39, 40].
Finally, we clarified the link between biological markers at allocation and disease-free survival over seven years of follow-up after breast cancer treatment completion. We confirmed the interest of three biomarkers commonly used in the determination of recurrence risk: the highest plasma values of HDL-C and the lowest plasma values of testos-terone and CA 15-3 were associated with a reduced risk of recurrence [41–43]. HDL-C is linked to metabolic disorders and is often related to androgen metabolism [44]. Choles-terol is clearly demonstrated to be a key regulator of breast cancer tumours [45]. Favouring liver cholesterol clearance, an increase in HDL-C limits the availability of cholesterol for recurrent cancer stem cells [46]. In our study, patients with the highest circulating HDL-C presented the lowest recur-rence risk. However, this protective effect was not retrieved in the multivariate Cox model, limiting the interest of cir-culating HDL-C determination in recurrence monitoring.
As previously noted, CA 15-3 is a useful marker for breast cancer follow-up: the circulating value is directly related to the stage and mass of the tumour [29]. In our study, although the lowest circulating CA 15-3 values were associated with the lowest recurrence risk, the multivariate Cox model did not confirm this observation. This is in agreement with the literature, which has established the interest in CA 15-3 for monitoring breast tumour growth, but its poor prognostic value for re-currence risk [28, 30].
In our study, only testosterone presented a significant hazard ratio with disease-free survival; that is, the highest circulating values (>0.9 nmol/l) were associated with re-currence risk multiplied by ≈5 (HR � 5.06 [1.66–15.41]). Notably, this link between testosterone and recurrence risk only applied to patients receiving adjuvant hormonotherapy. This observation confirms Venturelli’s observation of in-creased recurrence risk for testosterone plasma concentra-tion above 0.96 nmol/l with a hazard ratio of 4.68 for overweight women but not for obese ones [47]. Testosterone is strongly associated with the androgen hypothesis of breast carcinogenesis, related to the conversion of androgen into oestrogen by aromatase [13]. This enzymatic activity is
increased in obese patients due to the expansion of adiposity [48]. However, it is not clear whether testosterone per se is directly responsible for promoting breast cancer risk or whether it is just a marker of the dysmetabolism linked to overweight and obesity [49]. This later hypothesis was confirmed in our study by the significant correlation of plasma testosterone with several body and biological markers associated with this dysmetabolism (positively with body weight and ratio of WC/HC, and negatively with HDL-C).
Our trial suffers from several limitations:
(1) First, the small numbers of patients divided into different BMI subgroups limited the reliability of the statistical analysis.
(2) Second, the determination of biological parameters at one-year follow-up did not permit the charac-terization of the short-term benefits of our 2-week SPA intervention. Moreover, the one-year time window could explain the weak impact of this in-tervention on the biological parameters.
(3) Third, the mismatches observed between diet con-sumption and weight changes of patients question the reliability of data collection using the 72-h self-reported diet questionnaire.
Few studies investigating the benefits of physical ac-tivity and nutritional interventions in cancer survivors have considered the biological status of the patients in their outcomes. Our data demonstrated that the health changes of patients were mainly related to their body condition and highlighted the importance of evaluating biological and anthropometric status in monitoring cancer survivors.
5. Conclusion
To conclude, our study shows that one year after a global multidisciplinary supportive and educational intervention, few anthropometric and biological changes could be at-tributed to this intervention. It demonstrates that the one-year changes of patients are mainly related to their body mass index (BMI) and confirms the importance of taking into account biological markers of metabolic status in the follow-up of posttherapy breast disease. Among the tools needed for this monitoring, our study highlights the in-terest of plasma testosterone in the evaluation of recurrence risk. These observations may help reinforce care recom-mendations for cancer survivors but need to be confirmed on a large population for a more comprehensive approach. Future studies would permit a better understanding of the mechanisms by which such multidisciplinary interventions could interact with breast cancer recurrence and help define the most effective modalities.
Data Availability
The data used to support the findings of this study are available from the corresponding author upon request.
Additional Points
Highlights. (1) After breast cancer treatment completion, changes in anthropometric and biological parameters are mainly dependent on the patient’s BMI level. (2) A rein-forcement of insulin resistance is observed in overweight and obese patients after one-year treatment completion, independently of physical activity and nutritional inter-vention. (3) Testosterone plasma levels at the time of treatment completion are associated with recurrence risk in patients receiving adjuvant hormonotherapy.
Ethical Approval
The protocol was approved by the AFSSAPS (French Agency for Sanitary Security of Health Products), the regional Ethics Committee (2008), and the French National Committee controlling personal computerized data (CNIL). This trial was performed in compliance with the Helsinki declaration
and registered in ClinicalTrials.gov with the no.
NCT01563588.
Consent
Written informed consent was obtained from all individual participants included in the study.
Conflicts of Interest
The authors declare that they have no conflicts of interest.
Authors’ Contributions
M.-P. V., F. K., M. D., and Y.-J. B. contributed in study conception and design. M.-A. M.-R., I. V. P.-D., A. T., and S. J. contributed in patient inclusion and follow-up. M.-P. V., F. K., and A. R. contributed in acquisition, analysis, and interpretation of the data. M.-P. V., F. K., A. R., and Y.-J. B. drafted the manuscript. All authors gave the final approval.
Acknowledgments
The authors thank all patients who participated in the trial; the contributors of the programme at the Centre Jean Perrin, Pˆole Sant´e R´epublique (Clermont-Ferrand); Thermal resorts (Vichy, Le-Mont-Dore, Chˆatel-Guyon); and others who supported the study. The authors especially thank Nancy Uhrhammer for her careful language editing. The trial was financed by AFRETH (French Association for Hydrother-mal Research) and Auvergne Regional Council, Clermont-Communaut´e, League against Cancer (Puy de Dˆome committee CD63).
Supplementary Materials
Table 1: diet, body, and biological parameters for the SPA arm at allocation and one-year follow-up. Table 2: diet, body, and biological parameters for the CTR arm at allocation and
one-year follow-up. Overall protocol design. (Supplementary Materials)
References
[1] G. Gresham, J. Schrack, L. M. Gresham et al., “Wearable activity monitors in oncology trials: current use of an emerging technology,” Contemporary Clinical Trials, vol. 64, pp. 13–21, 2018.
[2] J. A. Ligibel and H. D. Strickler, “Obesity and its impact on breast cancer: tumor incidence, recurrence, survival, and possible interventions,” American Society of Clinical Oncology
Educational Book, vol. 33, pp. 52–59, 2013.
[3] K. E. Post and J. Flanagan, “Web based survivorship inter-ventions for women with breast cancer: an integrative review,”
European Journal of Oncology Nursing, vol. 25, pp. 90–99,
2016.
[4] S. Y. Loh and A. Nadia, “Methods to improve rehabilitation of patients following breast cancer surgery: a review of sys-tematic reviews,” Breast Cancer: Targets and Therapy, vol. 2015, no. 7, pp. 81–98, 2015.
[5] S. I. Mishra, R. W. Scherer, P. M Geigle et al., “Exercise in-terventions on health-related quality of life for cancer sur-vivors,” The Cochrane Database of Systematic Reviews, vol. 15, no. 8, Article ID CD007566, 2012.
[6] M. C. De Boer, E. A. W¨orner, D. Verlaan, and P. A. M. Van Leeuwen, “The mechanisms and effects of physical activity on breast cancer,” Clinical Breast Cancer, vol. 17, no. 4, pp. 272–278, 2017.
[7] G. Secreto, E. Venturelli, E. Meneghini et al., “Testosterone and biological characteristics of breast cancers in postmen-opausal women,” Cancer Epidemiology Biomarkers &
Pre-vention, vol. 18, no. 11, pp. 2942–2948, 2009.
[8] L. Mauro, G. D. Naimo, E. Ricchio, M. L. Panno, and S. And`o, “Cross-talk between adiponectin and IGF-IR in breast can-cer,” Frontiers in Oncology, vol. 5, p. 157, 2015.
[9] N. M. Iyengar, X. K. Zhou, A. Gucalp et al., “Systemic cor-relates of white adipose tissue inflammation in early-stage breast cancer,” Clinical Cancer Research, vol. 22, no. 9, pp. 2283–2289, 2016.
[10] M. N. Kirshbaum, “A review of the benefits of whole body exercise during and after treatment for breast cancer,” Journal
of Clinical Nursing, vol. 16, no. 1, pp. 104–121, 2007.
[11] L. L. Peterson and J. A. Ligibel, “Physical activity and breast cancer: an opportunity to improve outcomes,” Current
On-cology Reports, vol. 20, no. 7, p. 50, 2018.
[12] C. L. Rock, C. Pande, S. W. Flatt et al., “Favorable changes in serum estrogens and other biologic factors after weight loss in breast cancer survivors who are overweight or obese,” Clinical
Breast Cancer, vol. 13, no. 3, pp. 188–195, 2013.
[13] D. Coradini, A. Orenti, E. Venturelli, A. Cavalleri, E. Biganzoli, and S. Oriana, “Serum levels of testosterone and SHBG in association with body mass index improve the predictive capability of consolidate tumor biomarkers in pre-and postmenopausal breast cancer patients,” Japanese Journal
of Clinical Oncology, vol. 48, no. 4, pp. 308–316, 2018.
[14] F. Kwiatkowski, M. A. Mouret-Reynier, M. Duclos et al., “Long term improved quality of life by a 2-week group physical and educational intervention shortly after breast cancer chemotherapy completion. Results of the ‘programme of accompanying women after breast cancer treatment completion in thermal resorts’ (PACThe) randomised clinical trial of 251 patients,” European Journal of Cancer, vol. 49, no. 7, pp. 1530–1538, 2013.
[15] F. Kwiatkowski, M.-A. Mouret-Reynier, M. Duclos et al., “Long-term improvement of breast cancer survivors’ quality of life by a 2-week group physical and educational inter-vention: 5-year update of the ‘PACThe’ trial,” British Journal
of Cancer, vol. 116, no. 11, pp. 1389–1393, 2017.
[16] F. Kwiatkowski, M. Girard, K. Hacene, and J. Berlie, “Sem: a suitable statistical software adaptated for research in oncol-ogy,” Bull Cancer, vol. 87, no. 10, pp. 715–721, 2000. [17] M. Arnold, M. Touillaud, L. Dossus et al., “Cancers in France
in 2015 attributable to high body mass index,” Cancer
Epi-demiology, vol. 52, pp. 15–19, 2018.
[18] B. Balkau and M. A. Charles, “Comment on the provisional report from the WHO consultation. European group for the study of insulin resistance (EGIR),” Diabet Medicine, vol. 16, no. 5, pp. 442-443, 1999.
[19] D. F. Argolo, C. A. Hudis, and N. M. Iyengar, “The impact of obesity on breast cancer,” Current Oncology Reports, vol. 20, no. 6, p. 47, 2018.
[20] S.-A. Lee, H. Sung, W. Han, D.-Y. Noh, S.-H. Ahn, and D. Kang, “Serum adiponectin but not leptin at diagnosis as a predictor of breast cancer survival,” Asian Pacific Journal of
Cancer Prevention, vol. 15, no. 15, pp. 6137–6143, 2014.
[21] H. Ketha and R. J. Singh, “Clinical assays for quantitation of insulin-like-growth-factor-1 (IGF1),” Methods, vol. 81, pp. 93–98, 2015.
[22] K. M. Wooding, J. A. Hankin, C. A. Johnson et al., “Mea-surement of estradiol, estrone, and testosterone in post-menopausal human serum by isotope dilution liquid chromatography tandem mass spectrometry without deriv-atization,” Steroids, vol. 96, pp. 89–94, 2015.
[23] T. Coskun, F. Kosova, Z. Ari, A. Sakarya, and Y. Kaya, “Effect of oncological treatment on serum adipocytokine levels in patients with stage II-III breast cancer,” Molecular and
Clinical Oncology, vol. 4, no. 5, pp. 893–897, 2016.
[24] A. Alacacioglu, L. Kebapcilar, Z. Gokgoz et al., “Leptin, insulin and body composition changes during adjuvant taxane based chemotherapy in patients with breast cancer, preliminary study,” Indian Journal of Cancer, vol. 53, no. 1, pp. 39–42, 2016.
[25] J. Bao, N. Borja, M. Rao et al., “Impact of weight change during neoadjuvant chemotherapy on pathologic response in triple-negative breast cancer,” Cancer Medicine, vol. 4, no. 4, pp. 500–506, 2015.
[26] A. Tsuboi, M. Terazawa-Watanabe, T. Kazumi, and K. Fukuo, “Associations of decreased serum transthyretin with elevated high-sensitivity CRP, serum copper and decreased hemo-globin in ambulatory elderly women,” Asia Pacific Journal of
Clinical Nutrition, vol. 24, no. 1, pp. 83–89, 2015.
[27] S. Steinbach, T. Hummel, C. B¨ohner et al., “Qualitative and quantitative assessment of taste and smell changes in patients undergoing chemotherapy for breast cancer or gynecologic malignancies,” Journal of Clinical Oncology, vol. 27, no. 11, pp. 1899–1905, 2009.
[28] J. G. Santill´an-Ben´ıtez, H. Mendieta-Zer´on, L. M. G´omez-Oliv´an et al., “The tetrad BMI, leptin, leptin/adiponectin (L/A) ratio and CA 15-3 are reliable biomarkers of breast cancer,”
Journal of Clinical Laboratory Analysis, vol. 27, no. 1,
pp. 12–20, 2013.
[29] Y. Fujimoto, T. Higuchi, A. Nishimukai et al., “High levels of serum CA15-3 and residual invasive tumor size are associated with poor prognosis for breast cancer patients with non-pathological complete response after neoadjuvant chemo-therapy,” Journal of Surgical Oncology, vol. 118, no. 1, pp. 228–237, 2018.
[30] A. Nicolini, A. Carpi, P. Ferrari et al., “An individual reference limit of the serum CEA-TPA-CA 15-3 tumor marker panel in the surveillance of asymptomatic women following surgery for primary breast cancer,” Cancer Management and Research, vol. 10, pp. 6879–6886, 2018.
[31] R. T. Chlebowski, “Nutrition and physical activity influence on breast cancer incidence and outcome,” The Breast, vol. 22, no. Suppl 2, pp. S30–S37, 2013.
[32] A.-M. Foucaut, S. E. Berthouze-Aranda, M. Touillaud et al., “Reduction of health risk factors through an adapted physical activity program in patients with breast cancer,” Supportive
Care in Cancer, vol. 22, no. 4, pp. 1097–1104, 2014.
[33] R. Bhandari, G. A. Kelley, T. A. Hartley, and I. R. H. Rockett, “Metabolic syndrome is associated with increased breast cancer risk: a systematic review with meta-analysis,”
Inter-national Journal of Breast Cancer, vol. 2014, Article ID
189384, 13 pages, 2014.
[34] D. T. Dibaba, D. Braithwaite, and T. Akinyemiju, “Metabolic syndrome and the risk of breast cancer and subtypes by race, menopause and BMI,” Cancers, vol. 10, no. 9, p. 299, 2018. [35] A. Engin, “Obesity-associated breast cancer: analysis of risk
factors,” in Obesity and Lipotoxicity, vol. 960, pp. 571–606, Springer, Berlin, Germany, 2017.
[36] M. Sadim, Y. Xu, K. Selig et al., “A prospective evaluation of clinical and genetic predictors of weight changes in breast cancer survivors,” Cancer, vol. 123, no. 13, pp. 2413–2421, 2017.
[37] A. Ginzac, ´E. Thivat, M.-A. Mouret-Reynier et al., “Weight evolution during endocrine therapy for breast cancer in postmenopausal patients: effect of initial fat mass percentage and previous adjuvant treatments,” Clinical Breast Cancer, vol. 18, no. 5, pp. e1093–e1102, 2018.
[38] M. De Roon, A. M. May, A. McTiernan et al., “Effect of exercise and/or reduced calorie dietary interventions on breast cancer-related endogenous sex hormones in healthy postmenopausal women,” Breast Cancer Research, vol. 20, no. 1, p. 81, 2018.
[39] W. K. Cho, D. H. Choi, W. Park et al., “Effect of body mass index on survival in breast cancer patients according to subtype, metabolic syndrome, and treatment,” Clinical Breast
Cancer, vol. 18, no. 5, pp. e1141–e1147, 2018.
[40] V. Boonyaratanakornkit and P. Pateetin, “The role of ovarian sex steroids in metabolic homeostasis, obesity, and post-menopausal breast cancer: molecular mechanisms and ther-apeutic implications,” BioMed Research International,
vol. 2015, Article ID 140196, 13 pages, 2015.
[41] E. R. Nelson, “The significance of cholesterol and its me-tabolite, 27-hydroxycholesterol in breast cancer,” Molecular
and Cellular Endocrinology, vol. 466, pp. 73–80, 2018.
[42] A. Micheli, E. Meneghini, G. Secreto et al., “Plasma testos-terone and prognosis of postmenopausal breast cancer pa-tients,” Journal of Clinical Oncology, vol. 25, no. 19, pp. 2685–2690, 2007.
[43] P. Kachhawa, K. Kachhawa, D. Agrawal, V. Sinha, P. D. Sarkar, and S. Kumar, “Association of dyslipidemia, increased insulin resistance, and serum CA 15-3 with in-creased risk of breast cancer in urban areas of north and central India,” Journal of Mid-Life Health, vol. 9, no. 2, pp. 85–91, 2018.
[44] M. Voisin, P. De Medina, A. Mallinger et al., “Identification of a tumor-promoter cholesterol metabolite in human breast cancers acting through the glucocorticoid receptor,”
Pro-ceedings of the National Academy of Sciences, vol. 114, no. 44,
pp. E9346–E9355, 2017.
[45] C. Bobin-Dubigeon, A. Chauvin, V. Brillaud-Meflah, F. Boiffard, M.-P. Joalland, and J.-M. Bard, “Liver X receptor (LXR)-regulated genes of cholesterol trafficking and breast cancer severity,” Anticancer Research, vol. 37, no. 10, pp. 5495–5498, 2017.
[46] K. Pelton, C. M. Coticchia, A. S. Curatolo et al., “Hyper-cholesterolemia induces angiogenesis and accelerates growth of breast tumors in vivo,” The American Journal of Pathology, vol. 184, no. 7, pp. 2099–2110, 2014.
[47] E. Venturelli, A. Orenti, A. S. C. Fabricio et al., “Observational study on the prognostic value of testosterone and adiposity in postmenopausal estrogen receptor positive breast cancer patients,” BMC Cancer, vol. 18, no. 1, p. 651, 2018.
[48] C. G´erard and K. A. Brown, “Obesity and breast cancer—role of estrogens and the molecular underpinnings of aromatase regulation in breast adipose tissue,” Molecular and Cellular
Endocrinology, vol. 466, pp. 15–30, 2018.
[49] F. Bertolini, “Adipose tissue and breast cancer progression: a link between metabolism and cancer,” The Breast, vol. 22, pp. S48–S49, 2013.