HAL Id: hal-01960471
https://hal.umontpellier.fr/hal-01960471
Submitted on 19 Dec 2018
HAL is a multi-disciplinary open access
archive for the deposit and dissemination of
sci-entific research documents, whether they are
pub-lished or not. The documents may come from
teaching and research institutions in France or
abroad, or from public or private research centers.
L’archive ouverte pluridisciplinaire HAL, est
destinée au dépôt et à la diffusion de documents
scientifiques de niveau recherche, publiés ou non,
émanant des établissements d’enseignement et de
recherche français ou étrangers, des laboratoires
publics ou privés.
of Roquedur (Gard, France) : a geometric
morphometrics approach
Jorian Prudhomme, Cécile Cassan, Mallorie Hide, Céline Toty, Nil Rahola,
Baptiste Vergnes, Jean-Pierre Dujardin, Bülent Alten, Denis Sereno,
Anne-Laure Bañuls
To cite this version:
Jorian Prudhomme, Cécile Cassan, Mallorie Hide, Céline Toty, Nil Rahola, et al.. Ecology and
morphological variations in wings of Phlebotomus ariasi (Diptera: Psychodidae) in the region of
Roquedur (Gard, France) : a geometric morphometrics approach. Parasites and Vectors, BioMed
Central, 2016, 9, pp.578. �10.1186/s13071-016-1872-z�. �hal-01960471�
R E S E A R C H
Open Access
Ecology and morphological variations in
wings of
Phlebotomus ariasi (Diptera:
Psychodidae) in the region of Roquedur
(Gard, France): a geometric morphometrics
approach
Jorian Prudhomme
1*, Cécile Cassan
1, Mallorie Hide
1, Céline Toty
1, Nil Rahola
1, Baptiste Vergnes
1,
Jean-Pierre Dujardin
2, Bulent Alten
3†, Denis Sereno
2†and Anne-Laure Bañuls
1†Abstract
Background: Phlebotomus ariasi Tonnoir, 1921, is the predominant sand fly species in the Cevennes region and a proven vector of Leishmania infantum, which is the main pathogen of visceral and canine leishmaniasis in the south of France. Even if this species is widely present in Western Mediterranean countries, its biology and ecology remain poorly known. The main goals of this work are to investigate the phenotypic variation of P. ariasi at a local scale in a region characterized by climatic and environmental fluctuations, and to determine if slope and altitude could affect the sand fly phenotypes.
Results: Sand flies were captured along a 14 km-long transect in 2011 from May to October. At the same time, environmental data such as altitude and slope were also collected. Morphological analysis of P. ariasi wings was performed by a geometric morphometrics approach. We found morphological variation among local populations of P. ariasi. Strong shape and size variations were observed in the course of the season (particularly in June and July) for both genders. During June, we highlighted differences in wing phenotypes according to altitude for both sexes and to slope and station for females.
Conclusions: The phenotypic variations observed in P. ariasi along the studied transect indicated these populations are subjected to environmental pressures. Nevertheless, it seems that sand flies are more sensitive to extrinsic factors in June and July, suggesting a phenotypic plasticity.
Keywords: Sand fly, Southern France, Geometric morphometry, Phlebotomus ariasi, Phenotypic plasticity Background
Phlebotomus ariasi Tonnoir, 1921 is the predominant sand fly species in the Cevennes region [1] and one of the two proven vectors of leishmaniasis caused by Leish-mania infantum in the south of France, with Phleboto-mus perniciosusNewstead, 1911 [2]. The resting sites of P. ariasi are found in houses, animal sheds, caves and
holes in walls (“barbacanes”), near roads or in villages. This species is active during dusk and night, present during summer in temperate regions, abundant in peri-urban and rural environments and it often lives close to human and domestic animal populations [3]. This species is widely present in Western Mediterranean countries [4–6].
Currently, biology and ecology of P. ariasi remain poorly known. During the past 10 years, the risk of emergence or re-emergence of leishmaniasis has increased in France [7]. The current expansion of the distribution of this disease underlines the need to
* Correspondence:jorian.prudhomme@hotmail.fr †Equal contributors
1UMR MIVEGEC (IRD 224 - CNRS 5290 - Université de Montpellier), 911
avenue Agropolis, Montpellier F34394, France
Full list of author information is available at the end of the article
© The Author(s). 2016 Open Access This article is distributed under the terms of the Creative Commons Attribution 4.0 International License (http://creativecommons.org/licenses/by/4.0/), which permits unrestricted use, distribution, and reproduction in any medium, provided you give appropriate credit to the original author(s) and the source, provide a link to the Creative Commons license, and indicate if changes were made. The Creative Commons Public Domain Dedication waiver (http://creativecommons.org/publicdomain/zero/1.0/) applies to the data made available in this article, unless otherwise stated.
increase knowledge on this vector. However, only few studies have been performed to understand the popula-tion structure of this species and they were based on the analysis of cuticular hydrocarbons [8], isoenzymes [9], random amplified polymorphic DNA [10], sequences of the mitochondrial cytochrome b gene [5] and microsat-ellite markers [11]. Until now, no study using a geomet-ric morphometrics approach has been done to investigate phenotypic variations of P. ariasi in France. Significant morphometric wing shape variations were found in other sand fly species within populations ori-ginating from various Mediterranean regions, forming clusters or latitudinal clines in other species, such as P. papatasi [12, 13] and P. sergenti [14, 15]. These studies highlighted the existence of local phenotypic variations linked to environmental factors.
The main goals of this work were to investigate phenotypic variations of P. ariasi populations collected at a local scale in a region characterized by climatic and environmental fluctuations, and to determine if slope and altitude could affect sand fly phenotypes.
Methods Study area
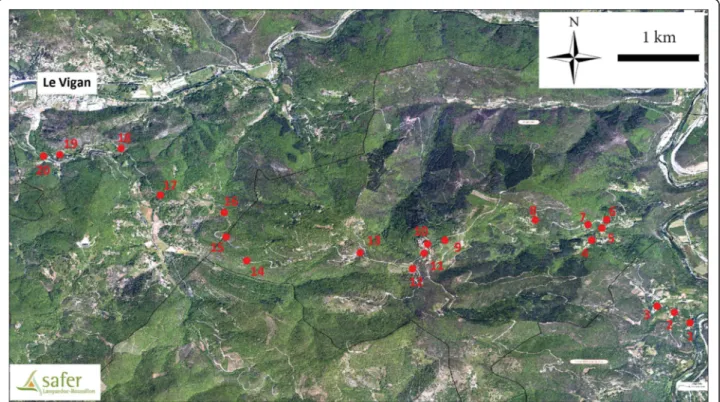
The field study was performed in the south of France, on the hill“le massif de l’Oiselette” located between two valleys: “Hérault” (Ganges, Hérault) and “Arre” (Le Vigan, Gard). Sand flies were collected along a 14 km
transect between Saint Julien de la Nef and le Vigan, including Roquedur-le-Haut (at 601 m above sea level) (Fig. 1). Twenty stations were selected along this tran-sect (Table 1 and Fig. 1). This region is subject to the Mediterranean sub-humid climate [16] and character-ized by the presence of “Garrigue” species such as Quercus ilexand Quercus pubescens.
This geographical area is known to be an endemic area for human and canine leishmaniasis caused by L. infantum [1]. Various domestic animals that are potential hosts for sand flies were present throughout the transect, such as chicken, sheep, ducks, geese, horses, rabbits, cats and dogs. Furthermore, some stations were located in semi-rural areas and thus various wild animals could be also hosts for sand flies [17].
To test the effect of environmental factors on the sand fly wing size and shape, the stations were organized according to the slope and altitude. Therefore, sta-tions were grouped into two slope groups: Southeast (SE) and Northwest (NW), and five altitudinal groups: 0 (100–200 m), 1 (200–300 m), 2 (300–400 m), 3 (400–500 m), 4 (> 500 m) (Table 2).
Sand fly collection and identification
Sand fly collections were performed monthly between May and November 2011 with CDC miniature light traps (John W. Hock Co. FL, USA) and flight intercep-tion traps (20 × 20 cm white paper cover with castor oil)
[18]. Along this transect, 20 stations were selected. In 14 sampling sites (Table 1), one or two light traps were set up for two nights (inside and/or outside of houses, animal barns, etc.), operating between 18:00 pm and 08:00 am. A total of 105 light traps were set during 210 nights of trapping. In 17 stations (Table 1), a total of 3,589 sticky traps were used and a mean of 189 sticky traps by station were placed in various biotopes, inside and around human dwelling and animal housing, close to the vegetation and crevices in the walls. The sticky traps were settled up in the sampling sites for 2 con-secutive days.
At the end of the sampling period, collected specimens were transferred individually into 1.5 ml Eppendorf tubes with 96% ethanol and labeled accordingly. Prior to mounting, heads, genitalia and wings of the sand flies were removed. The heads and genitalia were cleared in Marc-André solution (chloral hydrate/acetic acid) and mounted in chloral gum [3]. Specimen identification was individually verified based on the morphology of the pharynges and/or the male genitalia or female sperma-thecae, using the keys of Abonnenc [3], Lewis [6] and Killick-Kendrick et al. [19]. From the identifications, we selected the wings of the P. ariasi specimens, which were in the majority of our sample.
Wing preparation
A total of 374 specimens of P. ariasi were used for the geometric morphometrics analysis (186 males and 188 females) (Table 2). Rohlf et al. [20] suggest using only one side for the pair of organs or limbs to avoid asymmetry bias between the two sides. In this study, only right wings of specimens were used. They were stained using the method previously described in Prudhomme et al. [13] and then, mounted in Euparal on labeled slides. The wing slides were photographed using a Leica Z16 APOA stereoscopic zoom dissec-tion microscope with DFC 425 digital camera system, digitized, and archived.
Morphometric analysis
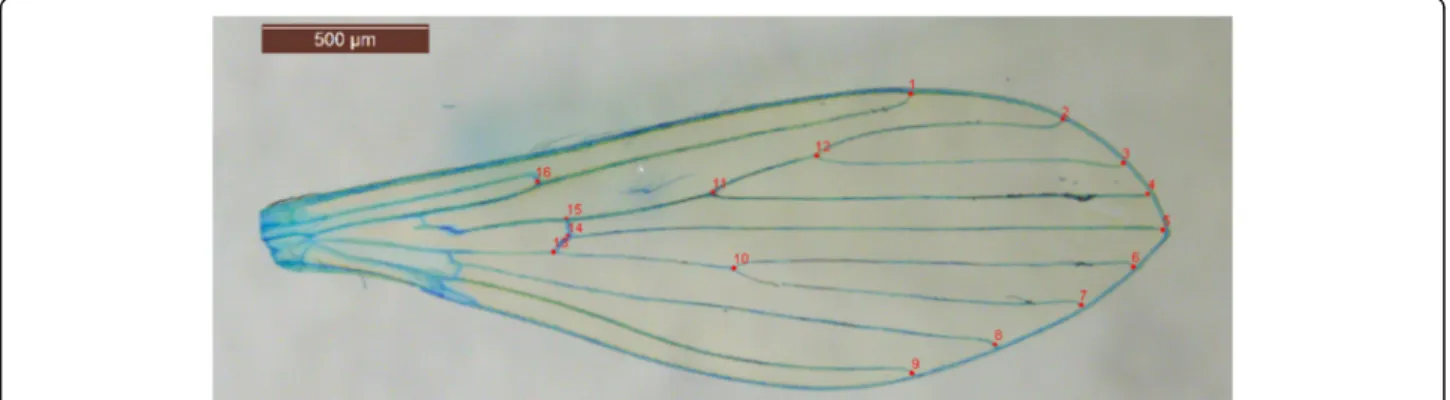
Pictures were first entered into tps-Util 1.60 [21]. Then, 16 landmarks were used for the analysis following the method of Rohlf et al. [20] with tpsDIG2 2.18 software [22] (Fig. 2). Landmarks are located at the intersections of wing veins with the wing margin and at the intersec-tions of cross veins with major veins (Fig. 2). The morphometric analyses as well as graphical outputs were performed using various modules of the CLIC package [23]. The centroid sizes were analyzed as a size estimator using a nonparametric Wilcoxon-Mann-Whitney test or Kruskal-Wallis test followed by a post-hoc test using Mann-Whitney tests with Bonferroni correction, using the statistical package R, version 3.1.2 [24]. Centroid size is the square root of the sum of squared distances of a set of landmarks from their centroid, i.e. the square root of the sum of the variances of the landmarks about that centroid in x- and y- directions [25]. The landmark configurations were scaled, translated, and rotated against the consensus configuration by the GLS Procrus-tes superimposition method [25–28] in order to produce shape variables (partial warps, PW). The principal components (based on the partial warps) [25] were used to compare population samples. To assess the degree of similarity between populations, pairwise Mahalanobis distances between populations were calculated using CLIC software [23] and tested by nonparametric permu-tation tests with 1,000 iterations each. These distances were also used to perform a simple reclassification test for each individual. The percentage of correctly assigned individuals to the corresponding group was assessed. Finally, residual allometry (contribution of size to wing shape) was estimated by multivariate regression of PW on size.
Results
Sexual dimorphism
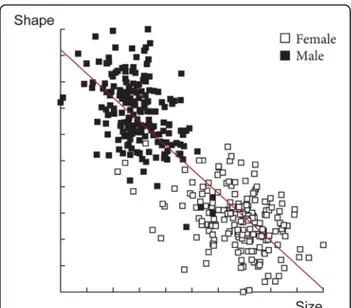
The wing shape showed statistically significant differ-ences between males and females (Fig. 3). Mahalanobis distances were significantly different between both sexes
Table 1 Sampling stations in the study area
Station number Coordinates Altitude (m) Biotope Traps North East ST01 43.96548 3.686828 175 Hamlet CDC + ST ST02 43.96663 3.685075 228 Hamlet ST ST03 43.96733 3.683149 244 Hamlet CDC + ST ST04 43.97462 3.675871 321 Hamlet/Hutch CDC + ST ST05 43.97595 3.677038 322 Rural ST ST06 43.97687 3.677551 341 Kennel CDC + ST ST07 43.97632 3.675457 354 Hamlet CDC + ST ST08 43.97683 3.669611 443 Hamlet ST ST09 43.9746 3.659549 586 Poultry CDC ST10 43.97416 3.657616 606 Poultry CDC ST11 43.97317 3.657214 603 Hamlet CDC + ST ST12 43.97144 3.655944 573 Rural ST ST13 43.97321 3.650088 539 Rural CDC + ST ST14 43.97235 3.637441 417 Rural ST ST15 43.97495 3.635153 397 Rural CDC + ST ST16 43.97765 3.634949 362 Rural ST ST17 43.97961 3.627845 343 Rural CDC + ST ST18 43.98478 3.623463 282 Rural CDC + ST ST19 43.98409 3.616661 255 Hamlet CDC + ST ST20 43.98392 3.614822 245 Hamlet/Sheep barn CDC + ST
(Adjusted P-value < 0.0001). Moreover, simple reclassifi-cation scores to the sexes were equal to 96% for males and 93% for females, supporting the observed differenti-ation between the two groups. Centroid sizes were used as a measure of the overall wing size differences among
populations. The wing size linked to the gender was found to be significantly different (Kruskal-Wallis test : χ2= 253.4024, df = 1, P < 0.0001), with females displaying larger wings than males (Fig. 4). The contribution of size to wing shape differentiation was 72% (Fig. 5).
Table 2 Number of Phlebotomus ariasi wings used by station for the geometric morphometric analysis
Station Slope Altitude groups
Wing number by month
May June July August September Total ♂ ♀ ♂ ♀ ♂ ♀ ♂ ♀ ♂ ♀ ♂ ♀ ST01 SE 0a 0 0 0 0 0 0 0 0 0 0 0 0 ST02 SE 0 0 0 0 0 0 0 0 0 0 0 0 0 ST03 SE 1b 0 0 4 4 2 6 0 0 0 0 6 10 ST04 SE 2c 0 0 1 14 6 0 0 0 0 0 7 14 ST05 SE 2 0 0 8 0 0 0 0 0 0 0 8 0 ST06 SE 2 0 0 6 14 4 16 8 0 0 1 18 31 ST07 SE 3d 0 0 0 0 0 0 0 0 0 0 0 0 ST08 SE 4e 0 0 0 0 0 0 0 0 0 0 0 0 ST09 SE 4 0 0 9 9 2 5 0 0 0 0 11 14 ST10 SE 4 0 0 0 0 0 2 0 1 0 0 0 3 ST11 NW 4 1 0 9 23 3 19 5 2 3 0 21 44 ST12 NW 4 4 0 6 3 0 0 0 0 0 0 10 3 ST13 NW 4 0 0 7 0 0 1 1 1 4 1 12 3 ST14 NW 3 3 0 12 0 2 0 0 0 2 0 19 0 ST15 NW 2 0 0 5 0 2 0 1 0 0 0 8 0 ST16 NW 2 1 0 12 0 0 0 0 0 0 0 13 0 ST17 NW 2 0 0 0 2 0 4 0 0 0 0 0 6 ST18 NW 1 0 0 8 4 5 9 2 0 1 0 16 13 ST19 NW 1 0 0 0 4 8 4 0 0 0 0 8 8 ST20 NW 1 0 0 27 32 2 7 0 0 0 0 29 39 Total 9 0 114 109 36 73 17 4 10 2 186 188
Abbreviations: SE southeast, NW northwest, ♂ male, ♀ female
a 100–200 m altitude b 200–300 m altitude c 300–400 m altitude d400–500 m altitude e > 500 m altitude
Since a phenotypic difference between males and fe-males was observed, the subsequent analyses were per-formed separately for each sex.
Differentiation by month
Mahalanobis distances, used to investigate wing shape variations, were significantly different between the months; between June-July for females (Ajusted P-value < 0.0001) and between June-July and July-August for males (Ajusted P-value < 0.05 after Bonferroni correc-tion; eight components, 85.53% of total shape variance) (Fig. 6). For females, it was not possible to test shape differentiation for the other months due to the small number of specimens (Table 2). Indeed, for the discrim-inant analyses, the sampling size is a limiting factor; the low number of principal components does not allow explaining the variance of the dataset. Moreover, simple reclassification scores to the month groups were on average equal to 73.6% for males (58–88%) and 81% for females (80–82%), supporting the differentiation observed between samples.
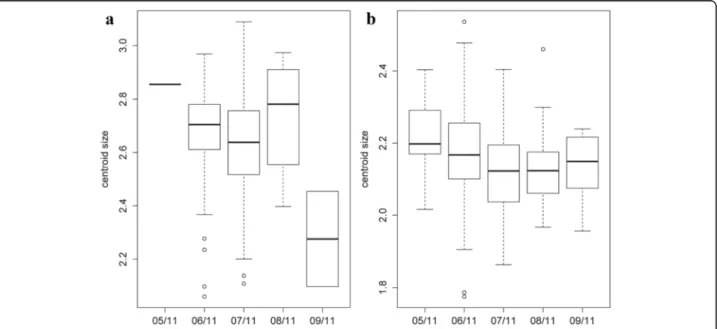
Concerning wing size, a Kruskal-Wallis test re-vealed a significant effect of month on the centroid size (χ2
= 11.6239, df = 4, P = 0.02038) for females. The post-hoc test showed significant differences
Fig. 3 Distribution of individuals along the first discriminant factor (DF1) of shape analysis by gender
Fig. 4 Mean, standard deviation and error of centroid wing sizes for each sex
Fig. 5 Regression of first discriminant factor on centroid size. Vertical axis: first discriminant factor, representing 100% of the total discrimination; Horizontal axis: centroid size of the wing. The analysis was based on the partial warps. Regression line is shown
Fig. 6 Distribution of the individuals along the discriminant factors of shape analysis in June and July. a Distribution of the female individuals along the discriminant factor. b Distribution of the male individuals along the first two discriminant factors. The analysis was based on the partial warps. Abbreviations: CV1, discriminant factor 1; CV2, discriminant factor 2
between June and July (P = 0.03741), between June and September (P = 0.02588) and between July and September (P = 0.03678) (Fig. 7a). For males, no size difference between months was ascertained (χ2
= 8.5591, df = 4, P = 0.07312) (Fig. 7b). The contribution of size to wing shape differentiation was 0% for females and for males 43% and 2% (Discriminant factors 1 and 2, respectively) (Fig. 8).
These results showed a strong phenotypic structuring between months, in particular between June and July for both sexes. Since a phenotypic difference between these two last months was observed, the following analyses performed to determine the possible effects of slope, altitude and station were realized for females and males in June and July separately. It was not possible to test for the other months due to a too small number of speci-mens (Table 2).
Differentiation by slope
As detailed above to determine the possible effect of slope on P. ariasi phenotype, we performed analysis on wings considering each sex and the two months, June and July, separately (see Table 2).
Mahalanobis distances to study wing shape were significantly different between the slopes (Ajusted P-value < 0.01) only for females in June (Fig. 9). More-over, simple reclassification scores to the slope groups were on average equal to 95% (80–90%), supporting the observed differentiation between samples. However, no significant difference was observed between the slopes for the females in July (Ajusted P-value > 0.05) and for the males for any month (Ajusted P-values > 0.05; 13 compo-nents, 96.5% of total shape variance) (data not shown).
Furthermore, the Kruskal-Wallis test to study wing size revealed also no significant effect of slopes in June and July (χ2
= 1.0064, df = 1, P = 0.3158; χ2= 0.4636, df= 1, P = 0.4959, respectively) for females and also for males (χ2
= 0.4915, df = 1, P = 0.4833; χ2= 0.6771, df= 1, P = 0.4106) (data not shown).
The contribution of size to wing shape differentiation was 0% for females for both months and 0 and 32% for males in June and July, respectively (Fig. 10).
Differentiation by altitude
The effect of altitude on P. ariasi phenotype was tested for females and males in June and July separately (see Table 2). In June, Mahalanobis distances used to study wing shape were significantly different between the altitudinal groups 1 and 2 for females (Ajusted P-value < 0.01667) and between group 3 and all the other groups for males (Ajusted P-value < 0.00833, 11 components, 93.2% of total shape variance) (Fig. 11). Moreover, simple reclassification scores to the altitudinal groups were on average equal to 73% (65–80%) for females and 53% (43–75%) for males, supporting the observed differ-entiation between samples. However, in July, no signifi-cant difference was observed between the groups for females and males (Ajusted P-value > 0.01667, 19 com-ponents, 99.2% of total shape variance and Ajusted P-value > 0.01667, 4 components, 71.3% of total shape vari-ance, respectively) (data not shown). To realize the ana-lyses with males in July, the group 4 had to be removed because of a low number of specimens (n = 2).
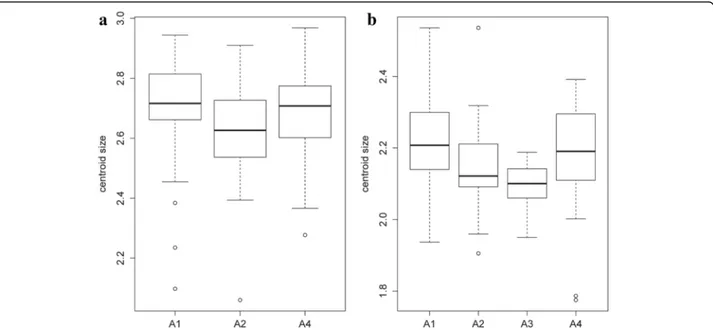
Concerning wing size, in June, a significant effect of altitude on centroid size was observed for females (χ2
= 7.0282, df = 2, P = 0.0298), the post-hoc test
showed significant differences between groups 1 and 2 (P = 0.022). For males, the difference was strongly significant between groups 1 and 3 (χ2
= 12.4331, df = 3, P = 0.006) with a P-value of 0.0076 for the post-hoc test (Fig. 12). Conversely, no significant effect of alti-tude was found on the centroid sizes in July for both sexes (χ2
= 4.9144, df = 2, P = 0.0857; χ2= 0.4848, df = 3, P = 0.9222, for females and males respectively) (data not shown).
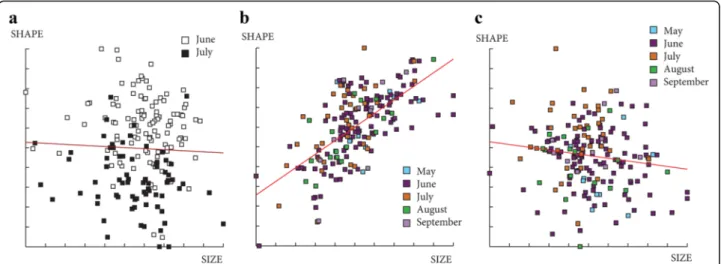
The contribution of size to wing shape differentiation was 7 and 0% for females and 48 and 1% for males in June (Fig. 13) and 37 and 14% for females and 36 and 0% for males in July (data not shown).
Phenotypic differentiation by station
In order to observe a possible effect of stations on wing phenotype, several analyses were realized by sex in June
and July. Due to low number of individuals in certain stations, we performed a serial of discriminant analyses considering first all the stations and then excluding stations with a low number of individuals in order to in-crease the number of principal components and thus the variance explained (Table 3).
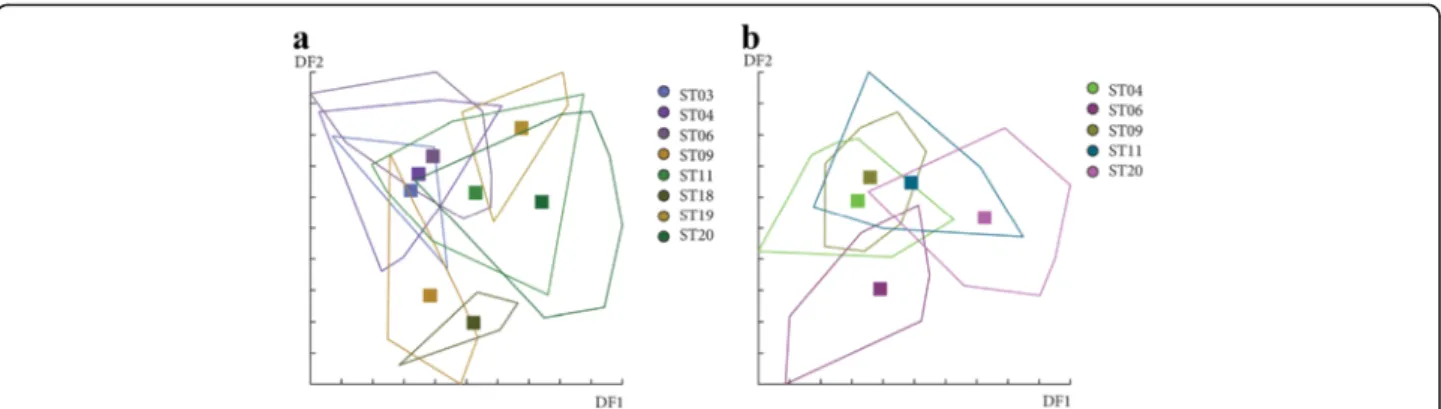
For females in June, Mahalonobis distances were not significantly different between stations for the first ana-lysis based on the 3 principal components included (data not shown), but significant between ST19 and ST20 for the second analysis based on 8 principal components (Table 4 and Fig. 14). In July, even if Canonical variate analysis (CVA) showed some grouping by station (data not shown), Mahalonobis distances were not signifi-cantly different between stations for all analyses (Table 4). For males, no significant difference was observed between stations for June and July (data not shown). The results of the shape analyses and the contribution of size to wing shape differentiation are synthesized in Table 4.
Kruskal-Wallis tests used to study wing size re-vealed no significant effect of station on centroid size in June (χ2
= 12.4043, df = 9, P = 0.1915; χ2= 18.3754, df= 11, P = 0.07327) and in July (χ2= 12.5229, df = 8, P= 0.1294; χ2= 11.6, df = 9, P = 0.2368) for females and males, respectively.
Discussion Sexual dimorphism
Our results showed significant differences in wing shape and size between males and females; females have larger wings. Sexual dimorphism is widely observed in many insects such as Mansonia [29] and Aedes mosquitoes [30], Anopheles, Culex and Ochlerotatus mosquitoes [31], Drosophila melanogaster [32] and D. subobscura
Fig. 8 Regression of the discriminant factors on centroid size by months. a Regression of the first discriminant factor for females in June and July. b, c Regression of the two first discriminant factors for males by month. Horizontal axis: centroid size of the wing; Vertical axis (a): discriminant factor 1, representing 100% of the total discrimination; Vertical axis (b and c): discriminant factors 1 and 2, representing 24% and 17% of the total discrimination, respectively. This regression was based on the partial warps. Regression line is shown. Squares indicate individual sand flies
Fig. 9 Distribution of female individuals along the first discriminant factor of shape analysis according to slopes. This distribution was based on the partial warps in June. Abbreviations: SE, southeast slope; NW, northwest slope
[33]. Thin-plate spline deformation analyses showed that the deformation was mostly present on the medial part of the wings. The medial of the wings of flying insects is known to play an essential role in flying capability [34]. Because of blood meal necessity, the female sand flies
might need a greater flying capacity compared to males. This could explain the wing differences between them. A previous study based on a mark-release-recapture method showed that P. ariasi females present a disper-sion ability of more than 1 km [35]. It would be
Fig. 10 Regression of first discriminant factor of shape analysis on centroid size from females (a, b) and males (c, d). Horizontal axis: centroid size of the wing; Vertical axis: first discriminant factor, representing 100% of the total discrimination. This regression was based on the partial warps in June (a, c) and July (b, d). Regression line is shown. Signs indicate each individual. Abbreviations: SE, southeast slope; NW, northwest slope
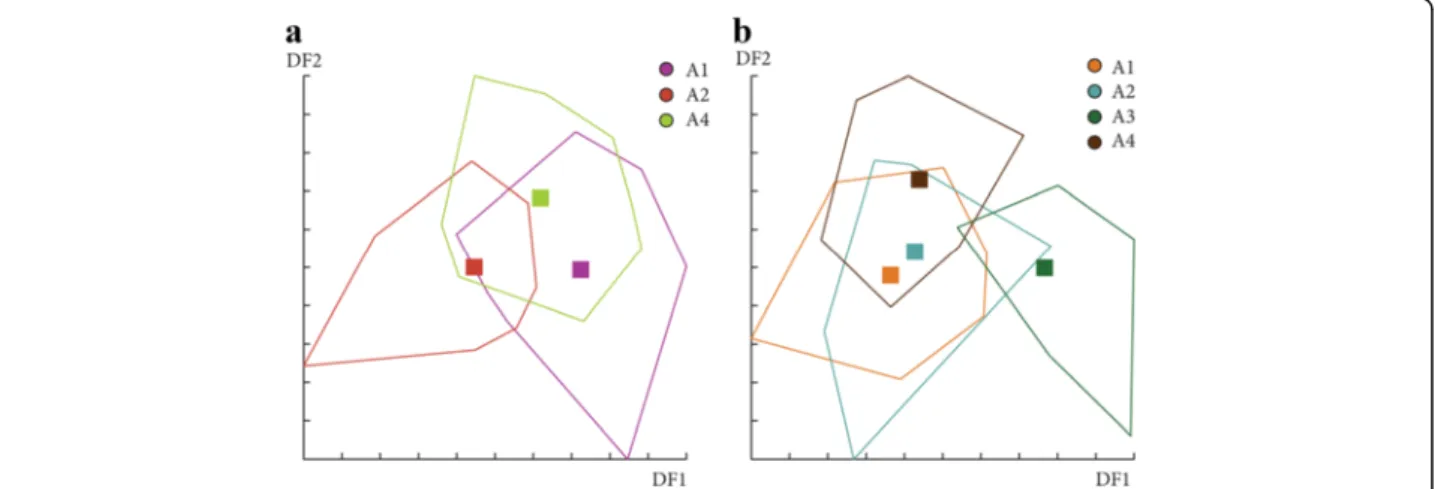
Fig. 11 Distribution of the individuals along the first two discriminant factors of shape analysis by altitude groups for females (a) and males (b). This distribution was based on the partial warps in June. Horizontal axis: discriminant factor 1; Vertical axis: discriminant factor 2. Altitude groups: 1 (200–300 m), 2 (300–400 m), 3 (400–500 m), 4 (> 500)
Fig. 12 Mean, standard deviation, and error of centroid wing sizes by altitude groups in June for females (a) and males (b). Altitude groups: 1 (200–300 m), 2 (300–400 m), 3 (400–500 m), 4 (> 500 m)
Fig. 13 Regression of first discriminant factor on centroid size by altitude groups in June for females (a, b) and males, (c, d). Horizontal axis: centroid size of the wing. Vertical axis: discriminant factor 1 (a, c) or discriminant factor 2 (b, d). The regression was based on the partial warps. Regression line is shown. Squares indicate individual sand flies. Altitude groups: 1 (200–300 m), 2 (300–400 m), 3 (400–500 m), 4 (> 500)
interesting to measure the dispersion capacity of males in order to test this hypothesis.
Wing phenotype differentiation by month
We observed a difference of wing shape between June and July for both sexes and a difference of size only for females (smaller in July). It was not possible to make any
conclusion for the other months (May, August and September) due to the low number of individuals captured. These differences observed between June and July may be due to environmental variations as it was observed in previous study [36]. The individuals cap-tured in June and July have certainly emerged at the end of May and June, respectively. Major temperature and relative humidity differences were observed between these 2 months. Moreover, the temperature fluctuations between night and day are greater in May than in June or July. Even if the exact conditions are not well known, the climatic parameters influence the entry into diapause and the exit and also the larvae development of insects [37]. Phlebotomus ariasi, as most of northern insect spe-cies, presents a period of diapause (at the forth-instar larval stage) in order to survive over the winter and postpone the reproduction until favorable conditions [38]. The climatic differences between months, at the end and/or at the beginning of the sand fly season may be responsible of differences in the development of the larvae before and/or after the diapause [39]. Indeed, the differences in larvae development could impact the dia-pausing stage and/or adult phenotype.
Environmental factors and phenotypic variation in June
The data analyses revealed shape and size differences by altitude for males and females in June suggesting differential environmental and climatic pressures according to altitude. Previous studies highlighted the impact of altitude and
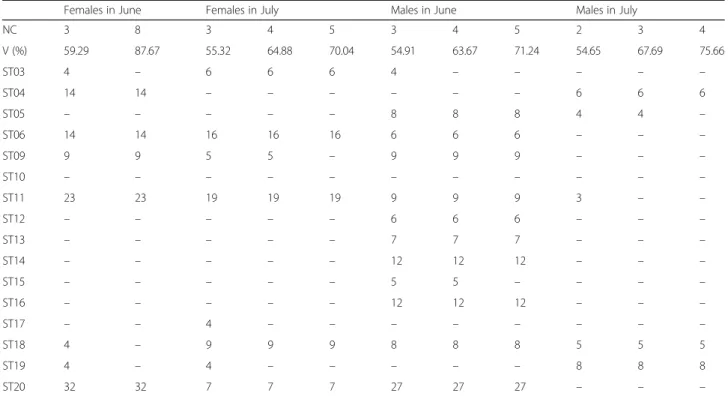
Table 3 Number of Phlebotomus ariasi wings used by station for the geometric morphometric analysis
Females in June Females in July Males in June Males in July
NC 3 8 3 4 5 3 4 5 2 3 4 V (%) 59.29 87.67 55.32 64.88 70.04 54.91 63.67 71.24 54.65 67.69 75.66 ST03 4 – 6 6 6 4 – – – – – ST04 14 14 – – – – – – 6 6 6 ST05 – – – – – 8 8 8 4 4 – ST06 14 14 16 16 16 6 6 6 – – – ST09 9 9 5 5 – 9 9 9 – – – ST10 – – – – – – – – – – – ST11 23 23 19 19 19 9 9 9 3 – – ST12 – – – – – 6 6 6 – – – ST13 – – – – – 7 7 7 – – – ST14 – – – – – 12 12 12 – – – ST15 – – – – – 5 5 – – – – ST16 – – – – – 12 12 12 – – – ST17 – – 4 – – – – – – – – ST18 4 – 9 9 9 8 8 8 5 5 5 ST19 4 – 4 – – – – – 8 8 8 ST20 32 32 7 7 7 27 27 27 – – –
Abbreviations: NC number of components included in the analysis, ST station, V percentage of shape variance explained by the components included in the analysis
Table 4 Synthesis of the Mahalonobis distances results
Analysis NC V (%) Ajusted P-value Allometrya(%) 1 2 Females in June 3 59.29 > 0.00179 26 1 8 87.67 < 0.00500b 25 22 Females in July 3 55.32 > 0.00179 38 13 4 64.88 > 0.00333 41 15 5 70.04 > 0.00500 33 23 Males in June 3 54.91 > 0.00076 48 1 4 63.67 > 0.00091 49 0 5 71.24 > 0.00111 48 1 Males in July 2 54.65 > 0.00500 36 0 3 67.69 > 0.00833 35 1 4 75.66 > 0.01667 26 8
Abbreviations: NC number of components included in the analysis, V percentage of shape variance explained by the components included in the analysis
a
Percentage of size contribution to wing shape differentiation for the first component (1) and the second one (2)
b
temperature (two correlated parameters) on sand fly biology [12, 40, 41]. The size of adults is largely influenced by temperature, with larger adults found at low temperatures and smaller adults at high temperatures [12]. It is known that larvae development is influenced by temperature con-ditions [12, 42]; a high temperature will produce a rapid de-velopment and thus small individuals. Assuming that wing size reflects the size of specimens, centroid size should pre-dict larger individuals at lower temperatures and thus at higher altitudes [43]. However, the size differences observed by altitudinal groups did not show significantly larger wings at higher altitudes. This correlation may not be observed in this study because of too small altitudinal differences and thus temperature fluctuations between sampling sites.
We also found a significant spatial differentiation in June for females by slope and station. The absence of spatial differentiation observed in males, conversely to females could be a consequence of stronger sex-specific selection pressures such as the host availability for blood meal in the sampled stations. The strong sexual di-morphism observed also support the existence of sex-specific selection pressures (see above). Nevertheless, the reasons of differential shape and size between sexes have not been well explored [44].
Conclusions
In conclusion, this study showed phenotypic variations among local populations of P. ariasi of different types: sexual dimorphism, shape and size variations between months (June and July in particular) and different wing phenotypes according to altitude for both sexes and by slope and station for females.
The degree of phenotypic variation observed in P. ariasi populations seems to reflect the local environ-mental fluctuations in terms of climatic but also biotic characteristics to which these populations are subjected. These data underline the plasticity and the capacity of adaptation of these insects even at a sympatric level.
These wing variations may have an effect on the biology of P. ariasi in terms of dispersion, fitness and transmission of pathogens such as Leishmania. Indeed, some effects were recently demonstrated for other insects such as relationships between wing shape and reproduct-ive mode of Lysiphlebus fabarum group (Hymenoptera) [45] or enhancement of flight performance by genetic manipulation of wing shape in Drosophila [46]. Further studies are necessary to investigate the impact of wing var-iations on sand fly biological and ecological traits.
Abbreviations
CDC:Communicable Disease Center miniature light trap; CVA: canonical variate analysis; NC: number of components included in the analysis; NW: northwest; SE: southeast; ST: sticky trap; V: percentage of shape variance explained by the components included in the analysis
Acknowledgments
We are particularly grateful to the EDENext PhDB group, Professor Rioux for the interesting and useful discussions and the habitants from the study area for their kindness and availability. We are grateful to Elisabetta Andermarcher for editing the English.
Funding
Mr. Lacoste (Inkerman foundation), IRD (Institut de Recherche pour le Développement) and CNRS provided financial support. This study was funded by EU grant FP7-261504 EDENext and is catalogued by the EDENext Steering Committee as EDENext457 (http://www.edenext.eu). The contents of this publication are the sole responsibility of the authors and do not ne-cessarily reflect the views of the European Commission.
Availability of data and material
The data supporting the conclusions of this article are included within the article.
Authors’ contributions
JP was the main investigator of the study, he was involved in sand fly capture and identification, wing preparation for geometric morphometrics, analysis and interpretation of data, drafting of the manuscript. CC and CT contributed to sand fly capture and identification, and wing preparation for geometric morphometrics. NR contributed to sand fly capture, dissection and identification. MH, and BV contributed to sand flies capture. JPD contributed to wing geometric morphometrics analysis. BA was involved in conception and design of the study, sand fly capture, interpretation of data and manuscript revising. DS and ALB were involved in conception and design of the study, sand fly capture, interpretation of data, critical revising of the manuscript and acquisition of funding. All authors read and approved the final manuscript.
Fig. 14 Distribution of the individuals along the first two discriminant factors of shape analysis by station. The analysis was based on the partial warps on female individuals in June with 3 (a) and 8 components (b). Horizontal axis: discriminant factor 1; Vertical axis: discriminant factor 2
Competing interests
The authors declare that they have no competing interests. Consent for publication
Not applicable.
Ethics approval and consent to participate Not applicable.
Author details
1UMR MIVEGEC (IRD 224 - CNRS 5290 - Université de Montpellier), 911
avenue Agropolis, Montpellier F34394, France.2UMR INTERTRYP (IRD - CIRAD
177), Centre IRD, Montpellier F34394, France.3Department of Biology,
Ecology Section, Faculty of Science, Hacettepe University, HU-ESRL-VERG Laboratories, Beytepe, Ankara 0680, Turkey.
Received: 28 June 2016 Accepted: 3 November 2016
References
1. Rioux JA, Killick-Kendrick R, Perieres J, Turner D, Lanotte G. Ecologie des Leishmanioses dans le Sud de la France. 13. Les sites de“flanc de coteau”, biotopes de transmission privilégiés de la Leishmaniose viscérale en Cévennes. Ann Parasitol. 1980;55(4):445–53.
2. Rioux JA, Carron S, Dereure J, Perieres J, Zeraia L, Franquet E, et al. Ecology of leishmaniasis in the South of France. 22. Reliability and
representativeness of 12 Phlebotomus ariasi, P. perniciosus and Sergentomyia minuta (Diptera: Psychodidae) sampling stations in Vallespir (eastern French Pyrenees region). Parasite. 2013;20:34.
3. Abonnenc E. Les phlébotomes de la région éthiopienne (Diptera, Psychodidae). Chambéry: Office de la Recherche Scientifique et Technique Outre-Mer; 1972.
4. Ready P. Leishmaniasis emergence in Europe. Euro Surveill. 2010;15(10): 19505.
5. Franco F, Morillas-Marquez F, Barón S, Morales-Yuste M, Gálvez R, Díaz-Sáez V, et al. Genetic structure of Phlebotomus (Larroussius) ariasi populations, the vector of Leishmania infantum in the western Mediterranean:
epidemiological implications. Int J Parasitol. 2010;40(11):1335–46. 6. Lewis D. A taxonomic review of the genus Phlebotomus (Diptera:
Psychodidae). Bull Br Mus. 1982;45(2):121–209.
7. Dedet J-P. Les leishmanioses en France métropolitaine. Bull Epidemiol Hebd (Paris). 2010; Suppl 9–12.
8. Kamhawi S, Molyneux D, Killick-Kendrick R, Milligan P, Phillips A, Wilkes T, Killick-Kendrick M. Two populations of Phlebotomus ariasi in the Cévennes focus of leishmaniasis in the south of France revealed by analysis of cuticular hydrocarbons. Med Vet Entomol. 1987;1(1):97–102. 9. Pesson B, Wallon M, Floer M, Kristensen A. Isoenzymatic studies of
Mediterranean populations of sandflies of the subgenus Larroussius. Parassitologia. 1991;33:471–6.
10. Martin-Sanchez J, Gramiccia M, Pesson B, Morillas-Marquez F. Genetic polymorphism in sympatric species of the genus Phlebotomus, with special reference to Phlebotomus perniciosus and Phlebotomus longicuspis (Diptera, Phlebotomidae). Parasite. 2000;7(4):247–54.
11. Mahamdallie S, Pesson B, Ready P. Multiple genetic divergences and population expansions of a Mediterranean sandfly, Phlebotomus ariasi, in Europe during the Pleistocene glacial cycles. Heredity (Edinb). 2010;106(5):714–26.
12. Aytekin A, Alten B, Caglar SS, Ozbel Y, Kaynas S, Simsek F, et al. Phenotypic variation among local populations of phlebotomine sand flies (Diptera: Psychodidae) in southern Turkey. J Vector Ecol. 2007;32(2):226–34. 13. Prudhomme J, Gunay F, Rahola N, Ouanaimi F, Guernaoui S, Boumezzough
A, et al. Wing size and shape variation of Phlebotomus papatasi (Diptera: Psychodidae) populations from the south and north slopes of the Atlas Mountains in Morocco. J Vector Ecol. 2012;37(1):137–47.
14. Dvorak V, Aytekin A, Alten B, Skarupova S, Votypka J, Volf P. A comparison of the intraspecific variability of Phlebotomus sergenti Parrot, 1917 (Diptera: Psychodidae). J Vector Ecol. 2006;31(2):229–38.
15. Dvorak V, Votypka J, Aytekin A, Alten B, Volf P. Intraspecific variability of natural populations of Phlebotomus sergenti, the main vector of Leishmania tropica. J Vector Ecol. 2011;36 Suppl 1:S49–57.
16. Daget P. Le bioclimat mediterraneen: analyse des formes climatiques par le système d’Emberger. Vegetation. 1977;34(2):87–103.
17. Guy M, Killick-Kendrick R, Gill G, Rioux JA, Bray RS. Ecology of leishmaniasis in the south of France. 19. Determination of the hosts of Phlebotomus ariasi Tonnoir, 1921 in the Cévennes by bloodmeal analyses. Ann Parasitol Hum Comp. 1984;59(5):449–58.
18. Alten B, Ozbel Y, Ergunay K, Kasap O, Cull B, Antoniou M, et al. Sampling strategies for phlebotomine sand flies (Diptera: Psychodidae) in Europe. Bull Entomol Res. 2015;1–15.
19. Killick-Kendrick R, Tang Y, Killick-Kendrick M, Sang D, Sirdar M, Ke L, et al. The identification of female sandflies of the subgenus Larroussius by the morphology of the spermathecal ducts. Parassitologia. 1991;33:335–47. 20. Rohlf FJ, Slice D. Extensions of the Procrustes method for the optimal
superimposition of landmarks. Syst Biol. 1990;39(1):40–59. 21. Rohlf FJ. tpsUtil, file utility program. version 1.60. Stony Brook, State
University of New York, Department of Ecology and Evolution; 2015. 22. Rohlf FJ. tpsDIG2 version 2.18. Stony Brook, State University of New York,
Department of Ecology and Evolution; 2015.
23. Dujardin JP. Geometric morphometrics. In: Tibayrenc M, editor. Contributions to medical Entomology, Encyclopedia of Infectious Diseases Modern Methodologies. Hoboken: Wiley and Sons, Inc; 2007. p. 435–47. 24. Team RC. R. A language and environment for statistical computing. Vienna,
the R Foundation for Statistical Computing; 2012.
25. Bookstein FL. Morphometric tools for landmark data. Cambridge: Cambridge University Press; 1991.
26. Rohlf F. Shape statistics: procrustes superimpositions and tangent spaces. J Classif. 1999;16:197–223.
27. Rohlf F. Relative warp analysis and an example of its application to mosquito. In: Marcus LF, Bello E, Garcia-Valdecasas A, editors. Contributions to Morphometrics. Madrid, Spain: Museo Nacional de Ciencias Naturales; 1993. p. 8–131.
28. Alibert P, Moureau B, Dommergues J-L, David B. Differentiation at a microgeographical scale within two species of ground beetle, Carabus auronitens and Cepaea nemoralis (Coleoptera, Carabidae): a geometrical approach. Zool Scr. 2001;30(4):299–311.
29. Ruangsittichai J, Apiwathnasorn C, Dujardin JP. Interspecific and sexual shape variation in the filariasis vectors Mansonia dives and Mansonia bonneae. Infect Genet Evol. 2011;11:2089–94.
30. Wormington JD, Juliano SA. Sexually dimorphic body size and development time plasticity in Aedes mosquitoes (Diptera: Culicidae). Evol Ecol Res. 2014;16:223–34.
31. Virginio F, Vidal P, Suesdek L. Wing sexual dimorphism of pathogen-vector culicids. Parasit Vectors. 2015;8:1.
32. Bitner-Mathá B, Klaczko L. Plasticity of Drosophila melanogaster wing morphology: effects of sex, temperature and density. Genetica. 1999;105(2):203–10.
33. Gilchrist GW, Huey RB. Plastic and genetic variation in wing loading as a function of temperature within and among parallel clines in Drosophila subobscura. Integr Comp Biol. 2004;44:461–70.
34. Johansson F, Söderquist M, Bokma F. Insect wing shape evolution: independent effects of migratory and mate guarding flight on dragonfly wings. Biol J Linn Soc Lond. 2009;97(2):362–72.
35. Killick-Kendrick R, Rioux JA, Bailly M, Guy M, Wilkes T, Guy F, et al. Ecology of leishmaniasis in the south of France. 20. Dispersal of Phlebotomus ariasi Tonnoir, 1921 as a factor in the spread of visceral leishmaniasis in the Cévennes. AnnParasitol Hum Comp. 1984;59(6):555–72.
36. Prudhomme J, Rahola N, Toty C, Cassan C, Roiz D, Vergnes B, et al. Ecology and spatiotemporal dynamics of sandflies in the Mediterranean Languedoc region (Roquedur area, Gard, France). Parasit Vectors. 2015;8(1):1–14. 37. Lawyer P, Young D. Diapause and quiescence in Lutzomyia diabolica
(Diptera: Psychodidae). Parassitologia. 1991;33:353–60.
38. Volf P, Volfova V. Establishment and maintenance of sand fly colonies. J Vector Ecol. 2011;36 Suppl 1:S1–9.
39. Ready P, Croset H. Diapause and laboratory breeding of Phlebotomus perniciosus Newstead and Phlebotomus ariasi Tonnoir (Diptera: Psychodidae) from southern France. Bull Entomol Res. 1980;70(3):511–23.
40. Belen A, Alten B, Aytekin A. Altitudinal variation in morphometric and molecular characteristics of Phlebotomus papatasi populations. Med Vet Entomol. 2004;18(4):343–50.
41. Dujardin JP, Le Pont F. Geographic variation of metric properties within the neotropical sandflies. Infect Genet Evol. 2004;4:353–9.
42. Aytekin S, Aytekin A, Alten B. Effect of different larval rearing temperatures on the productivity (Ro) and morphology of the malaria vector Anopheles superpictus Grassi (Diptera: Culicidae) using geometric morphometrics. J Vector Ecol. 2009;34(1):32–42.
43. Dujardin J-P, Pont F, Baylac M. Geographical versus interspecific
differentiation of sand flies (Diptera: Psychodidae): a landmark data analysis. Bull Entomol Res. 2003;93(1):87–90.
44. Chown S, Gaston K. Body size variation in insects: a macroecological perspective. Biol Rev Camb Philos Soc. 2010;85(1):139–69.
45. Petrović A, Mitrović M, Ivanović A, Žikić V, Kavallieratos NG, Starý P, et al. Genetic and morphological variation in sexual and asexual parasitoids of the genus Lysiphlebus - an apparent link between wing shape and reproductive mode. BMC Evol Biol. 2015;15(5):1–12.
46. Ray RP, Nakata T, Henningsson P, Bomphrey RJ. Enhanced flight performance by genetic manipulation of wing shape in Drosophila. Nat Commun. 2016;7:1–8.
• We accept pre-submission inquiries
• Our selector tool helps you to find the most relevant journal • We provide round the clock customer support
• Convenient online submission • Thorough peer review
• Inclusion in PubMed and all major indexing services • Maximum visibility for your research
Submit your manuscript at www.biomedcentral.com/submit