Publisher’s version / Version de l'éditeur:
Vous avez des questions? Nous pouvons vous aider. Pour communiquer directement avec un auteur, consultez la
première page de la revue dans laquelle son article a été publié afin de trouver ses coordonnées. Si vous n’arrivez pas à les repérer, communiquez avec nous à PublicationsArchive-ArchivesPublications@nrc-cnrc.gc.ca.
Questions? Contact the NRC Publications Archive team at
PublicationsArchive-ArchivesPublications@nrc-cnrc.gc.ca. If you wish to email the authors directly, please see the first page of the publication for their contact information.
https://publications-cnrc.canada.ca/fra/droits
L’accès à ce site Web et l’utilisation de son contenu sont assujettis aux conditions présentées dans le site LISEZ CES CONDITIONS ATTENTIVEMENT AVANT D’UTILISER CE SITE WEB.
Internal Report (National Research Council of Canada. Division of Building
Research), 1967-09-01
READ THESE TERMS AND CONDITIONS CAREFULLY BEFORE USING THIS WEBSITE.
https://nrc-publications.canada.ca/eng/copyright
NRC Publications Archive Record / Notice des Archives des publications du CNRC :
https://nrc-publications.canada.ca/eng/view/object/?id=ef59ab21-7faa-4f06-bf5d-ab4a5a86aa80 https://publications-cnrc.canada.ca/fra/voir/objet/?id=ef59ab21-7faa-4f06-bf5d-ab4a5a86aa80
For the publisher’s version, please access the DOI link below./ Pour consulter la version de l’éditeur, utilisez le lien DOI ci-dessous.
https://doi.org/10.4224/20337839
Access and use of this website and the material on it are subject to the Terms and Conditions set forth at
Comparison of laboratory and outdoor curing of cement: lime mortars
COMPARISON OF LABORATORY AND OUTDOOR CURING OF CEMENT-LIME MORTARS by J.
1.
DavisonANALYIED
Internal Report No . .?J1!f7351
of theDivision of Building Re search
OTTAWA September 1967
built during the past century are still in good condition.
This excellent durability is contradicted by the early deterioration of the se mortars in laboratory freeze -thaw te st s , This may
be due to inadequate curing prior to testing, and/or severe conditions of the te st.
The relation between laboratory and outdoor curing of cement-lime mortars has been studied at the Atlantic Regional Station of the Division in Halifax where weather conditions include frequent wind-driven rains and a high incidence of freeze -thaw cycling during the winter months. The re sults of observations on 2 -in. cube s of a variety of cement-lime mortar is reported.
The author is a chemist and a Research Officer with the Division, engaged in studies of masonry performance in the Atlantic Provinces.
Ottawa
September 1967
R. F. Legget Director
CEMENT-LIME MORTARS by
J.
1.
'DavisonThe use of lime as a construction material is thought to have originated during the Stone Age (1). The fir st recorded use of lime in masonry mortars was in Egyptian p yr a mi d s
between 4000 and 2000 B. C. From that ti rne until the beginning of the pre sent century Ii rne was the basic cementitious rnat e r i a l in mortar.
Since the introduction of portland ce merit during the early part of the century, c e rne nte Ii.rn.e rno rta r s containing varying proportions of c e rrie nt and l.i me have been extensively used. The se rno r ta r s c o mb ine two materials, each with
de sirable propertie s to contribute to the end product. Cement adds strength, particularly early strength, to the
slow-setting lime rno rta r s . This is essential in an age when speed is of the essence and construction is carried on year -round in all kinds of weather, rnu ch of which is unfavourable for
the rapid carbonation of lime. The Ii.rne improve s the workability and water retentivity of the c e rrie nt rno r ta r s , propertie s
essential in ensuring maxi mum bond with the masonry units. The use of standards and their ac c ornpan ying rnet hod s of test by the construction industry has been widely accepted in the twentieth century, facilitating the use of countle s s new rnat e r i.a l s and the more intelligent use of the old one s , Te sts currently used in North America for rna s on ry rno r ta r s are carried out in the laboratory using the rno rta r rnat e r ia l s pro-posed for use in a particular job. Since laboratory procedure s do not always re s e rnb Ie field practice, the re sults of the te sts rriay not apply to field conditions. Thus, the fact that the l irne rrio rta r of rnariy old building s is highly durable is contra-dicted by laboratory te sts in which such mo r ta r breaks down readily during early stages of freeze-thaw cycling. There are frequent sugge stions that a rno r e realistic (Ie s s severe)
durability te st is required. It s e e rn s rno r e logical to i mp r o ve the laboratory curing procedure because current methods of te st do not appear to pe r rni.t sufficient carbonation to take
This has been suggested by other workers. For example, in a 1947 study of masonry deterioration, Foran, Vaughan and Reid (2) noted the lack of a satisfactory method for curing
cement-lime mortars, and briefly studied artificial carbonation in a C02 atmosphere.
Studies by the Division of Building Research using
small-panel masonry units, in which leakage and bond strength tests were conducted on small brick panels containing a number of cement-lime mortars, have been criticized on the basis that curing periods were not long enough to permit adequate carbon-ation of the lime used in the mortar.
As a result of these and other observations, a program was de signed to compare the re sults of current laboratory procedures with outdoor curing for a number of cement-lime mortar s.
CURRENT TEST METHODS
At present, ASTM Specification C270, Mortar for Unit Masonry, lists the following five cement-lime mortar combin-ations (volume proportions):
Type M Type S Type N Type 0 Type K I· .!.··4·3 1· 1.· 4 1.·2· 2 1:1:6 1:2:9 1:3:12
ce ment: lime: sand ce rne ntj Ii.rne ; sand c.ernerit rli rne ; sand cement:lime: sand c e rnerrtt Iirne ; sand
The Specification include s a curing procedure for 2 in. cubes to be used in compressive strength tests at 28 days. It require s cube s of Type M and S (high-cement) mortar s to be cured for 7 days in a moist cabinet and 21 days in water. Type Nand
°
mortar s are stored in the moist cabinet for 28 days and Type K (high-lime) mortar cube s are cured in air. Cubes are then tested in the condition achieved during curing (i. e. high-cement mortar s are te sted wet; cement -Li rne mortars, moist; and high-lime mortars, air dry).The curing of high-cement and cement-lime mortars In water or a moist cabinet ensures proper hydration of the
cement. The re sulting strength of the cement should be reasonably equivalent with 'Chat of a masonry wall in the field. These mortars in effect receive an "accelerated" curing, as the mortars in masonry walls do not always remain wet or moist during early stages of their curing. Lime mortars stored in air cure as carbon dioxide from the air combines with the lime to form calcium carbonate. It is a slow reaction and there is little doubt that the carbonation occu ..rr ing in 28 days is only a minor fraction of the end product in masonry walls.
Current curing procedure s for cement -Li me mortar s do not appear to facilitate carbonation of the lime to the same extent that they accomplish hydration of the cement.
There are several ways in which curing procedures could be improved. The curing period could be extended beyond 28 days, but the length of time spent testing is then prohibitive for the construction industry. A more practical method, somewhat analogous to the use of water in hydrating cement mortars, would be to store the cubes in a CO 2
atmosphere. Before considering improvements on current procedures, however, it is necessary to establish that there is a greater discrepancy between the end products of laboratory and field curing for lime mortars than there is for cement mortars.
Staley (3) studied compressive strength values for 2-by 4-in. cylinders of cement-lime mortars at 28 days and 6 months, and found that the ratio of strengths (6 months to 28 days) increased as the percentage of lime in the mortar was increased. In a later discus sion of Staley's work,
Voss (4) suggested that 6-month values are significant because occupancy of a new building, involving full loads of design, is usually delayed by at least 6 months from the time the masonry is completed. He summarized Staley's re sults by averaging values for three mortar mixes as follows:
Proportions
Cement:lime:sand (volume)
Compre s sive Strength, psi
Age Age
28 days 6 months
%
increase1:0:2.5
1: 1: 51:2:7.5
3780
1330
5755160
2300
1270
36.5
73.0
121. 0
All of Staley's specimens were stored in a moist cabinet for the length of the curing period.
EXPERIMENT AL General
Staley's approach was used in this study to assess long -term outdoor and laboratory curing on the basis of compressive strength values. Preparation and laboratory curing of specimens followed current ASTM procedures, however, and long-t e r m curing was conducted on an outdoor
site. Thus, 2-in. cubes replaced the 2- by 4-in. cylinders and laboratory curing conditions varied with cement-lime proportions in the mortar.
A second method of as se s sing the degree of carbonation achieved during the curing period was sought. Chemical
analysis was rejected because of the problem of obtaining a
representative sample from a 2-in. cube with a thinly carbonated outer layer. A modified differential thermal analysis procedure was finally adopted. In the absence of proper equipment, it was decided to determine weight losses after ignition to 550 and 1000°C. This procedure assumes dissociation of Ca {OH)2 at the lower temperature, and of CaC03 at the higher.
Five different c o rnb in at ion s , four of the mortars m the ASTM Mortar Specification and a l:3 (lime: sand) mortar, were included in the study as follows (volume proportions):
Type S TypeN Type
°
Type K Type L Materials 2: l:9 1:1:6 1:2:9 1: 3: 12 1:3 cement:lime: sand c e me nt:lime: sand cement:lime: sand cement:lime: sand Ii me zs andTwo series of cubes were studied. Mortars for the first series contained "Limo" hydrated lime, a high calcium hydrate. A high calcium lime putty obtained from a local
supplier was used in the second series. Before being sold, it is aged one month, after slaking. Other materials were Maritime Brand Portland Cement and a mixture of equal parts graded and 20-30 Ottawa sand.
The materials for the respective mortars were pro-portioned according to the procedure outlined in ASTM Specification C91, using densities of 87t Ib per cu ft for portland cement, 50 Ib per cu ft for hydrated lime and 83 lb per cu ft for lime putty. The figure for lime putty was obtained from a density determination in the laboratory. Mixing
Mixing procedures outlined in ASTM Specification C91 were followed, with one notable exception. Instead of mixing to a constant flow 110 per cent t 5 mortars were mixed to a constant consistency as measured by the dropping ball pene-tration test developed at the British Building Research Station. This decision re sulted from field observations that masons use different mortars at different flow rates. Studies have indi-cated that the B.R.S. penetration test gives a better approxi-mation of the rna s onl s assessment of mortar workability than
other methods of measurement, including the ASTM flow table. In the DBR program, the amount of water necessary to produce a rno r ta r having a penetration of 10.5
-t
0.5 mm was predetermined. As mortars were mixed for molding cubes, their flow values were also determined.Thirty- six 2 -in. cube s were molded with each mortar. This required four batches, nine cubes being molded from each batch.
The following flow values were obtained for the different mortar combinations in Serie s I which, as previously noted,
were mixed to a constant consistency. Values have been corrected to a penetration of lO mrn; using a factor of 6 per cent for each mm the penetration varies from 10.
Type S Type N Type 0 Type K Type L 125% 115% 112% 110% 102%
The se value s sugge st that when mortar s are mixed to a constant consistency the flow value s decrease as the lime con-tent in the mortar is raised. This indicate s the improvement in "workability" contributed to the mortar by the lime. Using mortars at constant consistency with variations in flow appears to be a more realistic laboratory procedure in terms of field practice. Flow resu.It s are shown graphically in Figure 4.
Flow value s for the mortars in Serie s II, mixed to a constant consistency, were dete r rr.in e d as below and are shown graphically in Figure 4. Values have been corrected to a
penetration of 10 rnrn , Type S Type N Type 0 Type K Type L 119% 113% 110% 105% 88%
The fact that the flow curve for Series II mortars lies below the curve for Series I mortars (Figure 4) is explained
by the greater workability of lime putty as compared with hydrated lime.
Laboratory Curing
After the cubes were molded, molds containing Types S, N, and 0 mortars were stored in a moist cabinet. After 48 hours, the molds were stripped and the cubes numbered I to 36. Cubes designated for laboratory curing (see Table I) were returned to the moist cabinet and at seven days, the Type S cubes were immersed in water for the remainder of the 28 -day curing period. Types Nand 0 mortars were stored in the moist cabinet for the entire curing period. Type s K and L mortar s were stored in air (70°F and 50% RH) initially and cubes desig-nated for laboratory curing remained stored in air during the curing period.
Outdoor Curing
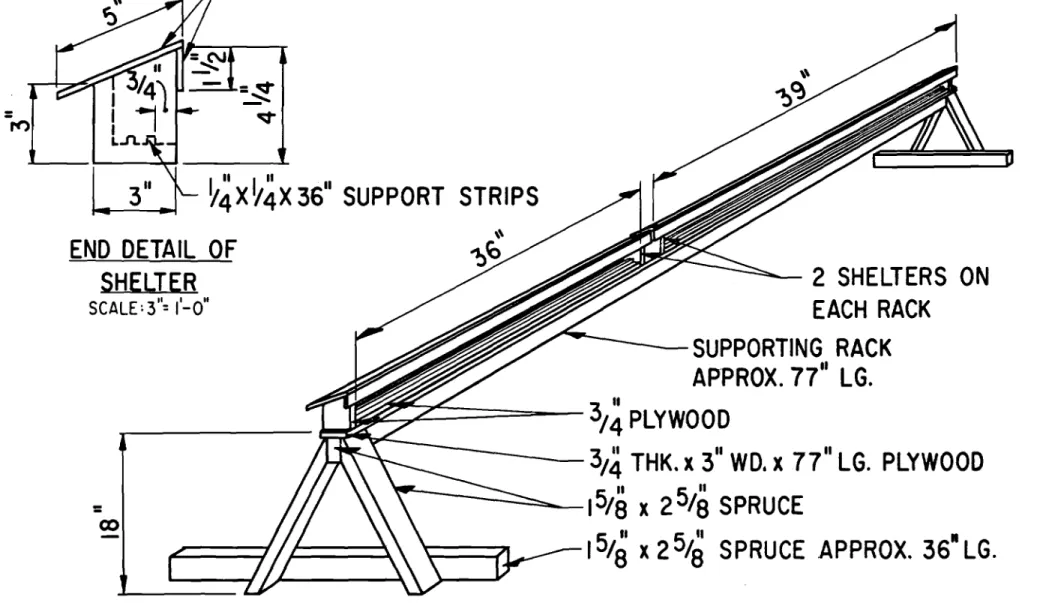
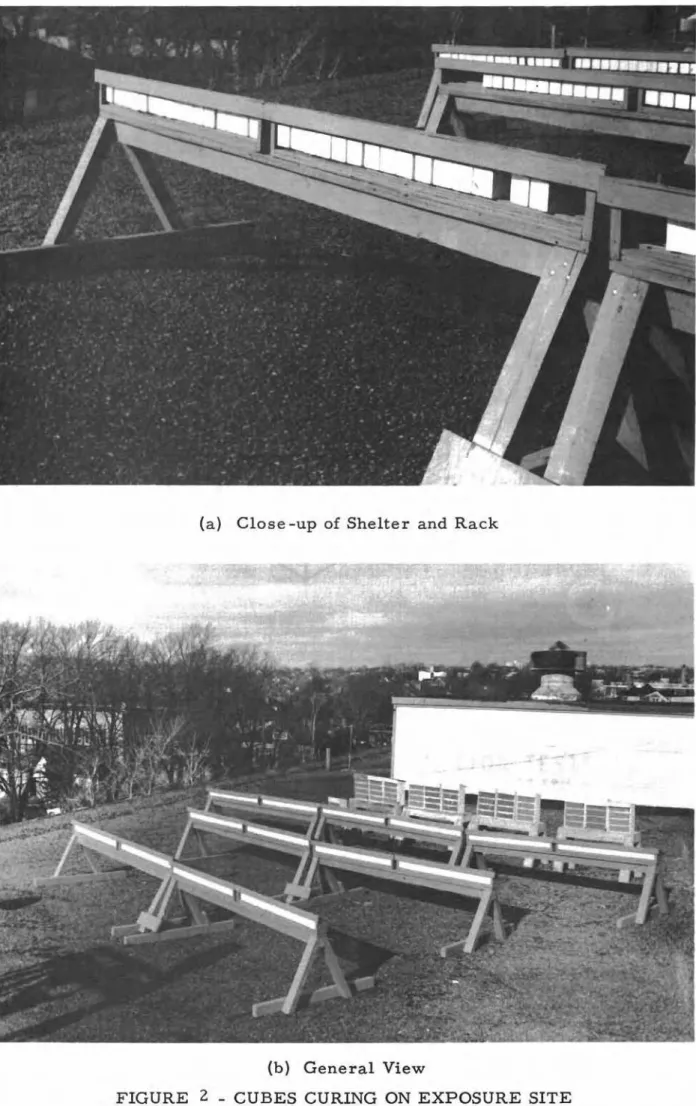
All cubes for outdoor curing were placed in shelters on the exposure site after their removal from the molds at 48 hours. The exposure site was on the roof of the NRC
Atlantic Regional Laboratory. Shelters were designed (Figure 1) so that five sides of the cubes were protected and the sixth was exposed to the weather. Parallel wooden strips, セ in. by セ in. along the length of the shelter, supported the cube s above the floor and ensured a free circulation of air around them while protective wooden strips along the front top of the shelter s prevented snow and rain from beating in on top of the specimens. Shelters were 36 in. long to accommodate 16 cubes. They were mounted on racks (Figure 1) eighteen inches above roof level. In placing the cubes in the shelters, the top surface of the cube as cast in the mold became the surface exposed to the weather. The cubes were placed far enough apart to permit a circulation of air. Shelters were oriented so that the exposed side of the cube s faced south. Pictures of specimens on exposure are shown in Figure 2. Curing periods on the exposure site were 3, 6, and 12 months. Testing
(a) Compressive Strength - Upon completion of their curing period, laboratory specimens were te sted in the condition they had achieved during curing, i. e. Type S were te sted wet, Types Nand 0 were tested in a moist condition, and Types K and L were tested dry. Initially, exposure-cured cubes were tested as they were removed from the shelters. An early set of results for cubes removed during a rain storm and tested in a wet condition produced abnormally low values. Thereafter, cubes were stored overnight in air at 70°F and 50% RH, prior to te sting. Te sts were conducted according to procedure s out-lined in ASTM Specification C109.
(b) Weight Loss on Ignition - For this test, two cubes were selected from the 28-day specimens and three from each of the 3-, 6-, and l2-month specimens. On the Friday preceding the week of the respective compressive strength tests, the
specimens selected for weight loss tests were cut into eighths
and the resulting l-in. cubes were numbered as in Figure 3. Samples 1, 4, and 7 were dried over the weekend, and their dry weights recorded.
They were then placed overnight in a muffle oven in crucible s heated to 550 ° C, and the weight recorded. This
procedure was repeated and the weight los s was determined after the second burning. Samples were then heated to 1000°C overnight, weighed, the procedure repeated and weight los s recorded as
before. The object of repeated burning at the two temperatures was to ensure that constant weight had been reached before calculating weight los se s . After a few runs it was found that second burnings were unnecessary and they were discontinued. The losses upon ignition at the two temperatures were calcu-lated as a percentage of the dry weight of the samples.
Serie s I
(a) Preparation - Mortar s for cube s in this Serie s contained hydrated lime. It was used in the dry state, except for Type L cubes for which it was soaked for 48 hours prior to use.
Initially a schedule for molding and testing cubes was drawn up and is shown in Table II. Cubes were molded between mid-May and mid-July; thus, specimens cured on exposure had the benefit of favourable summer curing weather during their early life. It should be recorded that the schedule was followed as originally drawn up, with very minor exceptions.
Results
(a) Compressive Strength - The average compressive strength values for Series I cubes are shown in Table III,
which also include s the percentage improvement for exposure
curing at 3, 6, and 12 months over the values after 28-day laboratory curing. The results indicate a steady increase in compressive
strength value s for each mortar as the length of the curing period was increased. Numerically, the greatest increases occurred for mortars containing the most cement (Type S), and decreased as the lime content was increased. Thus, as the curing period was increased from 28 days to 12 months, Type S cubes registered an improvement of 1711 psi, while at the other end of the scale, the increase for the Type L mortar was only 323 psi.
The relation of the 12 -month value to the 28 -day value is, however, more significant. For Type S mortar the gain
is 53 per cent, while for Type L rno r ta r it was 320 per cent. This rne an s that 28-day values for Type S rno r ta r s are six tirne s rno r e realistic in te r m s of l2-ITlonth exposure-cured cube values, than Type L rno rt a r . Si mi.Ia r c ornpa r i s on s for the widely used
Type Nand 0 rno r ta r s indicate that laboratory-cured Type S rrio rta r s are
Ii
and 2 tirne s , respectively, rno r e realistic in te r m s of l2-ITlonth exposure -cured s pe ci.rne n s .Cornpr e s s ive strength values and c ornpa r at ive i rnp r ov e rne nt s are shown graphically in Figures 5 and 6.
(b) Weight Losses on Ignition - Weight losses on ignition to 550 and 1000°C for the different rno r ta r s are c ornpi.Ie d in
Table IV and shown graphically in Figure s 7 and 8. An e xa mination of Figure 7 shows considerable fluctuation in re sults after
ignition to 550 ° C. Only the Type L mo r ta r produced a predictable pattern, with the greatest a mount of Ca (OH) 2 (indicated by weight loss) at 28 days, and progressively s rna.l.Ie r arnount s at 3, 6,
and 12 moriths . The pattern also sugge sts that the rno st rapid carbonation occurred between 3 and 6 rnorrth s , Re sults for the other four rn orta r s do not suggest any consistent pattern.
Figure 8 indicate s rno r e consistent re sults for weight losses after ignition to 100aoC. The a rnou.nt of CaC03 (weight
los s ) increased progre s sively fr orn low value s for 28 -day s pe c i rne n s to rnaxi.rnurn s for l2-ITlonth cubes. The only exception occurred for the Type 0 (1:2:9 C:L:S) rno r ta r , where the s ixvrnonth value exceeded that for the l2-ITlonth s arnpl e s , The break in the l2-ITlonth curve suggests that the error is in the 12-ITlonth value for the Type 0 rno rta r .
The curves in Figure 8 also indicate that the arnount of CaC0 3 increased with increasing Lirrie content in the rno r ta r s , Thus, the weight los se s for ignition to 1000 ° C increased fr orn 5. 1 to 6.8 per cent for Type Sand fr orn 5.8 to 9.4 per cent for Type L rno r ta r cubes. The only exception was the Type 0 rrio rta r at 12 rnont h s , the low value referred to above.
Figure 8 suggests that the rno st rapid carbonation occurs between 28 days and 3 rnont h s , and that the reaction slows down between 3 and 12 rnorrth s , This contradicts results shown in
Figure 7, which indicate that rno st curing occur s between 3 and
Because of their greater consistency, weight losses at 1000°C are considered the more reliable of the two ignitions. Conclusions
Compressive strength values suggest an increasing discrepancy for the ratio of strengths (12 months to 28 days) for cement-lime mortars as the lime proportion in the mortar is increased. They also indicate a relatively steady rate of curing for mortars containing high proportions of cement, contrasted with a more rapid curing rate during the first six months of the period for mortars having a higher proportion of lime.
Los s of weight on ignition to 550 and 1000 ° C shows promise as an indication of the extent of carbonation. This was illustrated best by values for samples ignited to 1000°C, where a relatively consistent pattern emerged. Weight loss records indicate that the greatest rate of carbonation occurs during the first three months of the curing period.
Series II
(a) Preparation - The schedule for molding and te sting Series II cubes is also included in Table II. Cubes in this series, with mortars containing lime putty, were molded between 9 August and 9 September. High lime content mortar cubes were assembled first to permit a maximum of favourable fall weather for the cubes designated for exposure curing. As in Series I, there were no major problems in following the schedule as it was laid out.
Results
(a) Compre s sive Strength - Average compres sive strength values and percentage improvement for exposure curing after 3, 6, and 12 months over 28 -day laboratory curing, are compiled in Table V and illustrated graphically in Figures 9 and 10. The pattern lacks the consistency shown in results for Series I
mortars, but the same general trend is observed. Low value s for Type L (lime) mortar cubes at 3 months are attributed to
te sting when damp. The se are the cube s previous ly referred to as being removed from exposure during a rain storm and tested without drying. Other variations in re sults are net so easily explained, as, for example, the low value for Type 0 cubes at 6 months. Only the results for Types Nand 0 mortars (omitting the 6-month value for Type 0) are comparable to results for Series
1.
The improvement in values for exposure-cured Types Sand K cubes was greater in Series II than in Series I, while Type L values showed less improvement. To make thesame comparisons previously used, the ratio of strengths (IZ months to Z8 days) for Type N mortar was only 5 per cent higher than for Type S mortar. Type 0 was 50 per cent better and Type L showed an improvement of about zt time s , The greate st improvement over the ratio of strengths ( lZ months to Z8 days) for Type S mortar was for Type K mortar: its ratio was 6t times greater.
(b) Weight Losses on Ignition - Weight losses for Series II mortars after ignition to 550 and 1000°C are listed in Table VI and shown graphically in Figures 11 and lZ.
No consistent pattern emerged from weight los s data after ignition to 550 ° C, except support of the obvious fact that there was more Ca (OH) Z (weight loss) as the percentage of lime in mortars increased. Examples of inconsistencies are
seen in re su lt s for Type S mortar, where greate st weight los se s occurred after 6 months curing, and smallest losses in Z8-day specimens. Again, with Type L mortar, greatest losses occurred for specimens cured 3 months and smallest losses in 6-month
specimens. Similar inconsistencie s occurred in other mortar combinations.
Los se s after ignition to 10000C were a little more
consistent. For each mortar, weight losses rose as the length of the curing period was increased. With increasing lime content in the mortars through Types S, N, and 0, larger weight los se s were recorded indicating increased formation of CaC03. The sugge stion of a Ie s s e r degree of carbonation in Types K and L mortars was directly opposite the indication of compressive strength values.
As in Series I, records of weight loss data indicate greate st rate of carbonation between the Z8 -day and 3 -month curing periods; it then seems to level off during the remainder of the lZ-month period. As already indicated, this is contradicted by compressive strength values for Types K and L mortars
Conclusions
Although they do not display the same consistency as Series I, compressive strength values for Series II mortars containing lime putty support the trend of re sults for Serie s I, in which increasing discrepancie s in the ratio of strengths (12 months to 28 days) occurred with increased lime content in the mortar s.
Results of compressive strength tests suggest that greate st improvement for Type S mortar occurred between 28 days and 3 months, while for Type K mortar, the greatest improvement was between 6 and 12 months. Results for Type L mortar are difficult to assess due to an abnormally low value for 3-month cubes.
Results of weight loss determinations on mortars after ignition to 550 and 1000°C were inconsistent. Values for
losses at the lower temperature are meaningless, but a somewhat better pattern at the higher temperature suggests that this method may be of some as sistance in as se s sing the degree of carbonation. Comparison of Re sults from Serie s I and Serie s II
Four reasons are suggested for differences in :results for the two Series.
1. Difference between hydrated lime and lime putty. It is suggested that cubes of lime putty may have dried at a slower rate and that this may have retarded the curing process.
2. Series I cubes molded during the May-July period enjoyed optimum curing weather during their early life. Serie s II cubes, molded during the August-September period, had only a short period of good curing weather before winter. They encountered best curing conditions near the end of the period.
3. Specimens were not necessarily in the same condition, with re spect to moisture content, when te sted for compre s sive
strength. Overnight storage at 70 ° F and 50 per cent RH undoubtedly was an improvement, but was not long enough to ensure uniform conditions at the time of te st.
4. The pattern of the 12-month to 28-day ratio for compre s sive strength value s was more consistent than those for 3 and 6 months. Many of the inconsistencies were
eliminated as a re suIt of longer curing. REFERENCES
1. Boynton, Robert S. Chemistry and Technology of Lime and Limestone. Interscience Publishers, New York, 1966. 2. Foran, M. R., V. E. Vaugan and Thora Reid. Masonry
Deterioration. (unpublished).
3. Staley, Howard R. Volume Changes in Mortar and Strength Characteristics of Brick Masonry. Proceedings, National Lime Association, 1939,
p.
37-65.4. Voss, Walter C. Exterior Masonry Construction. National Lime As sociation. Bulletin 324. Washington, 1956.
-Cubes Numbered 1 to 36 After Removal From Molds 28-Day Laboratory Curing
Ignition - cubes #12, #30
Compo Strength - cubes #1, #16, #23, #34 3-Months Exposure Curing
Ignition - cubes #7, #24, #31
Compo Strength - cubes #4, #13, #18, #19, #27, #28, #36 6-Months Exposure Curing
Ignition - cubes #6, #10, #29
Compo Strength - cubes #3, #9, #14, #17, #20, #26, #33 12-Months Exposure Curing
Ignition - cube s #2, #22, #35
SCHEDULES FOR MOLDING AND
TESTING CUBES
Serie s I
Mortar Date Date Tested
Type Molded 28 Days 3 Months 6 Months 12 Months
Type S May 25&27/65 June 23 Aug. 25 Nov. 25 May 25/66
Type 0 June 7&9/65 July 6 Sept. 7 Dec. 7 June 7/66
Type K June 14&16/65 July 13 Sept. 14 Dec. 14 June 14/66
Type L Ju1y2&5/65 Aug. 2 Oct 4 Jan. 3/66 July 5/66
Type N July 13&15/65 Aug. 9 Oct 12 Jan. 12/66 July 13/66
Series II
Mortar Date Date Tested
Type Molded 28 Days 3 Months 6 Months 12 Months
Type L Aug. 9&11/65 Sept. 8 Nov. 10 Feb. 10/66 Aug. 11/66
Type K Aug. 16&18/65 Sept. 15 Nov. 17 Feb. 17/66 Aug. 18/66
Type 0 Aug. 23&25/65 Sept. 22 Nov. 24 Feb. 24/66 Aug. 25/66
Type N Aug. 30 Sept. 1/65 Sept. 29 Dec. 1 Mar. 2/66 Sept. 1/66
A VERAGE COMPRESSIVE STRENGTH VALUES (PSI)
Laboratory Exposed Exposed Exposed
Mortar 28 Days 3 Months 6 Months 1 Year
Type S 3253 3358 4064 4964
Type N 1650 1903 2182 2911
Type 0 646 859 916 1347
Type K 266 598 770 1048
Type L 101 161 268 424
IMPROVEMENT OVER 28 DAY VALUES, PER CENT
At At At
Mortar 3 Months 6 Months 1 Year
Type S 3% 25 % 53 %
Type N 15
0/0
320/0
760/0
Type 0 33
0/0
420/0
1080/0
Type K 125
0/0
1890/0
2940/0
550 AND 1000°C Series I
28 Day 3 Month 6 Month 1 Year
Mortar 550°C 1000°C 550°C 1000°C 550°C 1000°C 550°C 1000°C Type S 4.3 % 5. 1 % 3.9 % 5. 6 % 4.0% 5.9% 3.3 % 6.8 % Type N 4.2 % 5.0% 2. 5 % 5.8 % 4. 1
%
7.8% 3.7 % 8.4% Type 0 4.2 % 5.3 % 3.3 % 7.3% 1.9% 8.2 % 2. 1 % 8.1 % Type K 2.3 % 5.5% 3. 6 % 7.0% 3.5% 8.0% 2.80/0
9.0 % Type L 3. 1 % 5.8 % 2.9 % 8.6% 1.2% 8.8% 0.9% 9.4%Series II
A VERAGE COMPRESSIVE STRENGTH VALUES (PSI)
Mortar Type S Type N Type 0 Type K Type L Laboratory 28 Days 2781 1469 525 138 125 Exposure 3 Months 3648 1727 629 254 95':< Exposure 6 Months 3840 1852 554 278 201 Exposure 1 Year 4661 2506 1065 755 329 ':'Cube s damp when te sted
IMPROVEMENT OVER 28 DAY VALUES, PER CENT
At At At
Mortar 3 Months 6 Months 1 Year
Type S 31 % 38 % 68 %
Type N 17 % 26 % 71 %
Type 0 20 % 6% 103 %
Type K 84 % 100 % 447 %
550 AND 1000°C Series II
WEIGHT LOSS ON IGNITION (PER CENT DRY WEIGHT)
28 Day 3 Month 6 Month 1 Year
Mortar 550°C 1000°C 550°C 1000°C 550°C 10:)0°C 550°C 1000°C Type S 3. 7 % 4. 7 % 3.9 % 5. 5 % 4. 7 % 5. 6 % 3.9 % 6.
a
% Type N 3.8 % 4.6 % 3.2 % 6. 2 % 2.8 % 6.8 % 3. 5 % 8.1 % Type 0 3.2 % 4.1 % 2.0 % 6.4 % 2. 7 % 7.7% 2.1 % 8.8% Type K 1.9% 4. 7 % 2.4 % 6.4 % 2.7 % 7.8 % 2.9 % 7.8% Type L 1.3% 4. 7 % 2.3% 6.4 % 0.8 % 7.a
% 1.0% 7.1 %セ
2 SHELTERS ON
EACH RACK
SUPPORTING RACK
APPROX. 77" LG.
セセセ]]]]]MM
SOセ
PLYWOOD
3/
4
THK.
x
3" WD.
X
77"
LG. PLYWOOD
\"
セ
15
/8
x
2 5/
8
SPRUCE
ISla
x
2
SIS
SPRUCE APPROX. 36· LG.
-
co
· _
ケセ
x
Y4X 36" SUPPORT STRIPS
END DETAIL OF
SHELlER
SCALE:
3":
11_011
-
セ(b) General View
•
120
セNセ・イゥ・ウ
I
.
110
3:
o
•
0
....Ju-
0•
100
90
o
Type L
100% L
Type 0 Type K
66% L
75% L
34% C
25% C
Type N
50%
L
50% C
80
セBBBGMMMMBBBGMMM⦅MBBBMMNNNNNNNNiMMMMMM⦅MMMNNiMMMMMiType S
34% L
66%
C
PROPORTION OF CEMENT AND LIME IN MORTAR
FIGURE
4
FLOW VALUES FOR MORTARS CORRECTED TO 10MM
PENETRATION
..
:::c
•
I--4000
セz:
I.LJc::::
I--•
(,/")3000
I.LJ°
>
(,/") (,/") L&J _ 0c::::
2000
0-a..
ッセ
:E
0Type
0
--u
1000
.-
_ 0 Nセ - 0 -' - Type K
0-Type L
="
ッセ
628
3 Mos.
6 Mos.
12 Mo s.
Days
LENGTH OF CURING PERIOD
FIGURE
5
•
V') l.LJ300
セ•
....J«
>
>-
250
«
0 00 Ne:::::
200
Type K •
l.LJ>
0
l.LJ150
V')«
l.LJe:::::
u
•
z
100
セ6 Mo s.
LENGTH OF EXPOSURE CURING PERIOD
FIGURE
6
IMPROVEMENT IN COMPRESSIVE STRENGTH VALUES
FOR CUBES CURED ON EXPOSURE SITE OVER
8
I--::::c
セ7
LJ.J3:
>-
6
c:::
c
⦅NMNMNセ"
,
..."
セ"'...
...
"
セ...
...
セL
<;
ZセセLNNNM
/.
.'.--3 Mo n
t
h"s"
...- "'"'
.!...
セ
' " , , / " '<. ' "6 Mo nth s
.>...
y
/
..
"-12 Mo n iii·s
..
...
.
1
LJ.J3:
2
..
V')セ
4
--JI--セ
3
Type S
34% L
66% C
Type N
50% L
50% C
Type 0 Type K
66% L
75% L
34% C
25% C
Type L
100% L
PROPORTIONS OF CEMENT AND LIME IN MORTAR
FIGURE
7
WEIGHT LOSSES FOR MORTARS AFTER IGNITION TO
550°C, SERIES
I
-C
28 Days
..•
セ
12 M
0
nth
セ
•-- .:;
."
..
..
...
...
.,.,.,-
.
/
..
.. .I...., ..
=--..
.----
;I"" .- . - • . . . - • - - - . ;I""...L·/6
M
0
nth
S
,,;1""
;I""..
.
' - - '
",..."
...
./
/
...
...". /
/ /
/./
/
3 M
0
nth s
Oセ
--
---8
l -I7
セ LLIS
6
>-e::::
0'P/i!.
5
..
V')4
V')0
....JI-3
I セ LLIS
2
1
Type S
34% L
66% C
Type N
50% L
50% C
Type 0 Type K
66% L
75% L
34% C
25% C
Type L
100% L
PROPORTIONS OF CEMENT AND LIME IN MORTAR
FIGURE
8
WEIGHT LOSSES FOR MORTARS AFTER IGNITION TO
1000°C, SERIES
I
..
:c
t -4000
Co:):z:
LLJ 0::: t -V) LLJ3000
>
V) V) LLJ 0:::2000
0..:E
o
u
1000
_______ 0--TypeN
__
---.i-«:
_---0
___ 0-ッセ
_ _ 0Type 0
---
__ - - - -
•
セ...
o -
-
-
0 - - - 0 - - 0 0 0 0 0 0 0 0 0 0 0 0 0 0of
y
peL
./Type K
!!
0 0 0 0 .L -
. - 6 ._ •. 1':. •• •. • • • • • • • _ . _ . _ ....
_.--.-
_.--
---
--LENGTH OF CURING PERIOD
28
Days
3 Mos.
6
Mos.
12
Mo s.
FIGURE
9
Type K
セ
400
:::::> ....J«
>
>-«
c
300
00 Ne:::
l.LJ>
0
l.LJ200
V')Type L
«
l.LJe:::
u
z
Type 0
-
100
セType N
Type S
3 Mo
s.
6
Mos.
12 Mo
s.
LENGTH OF EXPOSURE CURING PERIOD
FI GURE
10
IMPROVEMENT IN COM PRESSIVE STRENGTH VALUES
FOR CUBES CURED ON EXPOSURE SITE OVER
LABORATORY CURED SPECI MENS, SERI ES
II
.... 6
:c
c.:>
LLJセU
>-a:::
c
,
.
-,
...
28
•••
""-\.
...
セ...
..
..
セ,'
..
6 Mo nth
セNLNセN
セNN
. .
•••
12 Mo nth s
'-._.
e. • •Nセ.
. /
•
•
3 MonthS'··.
-
セN.
••
,
.•
セMMMMM
.
セG..
セ..
セN セセ,,-:
..
••
1
Type S
34% L
66% C
Type N
50%
L
50% C
Type 0 Type K
66% L
75% L
34% C
25% C
Type L
100% L
PROPORTIONS OF CEMENT AND LIME IN MORTAR
FIGURE
11
WEIGHT LOSSES FOR MORTARS AFTER IGNITION TO
550°C. SERIES
II
I -