HAL Id: hal-02382478
https://hal.univ-lorraine.fr/hal-02382478
Submitted on 27 Nov 2019
HAL is a multi-disciplinary open access
archive for the deposit and dissemination of
sci-entific research documents, whether they are
pub-lished or not. The documents may come from
teaching and research institutions in France or
abroad, or from public or private research centers.
L’archive ouverte pluridisciplinaire HAL, est
destinée au dépôt et à la diffusion de documents
scientifiques de niveau recherche, publiés ou non,
émanant des établissements d’enseignement et de
recherche français ou étrangers, des laboratoires
publics ou privés.
Evidence for a photoinduced isonitrosyl isomer in
ruthenium dinitrosyl compounds
Dominik Schaniel, Nicolas Casaretto, El-Eulmi Bendeif, Theo Woike, Anna
Gallien, Peter Klüfers, Sylwia Kutniewska, Radoslaw Kamiński, Guillaume
Bouchez, Kamel Boukheddaden, et al.
To cite this version:
Dominik Schaniel, Nicolas Casaretto, El-Eulmi Bendeif, Theo Woike, Anna Gallien, et al.. Evidence
for a photoinduced isonitrosyl isomer in ruthenium dinitrosyl compounds. CrystEngComm, Royal
Society of Chemistry, 2019, 21 (38), pp.5804-5810. �10.1039/C9CE01119F�. �hal-02382478�
Evidence for a photoinduced isonitrosyl
isomer in ruthenium dinitrosyl
compounds
Dominik Schaniel,*
aNicolas Casaretto,
aEl-Eulmi Bendeif,
aTheo Woike
a,b, Anna K. E. Gallien,
cPeter Klüfers,
cSylwia E.
Kutniewska,
dRadosław Kamiński,
dGuillaume Bouchez,
eKamel
Boukheddaden
eand Sébastien Pillet
aSince the seminal characterisation of two photoinduced linkage isomers (PLIs) in crystals of sodium nitroprusside dihydrate Na2[Fe(CN)5(NO)]·2H2O by
photocrystallography, this phenomenon has been described in a large variety of molecular mononitrosyl complexes. The two photoinduced metastable isomers consist of a κO, isonitrosyl, binding mode (MS1) and a κ2N,O, side-on,
binding mode (MS2). We have recently detected by infrared spectroscopy various PLI states in dinitrosyl ruthenium complexes, for which only κN binding modes were characterised by photocrystallography. We provide here experimental evidences for a photoinduced isonitrosyl isomer in the [Ru(PCy3)2(NO)2Cl]BF4 (Cy=cyclohexyl) complex salt, the results being strongly
supported by DFT calculations.
a.Université de Lorraine, CNRS, CRM2, Nancy, France.
b.Institut für Strukturphysik, TU Dresden, Zellescher Weg 16, Dresden, Germany. c.Department Chemie der Ludwig-Maximilians-Universität, Butenandtstraße 5–13,
81377 Munich, Germany.
d.Department of Chemistry, University of Warsaw, Żwirki i Wigury 101, 02-089 Warsaw, Poland
e.Groupe d’Etudes de la Matière Condensée, Université de Versailles, Université Paris-Saclay, CNRS UMR 8635, 45 Avenue des Etats Unis 78035 Versailles, France
† Footnotes relating to the title and/or authors should appear here.
Electronic Supplementary Information (ESI) available: [Supplementary-Material_final.docx]. See DOI: 10.1039/x0xx00000x
Introduction
Photoinduced linkage isomerism is a phenomenon observed in a variety of molecular compounds, containing photo-switchable ligands such as NO, nitrite, SO2 [1,2]. In the case of the nitrosyl
ligand, the photo-isomerisation is particularly interesting due to the intriguing bonding properties of the “non-innocent” ligand NO [3] as well as the competition between PLI and photoinduced NO-release (used e.g. for photodynamic therapy) [4,5]. In the solid crystalline state, the formation of NO linkage isomers is furthermore accompanied by changes in the photochromic and photorefractive properties, which might be exploited for optical applications [6,7].
By photocrystallography and density-functional theory (DFT) calculations it has been established that in mononitrosyl complexes two types of photoinduced linkage isomers (PLIs) can be generated: an isonitrosyl (κO) and a side-on (κ2N,O)
configuration. Whether or not one or the other PLI is formed depends on the bonding properties and the local environment of the NO ligand as well as on the existence of a suitable excitation–relaxation pathway. The necessary conditions for PLI generation, depending on the wavelength dependence of population and depopulation and temperature, have been discussed in a generalised energy potential scheme, pointing to the importance of a suitable optical generation pathway [8,9]. Adding a second photo-switchable ligand renders the potential energy surface more complex, leading to many minima
corresponding to potentially accessible PLIs. For the case of a ruthenium complex with two NO ligands we have already reported a different type of PLI, where the nitrosyl ligand remains N-bonded (κN) but changes the Ru-N-O angle [10-12]. The classification into isonitrosyl (κO) and side-on (κ2N,O) to
describe nitrosyl linkage isomers is thus insufficient, these two configurations could be regarded as boundary structures within which other stable structures might be adopted.
In order to extend the knowledge on the formation of linkage isomers beyond the hitherto mainly investigated mononitrosyl complexes, we started a systematic study of ruthenium dinitrosyl complex salts of composition [RuL2(NO)2X]BF4 (L =
monodentate phosphane, X = Cl, Br, I). The coordination of the complex cations adopts either a vacant octahedron (vOC-5) form with one (strongly) bent and one (almost) linear NO ligand, or a trigonal bipyramid (TBPY-5) with two almost linear NO ligands [13]. We could already characterise PLIs in the vOC-5 and TBPY-5 structure types of [RuL2(NO)2X]BF4 compounds by
combining infrared spectroscopy and X-ray diffraction under in situ photo-excitation [10-12]. While the studied TBPY-5 complexes exhibit only one PLI [11], up to three PLIs could be identified by infrared spectroscopy for the vOC-5 type compounds [10,12]. These three PLIs exhibit different populations, in general a major component (PLI-1) is found with significant population of 30% or more, while the minor components PLI-2 and PLI-3 remain below 10%. Hence, only the major PLI (PLI-1) could be structurally characterised by X-ray diffraction, revealing that it corresponds to a κN nitrosyl binding mode, but with a different Ru-N-O angle compared to the ground state (GS). In the case of [Ru(PPh3)2(NO)2Cl]BF4, the
orientation of the bent nitrosyl ligand is switched by 117° from a Ru-N-O angle of 134° pointing towards the linear equatorial nitrosyl in the GS to a Ru-N-O angle of 109° pointing towards the Cl ligand in the PLI-1 state [10]. Upon this structural reorganisation, the asymmetric and symmetric NO vibrational bands shift by −33 cm−1 (from 1686 to 1653 cm−1) and +5 cm−1
(from 1866 to 1871 cm−1), respectively. Recently we
investigated the compound [Ru(PCy3)2(NO)2Cl]BF4 due to its
ability to form several PLI with significant population, i.e., >10%, allowing in principle for a meaningful X-ray diffraction analysis of the minor components PLI-2 and PLI-3. However, the overlap of several PLI structures did not allow for an unambiguous structural characterisation of the second PLI (2) [12]. For PLI-1 a structural conformation similar to that found in [Ru(PPh3)2(NO)2Cl]BF4 was determined (see below for details).
Here we reinvestigate this compound with the main goal to unravel the nature of the PLI-2 state using a combination of infrared spectroscopy, photocrystallography, optical absorption spectroscopy and DFT calculations.
Experimental
Synthetic procedures
[Ru(NO)2(PCy3)2Cl]BF4 was synthesised according to the
procedure published in [13]. Red-orange crystals were grown on cooling the reaction solution to ambient temperature and small, block-shaped crystals were selected.
DFT calculations
A DFT analysis was performed on the BP86/def2-TZVP level of theory including Grimme’s D3 van-der-Waals correction [14]. Orca 3 [15] was used for all calculations.
Infrared spectroscopy
For infrared-spectroscopic measurements, crystals of [Ru(NO)2(PCy3)2Cl]BF4 were mixed with KBr powder
(spectroscopic grade), finely ground and pressed to pellets. The pellets were glued with silver paste to the cold-finger of an Oxford Optistat (V01), equipped with KBr windows and allowing temperature control in the range 10–300 K. Data were collected in the spectral range 4000–360 cm−1 at a resolution of 2 cm−1 on
a Nicolet 5700 FTIR spectrometer. Irradiation of the sample was performed using lasers and light-emitting diodes (LEDs, Thorlabs LP and L series) of different wavelength in the range 405–660 nm.
Visible absorption spectroscopy
For visible absorption spectroscopy, the crystals of [Ru(NO)2(PCy3)2Cl]BF4 were mixed with KBr powder
(spectroscopic grade), finely ground and pressed to pellets (5% weight concentration of the sample). The pellets were glued with silver paste to the cold-finger of a Janis cryostat, equipped with quartz windows and allowing temperature control in the range 10–300K. Data were collected in transmission mode in the spectral range 815–350 nm at a resolution of 2 nm on a Perkin Elmer spectrometer (model lambda 950).
Photocrystallography
Single-crystal X-ray diffraction data were collected on a SuperNova microfocus-source diffractometer equipped with an ATLAS detector, using Mo Kα radiation (λ = 0.71073 Å) and an
Oxford Instruments nitrogen-flow cryostream. The temperature was kept at 100 K. A single crystal was mounted on a glass fibre using vacuum grease. In a first step, diffraction data were collected at 100 K in the ground state. The unit-cell determination and data reduction were performed using the CrysAlisPRO program [16] on the full data set. 28583 reflections were measured up to a maximum resolution of sin()/λ = 0.77 Å−1 and merged to 13318 unique reflections (R
int = 0.0252).
A numerical absorption correction was performed. The corresponding structure was solved in the space group P1̅ by direct methods using the SHELXS-2014 program [17] and refined on F2 by weighted full-matrix least-squares methods
using the SHELXL-2014 program [17]. All non-H atoms were refined anisotropically. The PCy3 ligand exhibits a disorder on
one of the cyclohexane rings, which was taken into account using two split orientations for that fragment (see ESI for more details). The [BF4]− anion also exhibits disorder on two
orientations. Hydrogen atoms were kept at their idealised positions, using a riding model, constraining the isotropic displacement parameters to 1.2 times those of the attached C atom. The cif-file of the ground state is available from the
Cambridge Structural database under the number CCDC-1949300.
The same sample was then irradiated at 100 K with a laser diode of 405 nm (P = 90 mW) for 60 min in the complete dark, until the photo-stationary state was reached, the sample being continuously rotated during the irradiation. According to the infrared results, at this temperature and irradiation wavelength, the PLI-2 metastable state can be selectively populated with a sufficiently high population to enable a meaningful photocrystallographic experiment. Complete diffraction data were collected in the photo-stationary state; no space-group change occurs with respect to the ground state (space group P1̅). The unit-cell parameters change only slightly. The unit-cell volume expands by 0.4%. 36230 reflections were measured up to a maximum resolution of sin()/λ = 0.77 Å−1, and merged to
13344 unique reflections (Rint = 0.0256). Empirical absorption
correction was performed. Relevant data are given in Table 1. Photo-difference maps were calculated for the visualisation of the light-induced changes in electron density, and for identification of the related structural changes from the GS to the PLI-2 state (Fig. 3). Common independent reflections between the GS and photo-irradiated state were used to compute the experimental X-ray photo-difference map by inverse Fourier transform of the |Fphoto-irradiated,obs(hkl)| −
|FGS,obs(hkl)| differences, using the phases from the refined GS
Table 1: Crystallographic data and refinement details for [Ru(NO)2(PCy3)2Cl]BF4 at 100 K in the ground and photo-irradiated states.
Ground state Photo-irradiated state
T (K) 100 100
Formula RuClN2O2P2C36H66BF4
Fw (g.mol−1) 844.18
Crystal system triclinic
Space group P1̅ Z 2 a (Å) 10.1159(5) 10.1307(4) b (Å) 13.1480(5) 13.1575(5) c (Å) 16.2911(6) 16.3180(6) α (°) 80.810(3) 80.930(3) (°) 84.854(4) 85.020(3) γ (°) 68.526(4) 68.581(4) V (Å3 ) 1989.35(16) 1998.56(14) calcd 1.409 1.403 (mm−1) 0.594 0.591 Crystal size (mm) 0.12×0.17×0.22 0.12×0.17×0.22 Refl. measured 28583 36230 range (°) 3.283 - 32.991 3.275 - 32.992 Refl. unique / Rint 13318 / 0.0252 13344 / 0.0256
Refl. with I>2*(I) 11727 11909
Nvar 471 479 aR 1 [F2 > 2*σ(F2)] 0.0425 [0.0337] 0.0428 [0.0351] bwR 2 [F2 > 2*σ(F2)] 0.0770 [0.0719] 0.0825 [0.0773] cGoF 1.083 1.107 max, min (e Å −3) 0.782 / −1.164 1.067 / −1.139 aR1 = ∑|Fo-Fc|/Fo. bwR2= {∑ [w(F o2-Fc2)2]/ ∑[w(Fo2)2]}1/2. cGoF= {∑[w(Fo2-Fc2)2]/(Nobs -Nvar)}1/2.
Results and Discussion
DFT calculations
In our previous publication we detected several potential PLI states in [Ru(NO)2(PCy3)2Cl]BF4 by infrared spectroscopy. The
major component, called PLI-1, was structurally characterised by X-ray diffraction [12]. In order to gain more insight into the behaviour of PLI in this complex and to identify potential other minima in the energy landscape corresponding to linkage isomers, we performed DFT calculations.
Table 2 summarizes the results obtained for the GS and PLI-1 in comparison with the experimental data from Ref. [12]. The agreement between theory and experiment is excellent. For the GS the calculated Ru-N1 and Ru-N2 distances are 1.865 and 1.777 Å compared to the experimentally observed 1.8699(17) and 1.7481(15) Å while the corresponding calculated and observed Ru-N1-O1/Ru-N2-O2 angles are 137.8°/179.3° and 136.71(14)°/179.53(16)°, respectively. The calculated asymmetric and symmetric NO stretching vibration modes are found at 1712 and 1810 cm−1, in good agreement with the
observed ones at 1710 and 1798 cm−1. For the photoinduced
linkage isomer PLI-1, the calculation yields a metastable state characterised by a bent nitrosyl linkage isomer with an angle of 118.5° for the bent N1O1 group, compared to the experimentally observed 118.7(4)°. The Ru-N1 distance increases by 0.13 Å from 1.865 to 1.995 Å in agreement with the experimentally observed lengthening of this bond upon photoisomerisation (+0.088(8) Å). The corresponding calculated NO vibrations reproduce well the experimentally observed shift, to lower wavenumbers (−20 cm−1) for the asymmetric mode and
to slightly higher wavenumbers (+6 cm−1) for the symmetric
mode. This metastable state is located 0.43 eV above the energy of the GS. Altogether, these calculations confirm the experimental results, and the assignment of PLI-1 as a linkage isomer of the bent nitrosyl, while the linear nitrosyl does not change its configuration significantly.
Table 2: Selected bond distances (Å), angles (°), and NO vibrations at 10 K for the GS and PLI-1 of [Ru(NO)2(PCy3)2Cl]BF4.
Experiment [12] DFT
Distance d(Å) GS PLI-1 Δ(PLI-1 – GS) GS PLI-1 Δ(PLI-1 – GS)
Ru-Cl 2.3775(4) 2.351(6) −0.026 (6) 2.410 2.353 −0.057 Ru-N1 1.8699(17) 1.958(6) +0.088(8) 1.865 1.995 +0.13 Ru-N2 1.7481(15) 1.757(5) +0.009(7) 1.777 1.784 +0.013 Angle (°) Ru-N1-O1 136.71(14) 118.7(4) −18.0(5) 137.8 118.5 −19.3 Ru-N2-O2 179.53(16) 177.1(3) −2.4(5) 179.3 167.2 −12.1 IR bands (cm−1) νsym(NO) 1798 1804 +6 1810 1815 +5 νasym(NO) 1710 1690 −20 1712 1672 −40
Given this excellent agreement, we explored in our calculation more possible linkage isomers. Three potential configurations were explored implicating the two nitrosyl ligands: (i) MS1, an isonitrosyl, κO, configuration of the bent nitrosyl while the linear nitrosyl remains κN, (ii) MS1a, a κO configuration of the linear nitrosyl while the bent nitrosyl remains κN, and (iii) MS11, a double isonitrosyl, κO, configuration, where both nitrosyl ligands adopt the κO geometry. These three configurations, corresponding to stable minima in the potential energy surface, are illustrated in Scheme 1 with their characteristic bond lengths and angles as well as the NO vibrations.
Scheme 1: Calculated structures for three possible PLI, including each at least one isonitrosyl, κO, configuration. The tables below the figures indicate the characteristic bond lengths and angles as well as the antisymmetric and symmetric NO stretching vibration for each structure. The Cygroups on the P ligands have been omitted for clarity.
We observe that the three calculated PLI exhibit distinct differences in the values of the bond lengths and angles and NO vibrations. This will allow for the assignment of the experimentally observed PLI-2, based on the comparison to the spectroscopic and crystallographic experimental results, which will be detailed below.
Infrared spectroscopy
In our previous paper [12] we reported infrared spectroscopic measurements on [Ru(NO)2(PCy3)2Cl]BF4 at 10 K, exhibiting
signatures of at least three photoinduced linkage isomers (PLI). The PLI-2 state can be isolated when irradiating with 405 nm above 90 K, since PLI-1 and PLI-3 completely relax to the ground state at this temperature. In order to check the signature and determine the maximum population of the PLI-2 state at 100 K, we performed infrared spectroscopic measurements at this temperature.
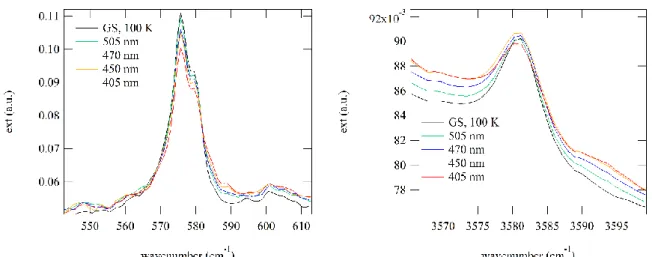
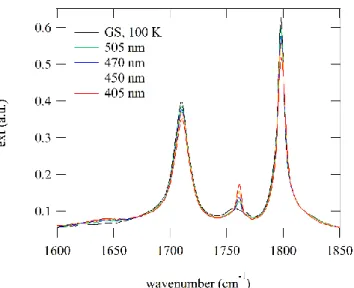
Figure 1: Population of the photoinduced linkage isomer PLI-2 as a function of irradiation wavelength at 100 K.
As can be seen from Fig. 1, the GS bands at 1710 and 1798 cm−1
decrease and new bands arise at 1761 cm−1 and 1804 cm−1 as
well as a broad band at 1640 cm−1 (see Fig. S1 in ESI for a
difference plot). The band appearing at 1761 cm−1 is a signature
of the PLI-2 state. The maximum population of PLI-2 is obtained by irradiation with 405 nm. The exact population is hard to determine due to the peak overlap of the ground state and PLI bands. However, the analysis of the decrease of the surfaces of the harmonic of the NO stretching vibration at 3581 cm−1 as well
as the δ(Ru-N-O) deformation mode at 576 cm−1 yields about
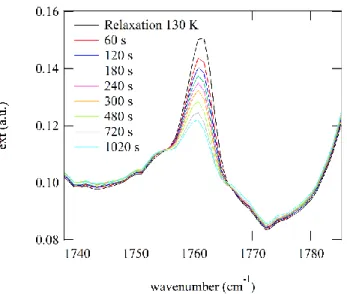
15(5)% population (see Fig. S2 in ESI). The stability of the PLI-2 at 100 K was checked by keeping the temperature constant during 15 hours, no measureable relaxation could be detected within this time span. However, the exposure to the infrared light of the spectrometer measurement beam gradually depopulates PLI-2 back to the ground state (not shown here). A further relaxation measurement was performed at 130 K, and a lifetime of about 5 minutes was determined for this temperature, as illustrated in Fig. 2, assuming a mono-exponential decay (Fig. S3 in ESI). This relaxation measurement allows again to clearly identify the two vibrational bands at 1761 and 1804 cm−1, which correspond to PLI-2 (Fig. S3 in ESI). There
is no observable change at 1640 cm−1, indicating that this band
belongs to another PLI. Compared to the models proposed by DFT, the observed vibrational bands seem to fit best with the model MS1, although the calculation underestimates the value of the antisymmetric vibration by about 40 cm−1.
Figure 2: Relaxation of PLI-2 at T = 130 K, as evidenced by the decrease of its characteristic band at 1761 cm−1.
Visible absorption spectroscopy
In order to detect the spectral signature of the three different PLI states and confirm the isolation of PLI-2 at 100 K, visible absorption spectra have been collected using a complete sequence of photoexcitation (at 405 nm, 660 nm, and 980 nm), and temperature variation (from 12 K to 140 K), all details are given in the ESI. Figure 3 shows the results of several optical absorption measurements at low temperature (12 K). In order to separate the contributions of the different PLI, we performed irradiation at low temperature and then heated gradually to 140 K, since according to the IR results, PLI-1 relaxes at about 60 K, 2 around 130 K and 3 around 90 K. Additionally PLI-2 can be erased by infrared light, e.g. 980 nm. The difference spectra (Fig. 3) therefore allow characterising selectively the three PLI states. From the difference spectra we obtain the low-energy transitions of the different PLI: 2.12 eV and 1.74 eV for PLI-1, 2.56 eV and (probably) 1.25 eV for PLI-2 and 2.48 eV and 2.07 eV for PLI-3.
Figure 3: Difference visible absorption spectra during photoexcitation at 12 K with 405 nm light, and subsequent heating to 60 K, 90 K, and 140 K.
Photocrystallography
The structural signature of the PLI-1 state of [Ru(NO)2(PCy3)2Cl]BF4 has been reported in our previous paper
from photocrystallographic measurements performed at 10 K [12]. According to the infrared and UV/Vis spectroscopic analysis (vide supra), the PLI-2 state can be selectively populated by light using an appropriate choice of irradiation wavelength and temperature. We have indeed found that by raising the temperature slightly above 90K, PLI-1 and PLI-3 completely relax to the ground state, so that the PLI-2 state may be isolated in the crystal by irradiation at 100 K with 405 nm light.
Figure 4: Section of the photo-difference map in the RuN1N2 plane with isocontour of ±0.1 eÅ−3 (red, negative; blue, positive).
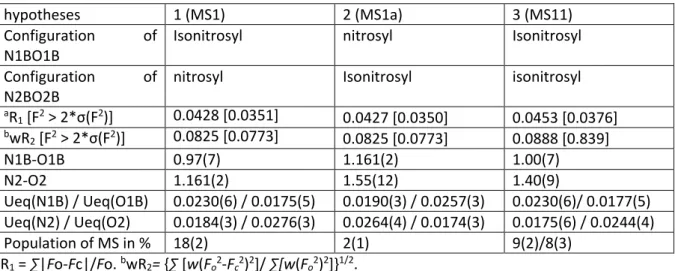
The corresponding photodifference map (Fig. 4) exhibits several specific features which provide evidences for the GS to PLI-2 state structural reorganisation: the Ru atom is slightly displaced in the direction opposite to the N1-O1 nitrosyl group, the Cl atom is also displaced, with an increased N2-Ru-Cl angle in the PLI-2 state with respect to the GS. The linear N2-O2 group does not show strong modifications, while negative difference electron density is observed at the N1 and O1 positions and correlatively a positive peak is located in the neighbourhood of N1. These observations point to a major change on the N1O1 ligand, which thus might be the signature of an isonitrosyl Ru-O1B-N1B configuration in the metastable PLI-2 state, corresponding to the MS1 model from DFT. This hypothesis was tested using a simple structural split model considering two configurations for the bent N1-O1 nitrosyl (N1A-O1A in the GS, and O1B-N1B in the PLI-2 state with an isonitrosyl Ru-O1B-N1B configuration) which was further refined using SHELXL. The population of O1B-N1B was refined, and the N1B (resp. O1B) atomic displacement parameters were constrained to O1A (N1A); this was the only structural constraint applied. The structural refinement converged smoothly to R1=0.0428 (wR2=0.0824) with a meaningful population of PLI-2 state of 18(2)%. We also tested the two other hypotheses proposed from the DFT calculations for PLI-2, i.e., MS1a and MS11. The results are less convincing with respect to the structural
refinement, for MS1a the obtained population is near to zero and for MS11 the displacement parameters for the N2 and O2 atoms are not consistent (see ESI for refinement details). Based on the photocrystallographic results, we therefore favour the DFT model MS1. The corresponding structural parameters are given in Table 3, in comparison to the DFT results for the MS1 hypothesis, and illustrated in Figure 5.
Figure 5: Structural model of the PLI-2 state upon photo-excitation at T = 100 K.
The major structural signature of the PLI-2 state is a bent isonitrosyl configuration for the N1-O1 ligand with an elongated Ru-O1B distance (d(Ru-O1B) = 2.14(3)Å), a shortened O1B-N1B distance (d(N1B-O1B) = 0.97(7)Å) and a Ru-O1B-N1B angle of 125(4)°. As for the GS, the Ru atom is located in a distorted vOC-5, displaced by 0.3298(2) Å from the basal plane formed by the two phosphorus atoms, the chlorine atom and the linear nitrosyl group; this is only slightly lower than the GS value (0.3612(2) Å at 10 K). It is noteworthy that at the exception of the N1-O1 group, all the other structural parameters do not differ significantly from the GS values (Table 2). This is at variance from the PLI-1 state for which a larger reorganization
of the intramolecular structure occurs in the PLI-1 state. The general structural reorganisation upon GS to PLI-2 photoswitching is illustrated in Figure 6.
Figure 6. Schematic representation of the structural distortion characteristic of the GS to PLI-2 photo-switching in [Ru(NO)2(PCy3)2Cl]BF4. The GS and PLI-2 states are represented in blue and red respectively.
Table 3: Selected bond distances (Å), angles (°), and vibrations for the GS (100 K) and PLI-2 (100 K) of [Ru(NO)2(PCy3)2Cl]BF4.
Experiment DFT
Distance d(Å) GS PLI-2 Δ(PLI-2 – GS) GS PLI-2 (= MS1) Δ(PLI-2 – GS)
Ru-Cl 2.3787(4) 2.3778(4) -0.0009(4) 2.410 2.365 −0.045 Ru-N1 (O1B) 1.860(1) 2.14(3) +0.28(3) 1.865 2.097 +0.234 Ru-N2 1.7443(14) 1.746(1) +0.002(1) 1.777 1.770 −0.007 Ru-P1 2.4517(4) 2.4541(4) +0.0024(4) 2.484 2.480 −0.004 Ru-P2 2.4781(4) 2.4815(4) +0.0034(4) 2.463 2.458 −0.005 Angle (°) Ru-N1-O1/Ru-O1-N1 136.7(1) 125(4) -12(4) 137.8 133.4 −4.4 Ru-N2-O2 179.6(1) 179.2(2) -0.40(2) 179.3 174.2 −5.1 Cl-Ru-N1/Cl-Ru-O1 102.06(5) 103.2(11) +1.1(1) 101.1 94.5 −6.6 Cl-Ru-N2 154.28(5) 155.20(5) +0.92(5) 153.3 164.0 +10.7 IR bands (cm−1) νsym(NO) 1798 1804 +6 1810 1813 +3 νasym(NO) 1710 1761 +51 1712 1723 +9
Discussion
Table 3 summarises the experimental and theoretical results on the PLI-2 in [Ru(NO)2(PCy3)2Cl]BF4. There is
convincing agreement between the various parameters, especially the Ru-O bond length and the Ru-N-O angle as well as the frequencies of the NO stretching vibration show the same trends in theory and experiment upon photoconversion. These are very strong indicators that we indeed observed an isonitrosyl, κO, linkage isomer. As observed in other NO compounds [18-20] the Ru-O bond length is considerably longer than the Ru-N bond length, however in the present case the Ru-O-N angle is very similar to the Ru-N-O angle leading to almost overlapping geometries. There exist a few cases of mononitrosyl compounds where a PLI of an already bent NO group was investigated. Namely {PtNO}8 compounds have been studied by DFT and infrared spectroscopy [21,22]. In
[Pt(NH3)4Cl(NO)]Cl2, the ν(NO) vibration shifts by +120 cm−1 from 1673 to 1793 cm−1 and in [Pt(NH3)4(NO3)(NO)]
(NO3)2 by +69 cm−1 from 1744 to 1815 cm−1. The corresponding structural changes, calculated by DFT, yielded a bent
O-bound PLI with a significant increase of the Pt-O bond length (2.715 Å) compared to the N-bound GS (2.1779 Å). The rotation of the NO group is similar to what is observed in the present case, a turnover from 118° to 127°. A further argument supporting an O-bound PLI in [Ru(NO)2(PCy3)2Cl]BF4 is the fact that 2 is more stable than
PLI-1, i.e., the energy barrier separating it from the GS is higher for PLI-2. This is well known from mononitrosyl complexes, where the isonitrosyl, κO, configurations are in general more stable than the side-on, κ2N,O,
configurations [2, 19]. A further analogy is the fact that the PLI-2 can be depopulated by irradiation with infrared light, again a well-known property of isonitrosyl isomers in mono-nitrosyl complexes [8].
It is interesting that both the already known PLI-1 and the here described PLI-2 state occur on the bent NO group in this vOC-5 type structure. The linear NO group only adapts slightly to the novel configuration, but seems not to adopt itself linkage isomer configurations. We have thus demonstrated that in one complex at least three structurally different PLI can be generated, the structure of two PLI have been determined by photocrystallography, the third one has been identified by spectroscopic methods. In consequence we can state that there exist many different M-N-O geometries, corresponding to minima in the potential energy surface. Which of these minima is occupied depends on the local environment of M-N-O, the chemical bonding properties, as well as the excitation wavelength and temperature. After optical excitation, a suitable relaxation path must exist in order to reach the corresponding minimum in the new structure, without relaxing back to the ground state. This is only possible, if there is no crossing with the ground state potential along the reaction coordinate. Furthermore, the cross section for depopulation needs to be smaller than that for population at the chosen wavelength, in order to obtain a significant amount of PLI.
In summary, we observed that the isonitrosyl, κO, and side-on, κ2N,O, structures represent only two boundary
structures of a possibly much larger number of metastable PLI geometries for NO complexes.
Conclusions
We have found conclusive evidence for an oxygen-bound photoinduced linkage isomer in the compound [Ru(NO)2(PCy3)2Cl]BF4. In this compound two out of three PLIs were structurally characterized up to now, both are
found on the bent NO ligand, the linear NO merely reacts on the light-induced changes of its bent partner.
Conflicts of interest
There are no conflicts to declare.
Acknowledgements
We are grateful for measurement time on the X-ray diffraction platform PMD²X of the Institut Jean Barriol. This work was partly supported by the French PIA project “Lorraine Université d’Excellence”, reference ANR-15-IDEX-04-LUE, and the CPER (SusChemProc). S.E.K is grateful for the ERASMUS+ travel grant, and was partially funded by the National Science Centre in Poland (SONATA grant No. 2014/15/D/ST4/02856).
References
1 J. L. Burmeister, Coord. Chem. Rev. 1968, 3, 225.
2 P. Coppens, I. Novozhilova, A. Y. Kovalevsky, Chem. Rev., 2002, 102, 861. 3 J. H. Enemark and R. D. Feltham, Coord. Chem. Rev., 1974, 13, 339. 4 M. J. Rose and P. K. Mascharak, Coord. Chem. Rev., 2008, 252, 2093.
5 H. Giglmeier, T. Kerscher, P. Klüfers, D. Schaniel and T. Woike. Dalton Trans. 2009, 42, 9113.
6 D. Schaniel, M. Imlau, T. Weisemoeller, T. Woike, K. W. Krämer and H. U. Güdel, Adv. Mater., 2007, 19, 723. 7 M. Goulkov, D. Schaniel and T. Woike, J. Opt. Soc. Am. B, 2010, 27, 927.
8 D. Schaniel and T. Woike, Phys. Chem. Chem. Phys., 2009, 11, 4391. 9 T. Ishikawa and K. Tanaka, Z. Kristallogr., 2008, 223, 334.
10 N. Casaretto, S. Pillet, E.-E. Bendeif, D. Schaniel, A. K. E. Gallien, P. Klüfers and T. Woike, IUCrJ, 2015, 2, 35. 11 N. Casaretto, S. Pillet, E.-E. Bendeif, D. Schaniel, A. K. E. Gallien, P. Klüfers and T. Woike, Acta Cryst., 2015, B71, 788. 12 N. Casaretto, B. Fournier, S. Pillet, E.-E. Bendeif, D. Schaniel, A. K. E. Gallien, P. Klüfers and T. Woike, CrystEngComm,
2016, 18, 7260.
13 A. K. E. Gallien, D. Schaniel, T. Woike and P. Klüfers, Dalton Trans., 2014, 43, 13278. 14 S. Grimme, J. Antony, S. Ehrlich, H. Krieg, J. Chem. Phys. 2010, 132, 154104–154119
15 F. Neese, The ORCA program system, Wiley Interdiscip. Rev.: Comput. Mol. Sci. 2012, 2, 73–78.
16 Rigaku Oxford Diffraction. (2017) CrysAlis CCD and CrysAlis RED (Versions 1.171.38.46), Rigaku Oxford Diffraction. Yarnton, England.
17 G. M. Sheldrick, Acta Cryst. C, 2015, 71, 3.
18 D. V. Fomitchev and P. Coppens, Inorg. Chem., 1996, 35, 7021.
19 B. Cormary, I. Malfant, M. Buron-Le-Cointe, L. Toupet, B. Delley, D. Schaniel, N. Mockus, T. Woike, K. Fejfarova, V. Petricek and M. Dusek, Acta Cryst. 2009, B65, 612.
20 G. A. Kostin, A. O. Borodin, A. A. Mikhailov, N. V. Kuratieva, B. A. Kolesov, D. P. Pishchur, T. Woike and D. Schaniel. Eur. J. Inorg. Chem., 2015, 4905.
21 D. Schaniel, T. Woike, B. Delley, D. Biner, K. W. Krämer and H. U. Güdel, Phys. Chem. Chem. Phys., 2007, 9, 5149. 22 D. Schaniel, T. Woike, N.-R. Behrnd, J. Hauser, K. W. Krämer, T. Todorova and B. Delley, Inorg. Chem., 2009, 48,
Supplementary material
Evidence for a photoinduced isonitrosyl isomer in ruthenium dinitrosyl
compounds
D. Schaniel, N. Casaretto, E.-E. Bendeif, T. Woike, A. K. E. Gallien, P. Klüfers, S. Kutyla, R. Kaminski, G. Bouchez,
K. Boukheddaden and S. Pillet
Fig. S1. Difference spectra at T = 100 K showing the characteristic changes, decrease of GS bands at
1710 and 1798 cm
−1and growth of new bands (PLI-2) at 1761 cm
−1and 1804 cm
−1as well as a broad
band at 1640 cm
−1.
Fig. S2. Population of the photoinduced linkage isomer PLI-2 as a function of irradiation wavelength
at 100 K. The GS δ(NO) band at 576 cm
−1(left) and harmonic of ν
sym
(NO) at 3581 cm
−1(right)
Fig. S3. (left) Difference spectra during relaxation at 130 K. Decrease of the characteristic bands at
1761 and 1804 cm
−1of PLI-2 and corresponding increase of the GS bands at 1710 and 1798 cm
−1.
(right) Mono-exponential fit to the decrease of the peak area of the 1761 cm
-1band at T = 130 K,
yielding a lifetime of 305(30) s.
VISIBLE ABSORPTION SPECTROSCOPY
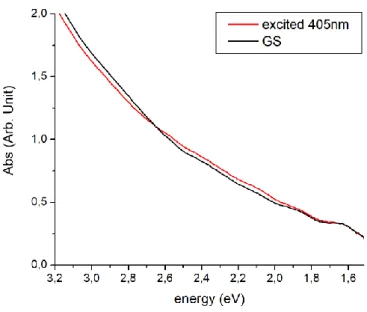
Visible absorption spectra were collected on KBr pellets as a function of temperature and
photoexcitation. Fig. S4 shows the corresponding spectra in the ground state and upon photoexcitation
at 405 nm. We can detect significant but weak changes in the spectrum, a decrease in absorption in
the 3.2-2.6 eV energy range, and an increase above 2.6 eV. The changes are much more obvious by
plotting the difference absorption spectrum (Fig. S5). These changes in the absorption spectrum
correspond to the population of PLI-1, PLI-2, and PLI-3.
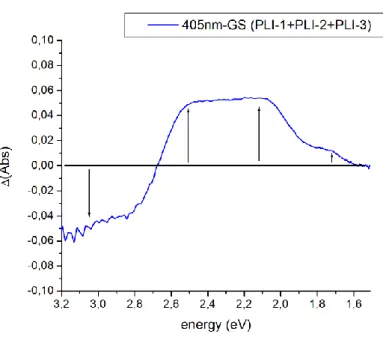
Fig. S5. Difference visible absorption spectrum during photoexcitation at 12 K. The photoexcited
spectrum contains contributions from GS, PLI-1, PLI-2, and PLI-3.
According to the infrared spectroscopy results, the spectral signature of the three PLI states can be
isolated by raising the temperature to appropriate values. Raising to 60 K allows to relax PLI-1, so that
the difference spectrum between 60K and those collected at 12 K after photoexcitation corresponds
directly to the contribution of PLI-1. Similarly, raising further to 90 K allows to relax PLI-3, and raising
to 140 K allows to relax PLI-2 (see Fig. 6 in the manuscript).
It has been shown in the infrared analysis that photoexcitation at 10 K with 405 nm light and
subsequent exposure to infrared light depopulates PLI-2. The corresponding sequence has been
measured with visible optical spectroscopy, the results are given in Figure S6. The difference spectrum
is very similar to the PLI-2 contribution isolated by temperature raising to 140 K (see Fig. 3 in the
manuscript), which indicates that 980 nm photoexcitation could depopulate PLI-2.
Fig. S6. (left) Visible absorption spectra in the ground state (GS) at 12 K, after photoexcitation at 405
nm, and photoexcitation at 405 nm with subsequent photoexcitation at 980 nm. (right) difference
absorption spectrum highlighting the effect of 980 nm photoexcitation.
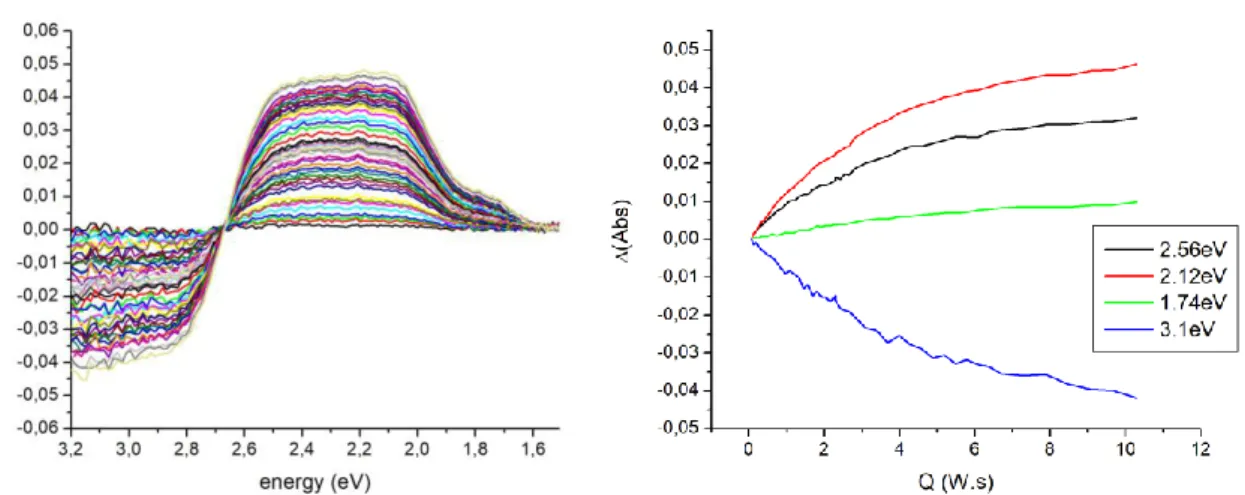
We have further followed the evolution of the spectrum as a function of time with constant 405 nm
irradiance at 12 K starting from the sample in the GS state. Fig. S7 (left) shows the corresponding
evolution of the difference absorption spectrum as a function of Q. Fig. S7 (right) shows the evolution
at selected relevant energies corresponding to characteristics of the three different PLI states: 2.56 eV
(pure PLI-2 state contribution), 2.12eV (almost pure PLI-1 state), 1.74 eV (strong contribution of PLI-3
state), 3.1 eV (depopulation of GS). The evolution follows the same trend at the four energies, which
indicates that the different PLI states are populated in parallel by 405nm photoexcitation at 12K We
do not observe any successive population.
Fig. S7. (left) Difference absorption spectra upon 405 nm photoexcitation at 12 K. (right) evolution at
selected relevant energies: 2.56 eV, 2.12 eV, 1.74 eV, and 3.1 eV.
PHOTOCRYSTALLOGRAPHY
Refinement of the ground state structure
The crystal structure of the ground state was refined using the SHELXL2014 software. All non-H atoms
were refined anisotropically. The PCy
3ligand exhibits a disorder on one of the cyclohexane rings, which
was taken into account using two split orientations for that fragment (respective refined populations
of 0.777(2) and 0.223(2)). The [BF
4]
−anion also exhibits disorder on two orientations (respective
refined populations of 0.812(7) and 0.188(7)). Hydrogen atoms were generated at their ideal positions,
and treated using a riding model, constraining the isotropic displacement parameters to 1.2 times
those of the attached C atom.
Refinement of the photo-excited structure
The single crystal sample was irradiated at 100 K with a diode laser of 405 nm (P = 90 mW) for 60 min
in the complete dark, until the photo-stationary state was reached. According to the infrared results,
at this temperature and irradiation wavelength, the PLI-2 metastable state can be selectively
populated with a sufficiently high population. We have indeed found that by raising the temperature
slightly above 90 K, PLI-1 and PLI-3 completely relax to the ground state, so that the PLI-2 state may be
isolated in the crystal by 405 nm irradiation. The corresponding photodifference map (Figure 3 in the
manuscript) exhibits several specific features which provide evidences for the GS to PLI-2 state
structural reorganization, no evidence for PLI-1 is detected. The crystal in the photo-excited state
therefore corresponds to a random distribution of GS and PLI-2 species. In a first step, a structural
refinement has been tested considering the complete molecular structure of the ground state as a
rigid group and the PLI-2 state as an additional molecular conformation. This is called a split model.
Such a strategy was used successfully in our previous determination of the PLI-1 structure in
[RuCl(NO)
2(PPh
3)
2]BF
4(Casaretto et al., IUCrJ (2015). 2, 35-44). In the present case, this strategy does
not converge to a satisfactory situation. A meaningful structural refinement was reached starting from
the GS structural model, and splitting only the bent nitrosyl with N1A-O1A in the GS position, and
N1B-O1B in the PLI-2 configuration.
From this point, different hypotheses concerning the possible configurations of the two nitrosyl groups
in the PLI-2 state were tested. The results of these refinements can be estimated, based on the
refinement agreement statistics, obtained structural parameters, and atomic displacement
parameters (ADPs) for the nitrogen and oxygen atoms of the two nitrosyl groups. These results are
summarized in table S1.
It is to be noted that the disorder characterized for the ground state (one of the cyclohexane ring, and
the [BF
4]
−) persists in the photo-excited state and was also treated using a split model. The obtained
positions and refined populations for the split positions differ only marginally from the ground state.
As a matter of fact, the values obtained at the convergence of our best refinement model are : 0.767(2)
and 0.233(2) for the cyclohexane ring, and 0.805(7) and 0.195(7) for the tetrafluoroborate anion. This
is furthermore consistent with the fact that the corresponding fragments do not show any contribution
in the photo-difference map.
Table S1. Refinements details for the different hypotheses for PLI-2.
hypotheses
1 (MS1)
2 (MS1a)
3 (MS11)
Configuration
of
N1BO1B
Isonitrosyl
nitrosyl
Isonitrosyl
Configuration
of
N2BO2B
nitrosyl
Isonitrosyl
isonitrosyl
a
![Table 1: Crystallographic data and refinement details for [Ru(NO) 2 (PCy 3 ) 2 Cl]BF 4 at 100 K in the ground and photo-irradiated states](https://thumb-eu.123doks.com/thumbv2/123doknet/14439571.516660/4.893.69.431.112.573/table-crystallographic-refinement-details-ground-photo-irradiated-states.webp)
![Table 3: Selected bond distances (Å), angles (°), and vibrations for the GS (100 K) and PLI-2 (100 K) of [Ru(NO) 2 (PCy 3 ) 2 Cl]BF 4](https://thumb-eu.123doks.com/thumbv2/123doknet/14439571.516660/7.893.64.844.789.1061/table-selected-bond-distances-angles-vibrations-pli-pcy.webp)