A photoionization mass spectrometric and threshold
photoelectron-photoion coincidence study of vinylbromide (C
2H
3Br) in the vacuum
ultraviolet range of 6-21 eV
A. Hoxhaa,1, S.-Y. Yua,2, R. Lochta,, H.-W. Jochims b, B. Leyha,
a
Laboratoire de Dynamique Moléculaire, Département de Chimie, Institut de Chimie Bât.B6c, Université de Liège, Sart-Tilman par B-4000 Liège 1, Belgium
b
Institut fur Physikalische und Theoretische Chemie, Freie Universität Berlin, Takustraβe 3, D-14195 Berlin, Germany
1
Now at Fertilizers Europe, B-1160 Brussels.
2 On leave of absence from the Graduate University, Chinese Academy of Sciences, Beijing, People's Republic of China.
ABSTRACT
The dissociative photoionization of vinyl bromide (C2H3Br) has been investigated by
photoionization mass spectrometry (PIMS) and time-of-flight threshold photoelectron-photoion coincidence (TOF-TPEP-ICO) spectrometry using synchrotron radiation. The photoionization efficiency curves of the three most abundant ions, i.e. C2H3Br+, C2H3+ and
C2H2+, are measured and analyzed in detail. A C2H3+/Br- photoion-pair formation process has
been detected for the first time. Some arguments are provided in favor of the electronic excitation of the C2H3+ fragment and of the isomerization of the C2H2+ ions. The breakdown
diagram for these ions in the 9.8-21 eV photon energy range, derived from TOF-TPEPICO mass spectra, is discussed. The involvement of the successive C2H3Br+ ionic states and the
role of autoionization of C2H3Br Rydberg states are emphasized. For the two minor HBr+ and
Br+ fragment ions only the breakdown diagrams are measured and appearance energies are derived.
Keywords:
Synchrotron radiation; Photoionization mass spectrometry; Threshold photoelectron-photoion coincidence; Ionization; Dissociation; Ion-pair processes; Autoionization; Breakdown
diagram; Isomerization; C2H3Br
1. Introduction
Halogenated methanes and ethylenes are compounds of great interest in chemistry. They are also important intermediates in the chemical industry. On the other hand, there is increasing evidence of their role in several critical environmental issues and more specifically in ozone depletion. In particular, bromine has a 50-fold higher efficiency of ozone destruction compared to chlorine. However "though extensively investigated, the existing knowledge ... is not commensurate with their importance" [1].
We investigate in detail the ionization and dissociation dynamics of halogenated ethylenes, which can serve as models of substitution effects on unsaturated systems [2,3]. We particularly focused our attention on vinyl bromide because the large polarizability of bromine is expected to favor cluster formation. In contradistinction with vinyl fluoride and vinyl chloride, dimers and trimers of vinyl bromide are easily observed in pure or seeded molecular beams [4].
In order to reach the necessary prior knowledge of the energetics and reactivity of the vinyl bromide monomer we investigated it by vacuum UV photoabsorption [5] and photoelectron spectroscopic [6] techniques. We reported already about the unimolecular bromine-loss reaction dynamics from vinyl bromide ions using the maximum entropy method [7]. Other members of the halogenated ethylenes family have also been investigated [8,9],
The low resolution photoionization efficiency curves of C2H3Br+, C2H3+ and C2H2+ in
the 9-19 eV range have already been reported by Lohr et al. [10] back to 1975. However, they could not clearly resolve the fine structures induced by autoionization of Rydberg states.
In 2004, Qian et al. [11] reported a high-resolution pulsed field ionization-photoelectron-photoion coincidence (PFI-PEPICO) study of C2H3Br. The unimolecular
dissociation C2H3Br+ → C2H3+ +Br has been analyzed in great detail close to threshold.
Thermochemical quantities and dissociation energies have been derived.
Using mass-analyzed threshold ionization (MATI)-photodissociation yield spectroscopy, Lee and Kim [12] measured time-of-flight profiles of C2H3+. Their analysis
showed that the B~2A"excited state of C2H3Br+ undergoes internal conversion to the ground
state from which it dissociates after several hundred picoseconds.
At nearly the same time, Lago and Baer [13] reported about the heats of formation of C2H3+, C2H3Br+ and C2H3Br2+ from C2H3Br and l,1,2-C2H3Br3 by using the threshold
photoelectron-photoion coincidence (TPEPICO) technique. The breakdown curves of e.g. C2H3Br+ and C2H3+ have been accurately measured between 11.4 eV and 12.1 eV and ∆fH298K
values have been derived for C2H3+ and several other species as well.
Except for the C2H3+ +Br channel in the 11.8-12.0 eV photon energy range [11,13] the
breakdown diagram of the vinyl bromide cation is not available, to our knowledge, in the literature. The C2H3++Br- ion-pair formation has never been investigated earlier. In
complement to our previous work [5-7], we will report in the present paper on the photoionization mass spectrometry and the threshold photoelectron-photoion coincidence spectroscopy between 8 eV and 20 eV photon energy. Furthermore, the autoionization fine structure observed in the photoionization efficiency curve of the molecular ion will be analyzed with the help of the Rydberg states assignments deduced from our photoabsorption spectroscopic work [5]. The two most important fragment ions in the energy range investigated, i.e. C2H3+ and C2H2+, will be examined. The characteristics of their yield curves
will be discussed. The observed appearance energies will be compared to thermochemical data and previous measurements. A forthcoming paper [14] will focus on the maximum entropy analysis of the translational kinetic energy released on the C2H2+ fragment measured
by photoionization.
2. Experimental
We used the vacuum UV light from the synchrotron radiation provided by the electron storage ring BESSY (Berlin). Two distinct experiments have been performed: (i) the yields of the mass analyzed molecular and fragment ions have been measured by photoionization at variable wavelengths and (ii) the breakdown diagram of the molecular ion into its different dissociation channels has been determined using TOF-TPEPICO as a function of the photon energy.
In the first experiment, dedicated to photoionization mass spectrometry (PIMS), the vacuum UV monochromator is a modified M-225 McPherson with 1.5 m focal length (instead of 1 m in the original version) on the 1 m NIM-2 beam line. A laminar Zeiss grating is used for efficient reduction of the second spectral order (1200 1/ mm gold coated). A quadrupole mass spectrometer is used to mass analyze the ions. Output pulses are registered by a 100 MHz counter. Light detection required for normalizing the spectra is provided by a sodium salicylate sensitized photomultiplier. The entrance and exit slits adjusted at 200 µm width gave about 0.2 nm wavelength resolution. To avoid the second order contribution to the ion-pair formation signal, a LiF window was used in the 7.0-11.8 eV range. The photon energy scale of the monochromator has been calibrated at the zeroth order and checked with the Ar+ photo-absorption spectrum between 15.7 eV and 15.9 eV photon energy.
The threshold photoelectron-photoion coincidence spectrometer (TPEPICO) has been described in detail elsewhere [15]. Only a brief overview will be given here. The gas introduced through an effusive inlet is photoionized by radiation dispersed by a 3 m normal incidence monochromator (2400 1/mm Pt-grating) on the 3 m-NIM-1 beam line. Energy selection of ions is achieved by detecting them in coincidence with threshold (ZEKE) photoelectrons. Nonzero kinetic energy electrons are discriminated in a steradiancy analyzer. A small fraction of non-zero kinetic energy electrons emitted in the direction of the steradiancy analyzer is also detected (hot electron tail). However, their contribution to the coincidence signal is shown to be very low. The total resolution achieved including the photon and electron energy was about 12 meV. The time-of-flight (TOF) mass spectrometer can be used either in linear or in reflectron mode, each equipped with a microchannel plate detector. In the experiments reported here it was used as a linear TOF only. It was operated in a pulsed mode, i.e. once a ZEKE photoelectron is detected a high draw out field pulse of 270 V is applied. The TOF-TPEPICO spectrum is obtained by using the arrival of the electron and that of the ion on their corresponding detectors as the start and the stop signals for the time-of-flight measurement. It has been checked that false coincidences were negligible.
The C2H3Br sample used in these experiments, purchased from Aldrich (98% purity,
inhibited with 200 ppm mono ethyl ether hydroquinone), was introduced without further purification.
3. Experimental results
3.1. Photoionization mass spectrometry (PIMS)
The photoionization efficiency curves (PICs) of the parent ion and of the two major fragments C2H3+ and C2H2+ have been recorded by PIMS between 9.5 eV and 20.0 eV (Fig.
1). For reference in the discussion, the photoabsorption spectrum of C2H3Br [5] is displayed
in the same figure.
The PIC of the C2H3Br+ molecular ion is divided in two very distinct parts: (i) the
low-energy part extending from threshold up to 11 eV and (ii) the high-low-energy part from 11 eV to 20 eV. The features observed in the latter energy range are listed in Table 1 together with the photoabsorption data and assignments proposed earlier [5],
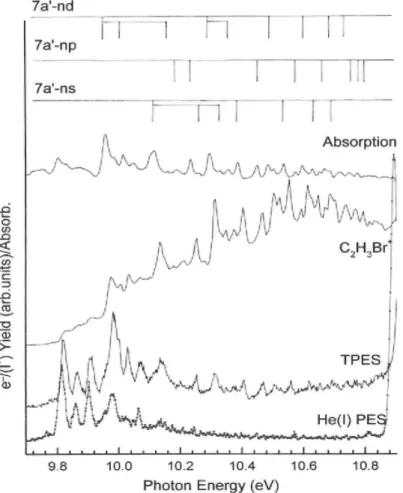
The highly structured part of the molecular ion PIC below 11 eV is expanded in Fig. 2. The Hel photoelectron spectrum (PES), the threshold photoelectron spectrum (TPES) [6] and
the photoabsorption spectrum (PAS) [5] are reproduced in the same figure.
Earlier assignments [5] are also included in this figure for the main features. They are listed in Table 2 together with the PAS and TPES data [5,6] and the most recent PFI-TPES data [11].
Several critical energies are observed in the PIC of the C2H3+ fragment. These are
obtained by measuring the energy position of the intersection between the linear extrapolations of the successive parts of the PIC and the baseline taking into account the noise on the photoion signal. The lowest appearance energy at 298 K is AE298K = 11.78 ±0.05 eV.
Higher lying onsets are detected at 12.11 ± 0.04 eV, 12.79 ±0.04 eV, 13.99 ± 0.02 eV and 15.70 ± 0.05 eV successively. Fig. 3 represents the C2H3+ PIC recorded in the 7-11.8 eV
photon energy region using a LiF filter. A low intensity C2H3+ ion current is detected far
below 11.8eV, with onsets at 8.60 ± 0.20 eV and 9.81 ± 0.04 eV. A clear increase of the slope of the ion current signal is detected at 10.82 ± 0.01 eV.
The lowest threshold for the C2H2+ fragment is located at AE298K(C2H2+) = 12.62 ±0.07
eV. Additional onsets are measured at 14.18 ± 0.06 eV, 14.83 ± 0.05 eV, 16.3 ± 0.1 eV and 18.5 ± 0.1 eV. Table 3 compares the appearance energy data deduced in the present work with those reported in the literature.
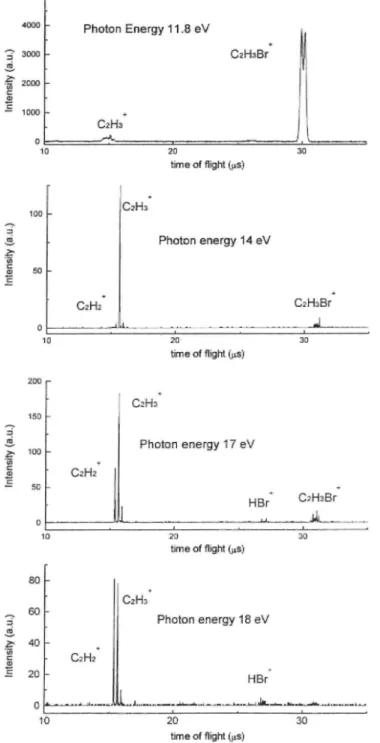
Fig. 1.: Photoionization efficiency curves of the three most abundant ions C2H3Br+, C2H3+
and C2H2+ observed in the C2H3Br mass spectrum between 10 eV and 20 eV photon energy.
Table 1:Maxima position (eV) of the structures observed at high photon energy in the C2H3Br+ PIC and comparison with the photoabsorption (PAS) data and assignments in the
same energy range. PAS [5] PICa This work Assignments [5] 10.90 10.96 11.04 11.11 11.14 Ã2A' (0, 0)b -(ν8) -(ν6) -(ν6+ν8) -(ν6+3ν9) 11.4 11.37 11.85 4a'→σ*/1a"→ 5s or 4db 6a' → 4pb 12.6 12.58 13.10/13.20/ 13.29/13.41 } 5a' → 3pb/4a' → 3s Vibr. autoion.b 13.7 13.64/13.70 13.93/14.15 14.37 (max) } 3a' → σ*/4a' → np 5a' → 4p/4a' → 3pb 4a' → 4s 14.5 14.59/14.69 15.01/15.25 15.83 Vibr. Autoion.b 3a' → 3sb 16.8 16.50 3a' → 4pb a
Experimental accuracy ±0.015 eV.
b
Assignments proposed in the present work.
3.2. Threshold photoelectron-photoion coincidence spectroscopy
The unimolecular dissociation of vinyl bromide ions at selected photon energies between 10 eV and 21 eV has been investigated by TOF-TPEPICO. Typical TOF spectra recorded at different photon energies are displayed in Fig. 4. The two most important dissociation channels correspond to the lowest dissociation limits, i.e. the Br and the [H, Br] losses. Relative intensities were obtained by numerical integration of the peak areas normalized to the total coincidence ion signal. The resulting TPEPICO breakdown diagram is displayed in Fig. 5. Except for the Br+ and the HBr+ ions, which remain however minor dissociation products over the whole photon energy range investigated, no other fragments than C2H3+ and C2H2+ were detected.
4. Discussion
Photoabsorption above the first ionization threshold of a molecule leads either to direct ionization or to a superexcited molecule, which can decay by autoionization and/or dissociation. The relative importance of these competitive ionization mechanisms can be estimated from the photoionization efficiency curve. The direct photoionization cross section in the threshold region corresponds to a step function while the formation of a superexcited state is a resonant process.
Fig. 2: Photoionization efficiency curve of the C2H3Br+ molecular ion in the threshold
region from 9.7 eV up to 10.9 eV photon energy. The photo-absorption spectrum of C2H3Br
and its assignments (vertical bars), the Hel (PES) and threshold (TPES) photoelectron spectra are included.
4.1. The C2H3Br+ molecular ion (Figs. 1, 2 and 5)
As shown in Table 2, the adiabatic ionization energy measured in the present work is IEad(C2H3Br) = 9.811 ± 0.007 eV by photoionization mass spectrometry and, less accurately,
9.80 ± 0.01 eV by TPEPICO. These values agree with previous photoionization results [10] and with our earlier photoelectron spectroscopic measurement [6], i.e. 9.804 ± 0.004 eV.
The MATI-spectroscopic study of Lee and Kim [12] yields 9.8171±0.0006eV whereas Qian et al. [11] measured IEad(C2H3Br, X~2A") =9.8200 ±0.0015 eV. The latter authors
pinpointed the discrepancy between the different results clustering them in two groups: those around 9.80eV and those of about 9.82 eV. The analyses of their own spectra lead them to conclude that the discrepancy between [11,6] has to result from a calibration error. However, it has to be stressed that (i) in the Hel-PES [6] the energy scale is calibrated by using six reference IEs spread between 12.3 eV and 15.6 eV, (ii) in the TPES [6] the Xe photo-absorption spectrum has been used for calibration and finally (iii) in the present experiments two different monochromators were calibrated independently using identical references, i.e. the Xe+ or Ar+ photoabsorption spectrum. An identical (in magnitude and by sign) systematic calibration error in these four separate experiments is very unlikely. The absence of a hot
band in the Hel-PES indicates that no temperature effect is involved in the observed discrepancy.
Table 2 :Position in energy (eV) of threshold and autoionization structures in the C2H3Br+
PIC and comparison with corresponding features as measured in the photoabsorption (PAS) [5], the threshold photoelectron (TPES) [6], the photoionization (PIMS) [10] and the pulsed-field photoelectron (PFI-PES) [11] spectra.
PIC Assignments [5]a PAS [5] PFI-PES [11] TPES [6] This work [10] ns np nd 9.803 9.82 9.804 9.811 9.81 [4p(0,0)] 9.826 - 9.852 9.856 9.87 na 9.956 - 9.948 9.901 9.98 4d(0,0) 10.015 - 10.016 10.011 10.04 4d(v8) 10.053 10.033 10.046 10.031 10.20 na 10.104 - - 10.101 4d(v6) 10.116 10.1385 10.122 10.13 5s(0,0) 10.164 - - 10.151 4d(v6 + 2v9) 10.264 10.254 10.240 10.253 10.25 5s(v6) 10.296 10.3164 10.296 10.281 5d(0,0) 10.332 - - 10.334 10.32 5s(v6 + 2v9) 10.358 10.3548 10.362 10.349 5d(v8) 10.387 10.394 10.374 10.38 10.420 6s(0,0) 10.488 10.4723 10.492 10.470 10.48 6d(0,0) 10.501 10.5062 - 10.505 10.51 na 10.536 10.528 10.546 10.523 10.56 7s(0,0) 10.597 10.598 10.604 10.595 10.61 7d(0,0) 10.630 10.631 10.640 10.629 10.62 10.650 8s(0,0) 10.671 10.6775 - 10.674 10.66 8d(0,0) 10.686 10.690 10.680 10.685 10.68 9s(0,0) 10.707 10.7122 - 10.703 10.70 9p(0,0) 10.720 10.7285 10.7385 10.732 - na 9d(0,0) 10.748 10.7447 10.7543 - 10.739 10p(0,0) 10.776 10.7773 10.771 10.772 11p(0,0) 10.797 10.7982 10.797 10.794 12p(0,0) 10.813 10.8173 10.820 10.815 13p(0,0) a
All nℓ-Rydberg states converge to the second Ã2A" ionization limit of C2H3Br: (0,0) refer to vibrationless
transitions and "na" are not assigned.
Up to the second ionization energy (IE) of the molecule located at 10.899eV [6], the overall photoionization efficiency curve (Fig. 1) shows sharp features superimposed on a step-like continuum. A significant increase of the cross section is observed at the second IE. It is followed by a much less structured region showing only broad features at energies close to those observed in the photo-absorption spectrum.
Table 2 compares the energy positions of the sharp features be-low the second IE obtained in this work and with other techniques [5,6,10,11]. The good correlation observed among these data pleads for common assignments. Except at the onset and above 10.70 eV, only 7a' → ns and 7a' → nd Rydberg series are observed in the PIC while 7a' → np shows up only above 10.70 eV. These series all converge to the second ionization limit of C2H3Br
detected at 10.899 ± 0.004 eV by Hel-PES, 10.902 ±0.004 eV by TPES [6], 10.9156 ± 0.0015 eV by PFI-TPES [11] and 10.9150 ± 0.0006 eV by MATI-spectroscopy [12]. A few still unassigned features (Table 5 in Ref. [5]) are also observed in the present PIC of the C2H3Br+
molecular ion, e.g. at 10.031 eV and 10.505 eV.
Despite a quite similar photon energy resolution, a few structures can be detected above 10.9 eV in the PIC of C2H3Br+ but not in the PAS. This might indicate that these states
are favored in the direct ionization and/or autoionization channels.
Fig. 3. Photoionization efficiency curve of C2H3+ in the photon energy range corresponding to
the ion-pair formation process. The threshold region is shown on an expanded intensity scale. The photoabsorption spectrum corresponding to the most intense region is also displayed. Vertical bars locate the successive onset energies.
A series of steps and maxima are observed in the 10.9-11.1 eV photon energy range (Fig. 1). These structures can be assigned to the direct ionization and the vibrational excitation of C2H3Br+ in its Ã2A' ionic state. The interpretation of the present data is strongly supported
by the vibrationally resolved CIS spectroscopy applied to the C2H3Br+ (Ã2A') state [5] which
clearly shows the absence of any autoionization contribution to the population of the lowest vibrational levels from threshold up to 12eV photon energy.
Several features are observed at 11.37eV, 11.85eV and 12.58 eV. Furthermore, on the high energy side of the last peak four steps are located between 13.10 eV and 13.41 eV with a regular spacing of 0.10 ±0.01 eV. These structures likely correspond to peaks hidden in the broad strong peaks of the PAS of C2H3Br at 11.4 eV and 12.6 eV [5] but which are enhanced
in the ionization channels.
As mentioned in Table 1, the 11.4 eV peak was assigned to the 4a' → σ* valence-valence transition [5]. It could also correspond to la" → 5s or 4d Rydberg transition with an effective quantum number n* = 3.95. We assign the maximum at 11.85 eV to the 6a' → 4p Rydberg transition with n* = 3.51. Both states autoionize to the higher part of the Ã2A' state potential well as shown by the low resolution CIS spectrum of Ã2A' state [5] recorded at 11.9eV.
At 12.58 eV and above, the PAS bands were assigned to 4a' → 3s and/or 5a'→ 3p Rydberg transitions with n* = 1.99 and 2.41, respectively. These Rydberg states have to autoionize to the X~2A" and Ã2A' ionic states [5] with the largest contribution to the latter as shown by the CIS spectrum. The four step like features at 13.10eV, 13.20eV, 13.29eV and
13.41 eV could correspond to vibrational autoionization to higher levels of the C2A' ionic state at 12.9 eV.
Both the PAS [5] of C2H3Br and the PIC of C2H3Br+ show poorly resolved complex
structures in the 13-15 eV photon energy range. The Hel-photoelectron signal almost vanishes between 13.7 eV and 14.5 eV, the latter energy corresponding to the adiabatic ionization energy of the C2H3Br+-D
~2
A' state. This energy region is populated by autoionization as clearly highlighted by the TPES of C2H3Br [6] which shows a high intensity photoelectron
signal below 14.5 eV. As indicated in Table 1 several valence-valence and valence-Rydberg transitions are likely involved.
At higher photon energies the PIC of C2H3Br+ shows weak broad bands at about 15.8
eV and 16.5 eV. Possible assignments, proposed in Table 1, correspond to Rydberg transitions 3a'→ 3s (n* = 2.12) and 3a' → 4p (n* = 2.61). It might be stressed here that the Rydberg state centered on 16.5 eV has been shown to autoionize, giving rise to dissociative ionization [7].
From the TPEPICO data (Fig. 5), the fractional abundance of the parent ion decreases very rapidly above 12 eV. A small amount of parent ions (5-10% of the total ion signal) is detected between 12.5 eV and 14.5 eV, most probably due to the hot electron tail of the electron energy analyzer (see Section 2). Any influence of a kinetic shift can be ruled out because the residence time in the ion source is in the microsecond range and the rate constant very close to the threshold has been estimated at 3.5 × 10⁵ s-1 [7],
Table 3: Appearance energies (AE) (eV) of the fragment ions measured at 298 K and calculated at 0 K as observed in the C2H3Br mass spectrum. Comparison is made with
previous data in the literature [10,11].
PIC This work Fragment Ions PIC Lohr et al. [10] 298 K PFI-TPEPICO
Qian et al. [11] and Lago et al. [13] OK TPEPICO This work 298 K At 298 K At OK C2H3+/Br- - - - 8.6 ± 0.2 8.7 ± 0.2 - 9.81 ± 0.04 9.87 ± 0.04 - 10.82 ±0.01 10.88 ±0.01 C2H3+ 11.85 ±0.1 11.9010 [11] 11.8 ±0.1 11.78 ±0.05 11.84 ±0.05 - 11.902 [13] 12.11 ±0.04 12.17 ±0.04 - 12.79 ±0.04 12.85 ±0.04 - 13.99 ±0.02 14.05 ± 0.02 - 15.70 ±0.05 Max: 16.82 15.76 ±0.05 C2H2 + 12.5 ±0.1 - 12.5 ±0.2 12.62 ±0.07 12.68 ±0.07 - - 14.18 ±0.06 14.24 ± 0.06 - - 14.83 ± 0.05 14.89 ± 0.05 - 16.25 ±0.1 16.3 ±0.1 16.3 ±0.1 - - 18.5 ±0.1 18.6 ±0.1 HBr+ 14.1 ± 0.2 - 14.0 ± 0.2 - - Br+ 18.2 ±0.2 - 18.0 ±0.2 - -
4.2. The C2H3+ fragment ion (Figs. 1, 5 and 6a)
The C2H3+ fragment ion dominates the TOF mass spectrum (Fig. 4) and is by far the
dominant dissociation channel between 12 eV and 16 eV photon energy (Fig. 5). The C2H3+
detail in Fig. 6a. Vertical bars indicate several critical energies detected at 12.11 ±0.04 eV, 12.79 ± 0.04 eV, 13.99 ± 0.02 eV and 15.70 ± 0.05 eV successively. The lowest appearance energy measured at 298 K is AE298K = 11.78 ± 0.05 eV. Based on the standard approach
developed by Traeger and McLoughlin [16], the AE at 0K is determined to be 11.84±0.05 eV. The next successive AEs at 0 K have been determined accordingly.
A very weak C2H3+ ion current has also been detected between 8eV and 11.5 eV (Fig.
3). Onsets are observed at 8.60 ± 0.2 eV, 9.81 ± 0.04 eV and 10.82 ± 0.01 eV. The C2H3+ fragment ion can be generated by the two following reactions:
C2H3Br + hv→C2H3++ +Br- (a)
C2H3Br + hv→C2H3+ + Br + e- (b)
corresponding to the photoion-pair formation and to dissociative ionization processes, respect-tively.
The lowest threshold energy for process (a) can be predicted using the most recent and accurate data reported in the work of Qian et al. [11], where D0(C2H3-Br) = 3.433 ± 0.029 eV
and IEad(C2H3) = 8.468 ± 0.029 eV, and the electron affinity of the Br atom EA(Br) = 3.365 ±
0.003 eV [17]. The predicted appearance energy at 0 K is equal to 8.54 ± 0.03 eV. For process (b), Qian et al. report AE0K=11.9010 ± 0.0015 eV [11].
These values have to be compared with the AEs determined at 0K in the present work, i.e. 8.7±0.2eV and 11.84 ± 0.05 eV for processes (a) and (b), respectively (Table 3). The large uncertainty on the former value results from the low signal-to-noise ratio close to the threshold (Fig. 3).
The AE0K(C2H3+)obtained for process (b) is in good agreement with the most recently
reported thresholds [11,13]. The AE0K = 8.7 ± 0.2 eV corresponds to the ion-pair process (a)
and is reported for the first time in this work. The present C2H3+ PIC shows an apparently
continuous and structureless increase of ion intensity. The lowest ion-pair formation onset should therefore be assigned to
C2H3Br + hν → C2H3++( X~1A'/X~1A1) + Br- (1S0) (1)
likely through a direct transition to the dissociation continuum of a neutral ion-pair state. The vinyl cation C2H3+ exists in a bridged (X~1A', most stable structure) or a Y-shaped (X~1A1)
configuration, with a predicted energy difference of 0.2 eV [7,11,18]. The value IEad(C2H3) =
8.468 ± 0.029 eV [11], used for the onset estimation, corresponds to the bridge-structured (or non-classical) ion.
Two critical energy positions at 9.81 ± 0.04 eV and 10.82 ± 0.01 eV correspond to a noticeable intensity increase (Fig. 3), suggesting the opening of new dissociation channels. To the former onset corresponds the (7a"-1)4p Rydberg state measured at 9.803 eV [5]. We are then led to assume a predissociation step enabling the decay of this Rydberg state to the ion-pair dissociation continuum. At 10.81 eV, the ion-ion-pair formation cross-section increases steeply, likely due to the opening of a new reaction channel. An energy difference of (2.2 ± 0.2) eV with respect to the lowest onset could involve the excitation of one of the reaction products, e.g. the C2H3+ ion. To our knowledge, no spectroscopic data on the electronically
calculations applied to C2H3+ have been reported by Chaudhuri and Freed [18], These authors
confirmed our earlier prediction [7] that the bridged structure is the most stable isomer of C2H3+. They further calculated the vibrational wavenumbers associated to both the bridged
and Y-shaped structures confirming that the Y-shaped structure is not a transition state. The vertical electronic excitation energies to singlet and triplet states were also calculated. For the Y-shaped C2H3+ ion [18] the lowest predicted vertical excitation energy (EE) is about 2.5-2.6
eV (depending upon the calculation level) above the ground state and corresponds to the 13A2
state. Our own calculations at the QCISD/CC-PVTZ level confirm these energy data (Table 4). However, the 13A2 state in the C2v point group appears to be a transition state (one
imaginary frequency) which leads, upon geometry optimization in the Cs point group, to a
stable 13A" state (all frequencies are real) with a distorted Y-shape (Fig. 7). In agreement with Chaudhuri and Freed [18], we calculate for this state an adiabatic EE of 1.99eV with respect to the ground state bridge-structure. The vertical EE is equal to 6.14eV. This large difference between the adiabatic and vertical EEs results from the important geometry change from the ground state bridge-shape to the 13A" distorted Y-structure. A possible ion-pair formation pathway for the threshold at 10.82 eV would be
whose AE at 0 K can be estimated at 8.54 + 1.99 = 10.53 eV, in satisfactory agreement with the observed 0 K onset at 10.88 eV.
Fig. 5.: Breakdown diagram of C2H3Br+ as derived from TPEPICO spectra. Energy ranges
covered by the successive ionic states of C2H3Br+ as determined by Hel-PES are included in
the diagrams.
The 0 K onset at 11.84 ± 0.05 eV lies significantly below the adiabatic ionization energy of the B~2A" state at 12.0749 eV [12], but within the 11.85 eV PAS band assigned to 6a' → 4p Rydberg transition (Table 1 ). In the TPES a significant electron signal is detected in this energy range. The C2H3+ fragment ion may therefore be generated by the reactions:
The upper reaction involves autoionization of a Rydberg state to the Ã2A' cationic state. As argued in earlier reports on the kinetic energy release data for the dissociative photoionization of C2H3Br in the C2H3+ channel this unimolecular reaction is barrierless [7,19],
Slope changes are clearly observed at 12.11 ± 0.04 eV and 12.79 ± 0.04 eV in the C2H3+ PIC (see vertical bars in Fig. 6a). The 0K appearance energies are equal to 12.17 eV
and 12.85 eV, respectively. With respect to the lowest onset, excess energies of 0.3±0.1eV and 1.0±0.1eV are involved at 12.11 eV and at 12.79 eV, respectively.
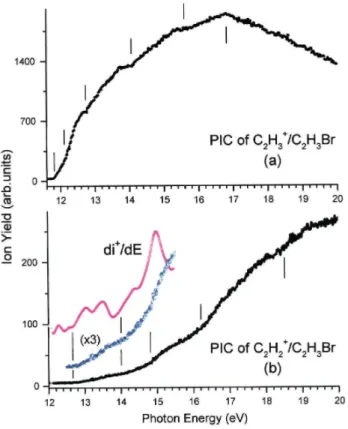
Fig. 6. Photoionization efficiency curve of the (a) C2H3+ and (b ) C2H2+ fragment ions in the
12-20 eV photon energy range. The FFT smoothed first derivative (di+/dE) of the C2H2+ ion
current is included. Vertical bars locate the successive onset energies.
The 0 K threshold at 12.17 ± 0.04 eV corresponds to a marked slope increase in the C2H3+ PIC (Fig. 6a). At this energy, a plateau is reached in the breakdown diagram of this
fragment ion measured by TPEPICO (Fig. 5). This threshold is close to the adiabatic ionization energy of the C2H3Br+(B~2A") state. Lee and Kim [12] investigated the
photodissociation yield of C2H3+ at hv ≥ 12.0749 eV and concluded that the photoexcited
C2H3Br +
(B~2A") cation remains in the B~2A" state for several hundred picoseconds prior to
internal conversion to the ground state where it dissociates. The 0 K threshold at 12.85 ± 0.04 can be assigned to the opening of the C~2A' ionization continuum: the vertical ionization energy for this state is equal to 12.95 eV [6].
The AE0K(C2H3+) = 14.05 ± 0.02 eV is very clearly observed in the C2H3+ PIC (Fig.
6a). The energy difference between the present onset and the lowest AE at 11.84 ± 0.05 eV is 2.2±0.1eV. This threshold energy corresponds also to structures in the photoabsorption spectrum (Fig. 1 and Table 1) between 13.93 eV and 14.37 eV photon energy.
This latter observation has visible consequences on the TPES. Fig. 8 compares the HeI-PES and the TPES of C2H3Br in the 13.5-17.0 eV photon energy range as recorded in our
earlier work [6], An important signal is also observed below the adiabatic ionization energy of C2H3Br+_D
~2
A' (14.470 eV). It probably results from resonant population of the high-lying vibrational levels of the C~2A' ionic state through autoionization of the Rydberg states
identified in the 13.7-14.4 eV photon energy range. We therefore assign the PIC "step" extending from 13.99 eV to 14.5 eV to the following dissociation pathway
where the excess energy of 2.2 ± 0.1 eV is assigned to electronic excitation of the C2H3+
fragment. We remind that the same excitation process has been identified in the ion-pair formation process. The excitation of the Br atom in its 2P1/2 spin-orbit level requires 0.457 eV
[20] and the next excited level 4P5/2 of Br lies at 7.864 eV [20].
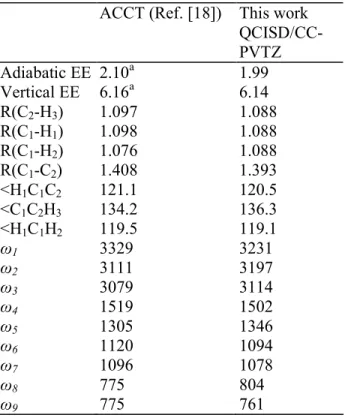
Table 4: Computed properties of the 13A" excited state of C2H3+. Energies are in eV,
distances in Å, angles in degrees and wavenumbers in cm-1. The excitation energies (EE) are measured with respect to the non-classical bridge-shape ground state ion.
ACCT (Ref. [18]) This work QCISD/CC-PVTZ Adiabatic EE 2.10a 1.99 Vertical EE 6.16a 6.14 R(C2-H3) 1.097 1.088 R(C1-H1) 1.098 1.088 R(C1-H2) 1.076 1.088 R(C1-C2) 1.408 1.393 <H1C1C2 121.1 120.5 <C1C2H3 134.2 136.3 <H1C1H2 119.5 119.1 ω1 3329 3231 ω2 3111 3197 ω3 3079 3114 ω4 1519 1502 ω5 1305 1346 ω6 1120 1094 ω7 1096 1078 ω8 775 804 ω9 775 761 a
Computed at the IVO-MCQDPT level.
As shown in Fig. 8, the 14.5-15.5 eV photon energy range fits exactly the Franck-Condon region for the excitation of the D~2A' state of the molecular ion. The C2H3+ fragment
ion production probably occurs through the predissociation of the D~2A' state. The com-parison of the HeI and TPES spectra shows strong modifications induced by autoionization. The vibrational structure, well resolved in the Hel-PES, appears strongly smoothed in the TPES. This apparent loss of resolution might result from an increase in the spectroscopic line density induced by additional autoionizing transitions.
It should also be stressed that the breakdown diagram obtained by TPEPICO (Fig. 5) shows that the C2H3+ dissociation channel still represents more than 80% of the total
Fig. 7. Equilibrium geometries of C2H3+ at the QCISD/CC-PVTZ level, (a) Y-shape X
~1A 1
state, (b) Bridge-shape X~1A1 state, (c) Excited 13A" state. Bond distances are given in A and
bond angles in degree.
In the C2H3+ PIC a broad resonance-like structure starts at 15.70 ± 0.05 eV and
reaches a maximum at about 16.8 eV. The energy interval of 15.7-16.6eV almost corresponds to the Franck-Condon region for excitation of the E~2A' state (Fig. 8). The breakdown diagram of the C2H3+ ion shows a marked decrease of its relative abundance from 80% to
about 60% which corresponds very clearly to the opening of a new dissociation channel (see Section 4.3). The TPES band corresponding to the E~2A' molecular ionic state is very similar, though strongly smoothed, to the corresponding Hel-PES band. Autoionization is likely involved. The (2A')4p Rydberg autoionizing state converging to the F~2A' ionic core (Table 1) has been identified in the PAS of C2H3Br [5] and its role has been highlighted in the
maximum entropy analysis of the translational kinetic energy distribution of C2H3+ resulting
from photoionization of C2H3Br with the NeI-resonance lines (16.67-16.85 eV) [7].
Fig. 8. Hel-PES and TPES spectra of C2H3Br in the ionization energy region of the D
~2
A' and E~2A' states as measured in Ref. [6].
4.3. The C2H2+ fragment ion (Figs. 1, 5 and 6b)
Figs. 1 and 5 show that the C2H2+ ion is the second most abundant fragment in the
mass spectrum of C2H3Br. Its fractional abundance obtained by TPEPICO varies from 0% to
10% between 12 eV and 16 eV photon energy. Above this range it steeply rises and C2H2+
becomes the most abundant fragment above 18 eV representing about 50% of the total ionization. The PIC of this ion is reproduced in Fig. 6b. Vertical bars locate the onset energies listed in Table 3.
The C2H2+ ions correspond to a formal [H, Br] loss and can be produced by
fragmentation of the molecular ion following two pathways:
The lowest thermodynamic threshold energy at 298 K for these two processes can be predicted by using the best recommended ∆fH298K values for the species involved in reactions
(c) and (d) [21] and following the procedure described by Traeger and McLoughlin [16]. The appearance energies predicted in this way are AE(C)298K(C2H2
+
) = 12.44 ±0.02 eV and AE(d)298K(C2H2+) = 16.19 ± 0.02 eV. These predicted values have to be compared with the
experimental threshold obtained by Lohr et al. [10] at 12.5 ± 0.1 eV and in the present work at 12.62 ± 0.07 eV by PIMS and 12.5 ± 0.2 eV by TPEPICO. Zero Kelvin experimental appearance energies are also provided in Table 3.
The C2H2+ PIC shows a slowly rising portion between 12.5 eV and 16 eV (Fig. 6b). To
measure more accurately the threshold energy, the PIC has been smoothed by Fast Fourier Transform and first differentiated [22]. The result is shown in Fig. 6b: the low energy side of the first peak is extrapolated to the baseline. The intercept leads to AE(c)298K(C2H2+) = 12.62 ±
0.07 eV taking into account the noise level on the ion signal. The reasonable agreement between the predicted onset energy and the experimental threshold energy suggests assigning it to
This dissociation asymptote correlates with A' and A" states in the Cs symmetry group. The
translational energy release distribution measured by photoionization and analyzed by the maximum entropy method (MEM) will be dealt with in a forthcoming paper [14], Furthermore, the energy range between the threshold and 14 eV corresponds to the Franck-Condon region of the C~2A state of C2H3Br+. The C
~2A' state is very likely predissociated and
the dissociation pathways (3) and (4) are in competition.
Above 14 eV, two noticeable slope changes are observed at 14.18 ± 0.06 eV and 14.83 ± 0.05 eV in the direct PIC of C2H2+ and in its first derivative. The energy differences with
respect to the lowest AE(C2H2+) are 1.56 ± 0.13 eV and 2.21 ± 0.12 eV, respectively. In the
TPEPICO breakdown curve of C2H2+ (Fig. 5) an increase of 3-10% of the relative abundance
of this ion is also observed between 14 eV and 16 eV. This energy is too low for electronic excitation of one of the two dissociation moieties. The first excited C2H2+(Ã2Σg+) state lies at
state is observed as a continuous absorption band starting at about 4.3 eV and with a maximum at 7 eV [24]. The first stable 3Π2 and 1Π states appear at 8.389 eV and 8.751 eV,
respectively [24].
We propose that the energy difference in the range 1.56-2.2 eV corresponds to the isomerization of the acetylene HCCH+ ion to the H2CC+ vinylidene (ethynylidene) structure.
This isomerization has been invoked in the dissociative electroionization of C2H2 in the C+,
C2+ and CH2+ dissociation channels [25]. The same process has been invoked for the
dissociation of doubly [26,27] and triply ionized [28] acetylene. However, to our knowledge, no experimental evaluation of the energy difference between the two singly ionized isomers exists in the literature. Quantum chemical calculations have been performed on the ionic vinylidene-acetylene cation isomerization [29-31]. Depending on the level of calculations, the vinylidene cation is predicted to be at 1.497 eV [29], 2.238 eV [30] and 1.713 eV [31] above the acetylene cation. Yu et al. [14] obtained recently an energy difference of 1.77 eV between the two isomers at the B3LYP 6-311+G** level. A transition state for isomerization has also been identified at 1.93 eV.
These arguments lead us to assign the threshold energy at 14.18 ± 0.06 eV to the dissociation pathway:
The high-energy part of the C~2A' (near 14.15 eV), the D~2A' and the low-energy part of the E~2A states are very likely initially populated.
The C2H2+ PIC shows an important cross-section increase at 16.3 ± 0.1 eV (Fig. 6b).
By TPEPICO, the breakdown diagram related to C2H2+ (Fig. 5) shows even more clearly a
sharp increase of the fractional abundance: from 10% at 16.3 ±0.1 eV it grows to 50% at about 18eV where this species becomes the most abundant ion in the TOF mass spectrum. This onset is very close to the appearance energy estimated for process (d) so that we suggest assigning the C2H2+ onset at 16.3 eV to the following dissociation pathway:
which has to involve the upper part of the E~2A' potential well up to 18 eV. Clearly (Fig. 1 in Ref. [6] ) the Hel-PES and even more the TPES bands related to this state extend up to at least 18 eV. The observation of the broad weak continuous band with a maximum at 16.8 eV in the PAS of C2H3Br [5] and at 16.5 eV in the PIC of C2H3Br+ (Table 1) suggests that
autoionization followed by predissociation takes place.
The threshold at 18.5 ± 0.1 eV is the last onset measured within the photon energy range investigated in the present work. It clearly corresponds to a further increase in the C2H2+
fragment ion yield. The energy difference between this threshold and the lower lying AE(C2H2+) = 16.3 ±0.1 eV is 2.2±0.2eV. A similar energy difference has been observed
the same arguments, we assign this onset to the following dissociation pathway via the F~2A state whose adiabatic ionization energy is measured at 18.18 ± 0.02 eV [6]:
4.4. The HBr+ and Br+ fragmentation (Fig. 5)
The two last but minor fragments observed in the TOF-TPEPICO experiment are the HBr+ and Br+ ions. The coincidence signal corresponding to the formation of these ions is very weak. Owing to the limited number of points in the breakdown diagram only approximate information can be inferred. The thresholds determined from the present breakdown curves agree with those obtained by Lohr et al. [10] using photoionization mass spectrometry. The lowest energy dissociation pathways leading to HBr+ and Br+, respectively are
for which the thermodynamic onset energies can be predicted by using the recommended data available [21] and the procedure of Traeger and McLoughlin [16], i.e. AE(e)298K(HBr+) =
12.69 ±0.05 eV and AE(f)298K(Br+) = 16.61 ±0.05 eV. The measured AEs are 14.0 ± 0.2 eV
and 18.0 ± 0.2 eV, respectively. The energy difference is 4.0 ± 0.4 eV and both experimental onsets are 1.3 ± 0.1 eV above the predicted values.
The low signal-to-noise ratio prevents us from detecting the thermochemical threshold. Of all excited state channels, the only one which cannot be a priori discarded corresponds to the production of Br+(1D) which lies at 1.414 eV above the 3P2 ground state
[20] and which is compatible with the observed 1.3 eV difference.
More realistically, the amount of 1.3 ± 0.1 eV could also be assigned to an excess translational kinetic energy released on the fragments during dissociation. This could be the case if the loss of C2H2 involves a reverse activation barrier and if reactions (e) and (f) are
sequential. The decrease of the relative abundance of HBr+ in the breakdown diagram at the onset of appearance of Br+ points in this direction. Furthermore, the energy interval of 4.0 ± 0.4 eV corresponds quite well to the dissociation energy of HBr+, i.e. D0(H-Br+) = 3.946 eV
[24].
5. Conclusions
To complete our spectroscopic work on vinyl bromide (C2H3Br), the dissociative
photoionization mass spectrometry (PIMS) and the threshold photoelectron-photoion coincidence (TPEPICO) techniques have been applied to investigate the dissociation of C2H3Br+ in most of its channels. The photoionization efficiency curves of the most abundant
ions, i.e. C2H3Br+, C2H3+ and C2H2+, have been measured. Several onset energies were
detected, discussed in detail and assignments are proposed. The production of C2H3+ by
involved. Some appearance energies of C2H2 are discussed in terms of the
vinylidene-acetylene isomerization. For the HBr+ and Br+ fragments, only the breakdown curves have been determined and appearance energies were derived. For all dissociation channels, the strong correlation between the appearance energies of the fragments and the Franck-Condon region of the successive ionic states is highlighted. In several cases the important role of autoionization has also been pointed out.
Acknowledgments
We sincerely thank Prof. Dr. K.-M. Weitzel (Universität Marburg, Germany) for having made his TPEPICO spectrometer available to us at the BESSY storage ring in Berlin. We are indebted to the University of Liège, the Freie Universität Berlin and the Bundes-ministerium fur Forschung und Technologie for financial support. A.H., R.L. and B.L acknowledge the European Community for financing this work through its successive programs (Contracts EU-HPRI-1999CT-00028 and RII 3CT-2004-506008). S.Y.Y. wishes to thank the University of Liège for a 2008-2010 post-doctoral grant.
References
[1] P. Fabian, O.N. Singh, in: P. Fabian, O.N. Singh (Eds.), Reactive Halogen Compounds in the Atmosphere, Springer-Verlag, Berlin, 1999.
[2] R. Locht, B. Leyh, K. Hottmann, H. Baumgärtel, Chem. Phys. 220 (1997) 217. [3] R. Locht, B. Leyh, D. Dehareng, K. Hottmann, H. Baumgärtel, J. Phys. B 43 (2010) 015102.
[4] A. Hoxha, B. Leyh, R. Locht, M. Malow, K.M. Weitzel, H. Baumgärtel, BESSY Jahresbericht (1998) 185.
[5] A. Hoxha, R. Locht, B. Leyh, H.W. Jochims, H. Baumgartel, Chem. Phys. 260 (2000) 237.
[6] A. Hoxha, R Locht, B. Leyh, D. Dehareng, K. Hottmann, H. Baumgärtel, Chem. Phys. 256 (2000) 239.
[7] A. Hoxha, R. Locht, A.J. Lorquet, J.C. Lorquet, B. Leyh, J. Chem. Phys. 111 (1999) 9259. [8] F. Güthe, R. Locht, B. Leyh, H. Baumgärtel, K.M. Weitzel, J. Phys. Chem. A103 (1999) 8404.
[9] E. Gridelet, D. Dehareng, R. Locht, AJ. Lorquet, J.C. Lorquet, B. Leyh, J. Phys. Chem. A109 (2005) 8225.
[10] W. Lohr, H.W. Jochims, H. Baumgärtel, Ber. Bunsengesel. Phys. Chem. 79 (1975)901. [11] X.M. Qian, K.C. Lau, C.Y. Ng, J. Chem. Phys. 120 (2004) 11031.
[12] M. Lee, M.S. Kim, J. Chem. Phys. 126 (2007) 154317. [13] A.F. Lago, T. Baer, J. Phys. Chem. A110 (2006) 3036. [14] S.-Y. Yu, R. Locht, B. Leyh, in preparation.
172(1998) 47.
[16] J.C. Traeger, R.G. McLoughlin, J. Am. Chem. Soc. 103 (1981) 3647. [17] H. Hotop, W.C. Lineberger, J. Phys. Chem. Ref. Data 14 (1985) 731. [18] R.K. Chaudhuri, K.F. Freed, J. Chem. Phys. 129 (2008) 054308. [19] B.E. Miller, T. Bear, Chem. Phys. 85 (1984) 39.
[20] CE. Moore, Atomic Energy Levels As derived from the Analyses of Optical Spectra, vol. II, Circ. 467, US Dpt. Commerce, NBS, US Gov. Print. Off., Washington, DC, 1952, p. 159. [21 ] S.G. Lias, J.E. Bartmess, J.F. Liebmann, J.L Holmes, RD. Levine, W.G. Mallard, J. Phys. Chem. Ref. Data 17 (Suppl. 1) (1988).
[22] R. Locht, J. Momigny, Int. J. Mass Spectrom. Ion. Phys. 7 (1971) 121.
[23] J.E. Reutt, L.S. Wang,J.E. Pollard, D.J. Trevor, Y.T. Lee, D.A. Shirley.J. Chem. Phys. 84 (1986) 3022.
[24] K.P. Huber, G. Herzberg, Molecular Spectra and Molecular Structure, Constants of Diatomic Molecules, vol. IV, Springer, New York, 1979.
[25] R. Locht, M. Davister, Chem. Phys. 195 (1995) 443.
[26] D. Duflot, J.-M. Robbe, J.-P. Flament, J. Chem. Phys. 102 (1995) 355.
[27] R. Flammini, E. Fainelli, F. Moracci, L. Avaldi, Phys. Rev. A 77 (2008) 044701. [28] A. Hishikawa, A. Matsuda, E.J. Takahashi, M. Fushitani, J. Chem. Phys. 128 (2008) 084302.
[29] P. Rosmus, P. Botschwina, J.P. Maier, Chem. Phys. Lett. 84 (1981) 71. [30] G. Frenking, Chem. Phys. Lett. 100 (1983) 484.


![Table 2 :Position in energy (eV) of threshold and autoionization structures in the C 2 H 3 Br + PIC and comparison with corresponding features as measured in the photoabsorption (PAS) [5], the threshold photoelectron (TPES) [6], the photoioni](https://thumb-eu.123doks.com/thumbv2/123doknet/6861360.192041/7.918.143.869.240.754/position-threshold-autoionization-structures-comparison-corresponding-photoabsorption-photoelectron.webp)