The photoionization dynamics of methyl iodide (CH
3I): a joint
photoelectron and mass spectrometric investigation
R Locht1, D Dehareng2, K Hottmann3, H W Jochims3, H Baumgärtel3 and B Leyh1
1
Département de Chimie, Institut de Chimie, Laboratoire de Dynamique Moléculaire, Bât. B6c, Université de Liège, Sart-Tilman par B-4000 Liège 1, Belgium
2
Centre d'Ingéniérie des Protéines, Institut de Chimie, Bât. B6a, Université de Liège, Sart-Tilman par B-4000 Liège 1, Belgium
3
Institut für Physikalische und Theoretische Chemie, Freie Universität Berlin, Takustraβe 3, D-14195 Berlin, Germany
Abstract
Threshold photoelectron (TPES) and photoionization mass spectrometric (PIMS) studies of CH3I in the
8-20 eV photon energy range are presented. The interpretation and assignments are supported by ab initio calculations. The TPES study shows many new discrete features in the Jahn-Teller split ground 2E (2A'-2A") state of CH3I
+
. A new continuous band starting at about 11.7 eV is detected. These observations are essentially correlated with autoionizing transitions. This interpretation is supported by constant ion state (CIS) spectroscopy. A large enhancement of the transitions to the 2A and 2E ionic states is ascribed to large autoionizing contributions. Based on the present calculations, the weak to very weak bands in the 18.0-23.0 eV photon energy range are mainly assigned to 2a1-1ionization and to double excitations corresponding essentially to the 2e-2 4a11
and 3a1-12e-14a11 configurations. The PIMS study allowed us to investigate in detail the ionization and
dissociation of CH3I leading to CH2 + , CH3 + , I+ and CH2I +
from the threshold up to 20 eV photon energy. The experimental data are compared to ab initio calculated dissociation energies. The threshold of appearance of CH3
+
, I+ and CH2I +
fragments is concentrated in the 12.2-12.7 eV photon energy range. All three exit channels are correlated with the ground state of CH3I+ via non-adiabatic transitions. All three fragment ions have to appear
through predissociation of the ionic 2E state and autoionizing dissociation from the (2E3/2)6p Rydberg state.
This interpretation is strongly supported by the photoabsorption spectrum measured recently in the same photon energy range. At higher energies, besides direct or predissociation of the 2A1 and 2E states of CH3I+,
autoionization is also suggested to contribute to the fragmentation in all decay channels. (Some figures in this article are in colour only in the electronic version)
1. Introduction
In a recent paper, we reported the results on the medium and high-resolution vacuum UV photoabsorption spectrum (PAS) of methyl-h3 iodide (CH3I) and its deuterated isotopomers CH2DI and CD3I [1].
This study covered the 5-20 eV photon energy range.
The photoionization studies of CH3I were mainly restricted to the ionization of the molecule. The
molecular ion has been investigated by most of the techniques available today and first initiated by conventional photoionization mass spectrometry (PIMS) [2-4] and fixed wavelength (He I) photoelectron spectroscopy [5-8]. The one-colour two-photon zero kinetic energy (ZEKE) photoelectron spectrum of CH3I has also been reported
[9]. A He (II)-photoelectron spectrum has been published by von Niessen et al [10] extending from 9 eV to 26 eV. Recently, using synchrotron radiation at hv = 85 eV, Holland et al [11] measured a photoelectron spectrum of CH3I between 9 eV and 28 eV. In particular, several bands between 18 eV and 23 eV are reported. Several
studies were dedicated to the importance of the autoionizing decay. These experiments were performed with photoion coincidence (PEPICO) at variable [12] wavelengths and threshold photoelectron-photoion coincidence (TPEPICO) [13] spectroscopies. More recently, a high-resolution pulsed field ionization photoelectron-photoion coincidence (PFI-PEPICO) study of CH3I has been reported [14].
Less usual techniques such as constant ion state (CIS) [15] and threshold photoelectron (TPES) [16] spectroscopies have also been applied and almost exclusively performed with synchrotron radiation as a light source.
Very scarce are, however, photoionization studies dedicated to the fragmentation of CH3I+. Most of
these works are restricted to CH3 +
ion formation. Traeger et al [17] measured the threshold energy of CH3 +
by PIMS and the ionic enthalpy of formation was inferred. More sophisticated techniques such as He I-PEPICO [18], TPEPICO [13] and PFI-PEPICO [14] have been used aiming at deducing more accurate thermochemical data on CH3+.
Most of our knowledge about the dissociative ionization of CH3I is derived from electron impact
experiments. Tsuda et al [19] investigated the ionization efficiency curves of CH3 +
and I+ by the retarding potential difference (RPD) technique of monochromatized electron beams. Several onset energies were determined and assigned. Using the same technique Martin et al [20] reported the electron impact determination of onset energies and deduced thermochemical data on CH2I
+
. Lossing and Semeluk [21] measured the ionization energy of the CH3 radical and the appearance energy of CH3
+
from CH3I using a double-hemispherical
electrostatic electron energy monochromator. With the same experimental setup, Holmes et al [22] measured onset energies for CH3-aXa+ (X = Cl, Br and I) and deduced thermochemical data for these ions.
More recently, Olney et al [23] studied the photoabsorption and photoionization of CH3I by dipole (e, e)
spectroscopy between 4.5 eV and 488 eV. The dissociative ionization of CH3I has been examined by dipole (e,
e+ion) spectroscopy in all possible dissociation channels. Their threshold energies and absolute differential oscillator strengths were measured.
To the best of our knowledge only one He I-PEPICO work [18] reported on the study of the dissociative ionization of CH3I into its three most important pathways, i.e. leading to CH3
+
, CH2I +
and I+. Branching ratios and a breakdown diagram of CH3I
+
into these channels were presented and discussed. While the impact of autoionization on the CH3I
+
molecular ion formation has been examined and commented abundantly, in none of the reviewed works has the role of these phenomena been considered on the fragmentation of CH3I
+
. Therefore, we intend to complete our photoabsorption study of CH3I by a dissociative
photoionization investigation to obtain a deeper insight into the photofragmentation processes. To achieve this goal the present work will report on high-resolution TPES and the dissociative photoionization of CH3I into its
fragments CH2+, CH3+, I+ and CH2I+ as observed from their respective onsets up to about 20 eV photon energy.
Vibrationally resolved resolution CIS measurements will also be reported. The previous results on the high-resolution vacuum UV photoabsorption spectroscopy of CH3I [1] will be essential to interpret the present results.
2. Experimental details
Two distinct experimental setups were used in this work. They have been described elsewhere [24, 25] and only the most salient features will be reported here. In all the experiments performed in this work we used the vacuum UV light from the synchrotron radiation provided by the electron storage rings BESSY I and BESSY II (Berlin).
2.1. Threshold photoelectron (TPES) and constant ion state (CIS) spectroscopy
For these experiments the light is dispersed by a 3 m normal incidence monochromator (on the 3 m NIM-1 beam line) equipped with a 2400 ℓ mm-1 Pt-grating. The entrance and exit slit widths were set at 200 µm. Owing to the second-order contribution at low photon energy, a LiF window is used when necessary, restricting the observations to an upper photon energy range of 11.8 eV. The photon energy scale is calibrated with rare gas photoabsorption and/or threshold photoelectron spectra to reach an accuracy of the order of 2-3 meV In the present case Xe was used and the value of the ionization energy IE (Xe+ - 2P3/2) = 12.130 eV [26] was adopted.
The light beam is focused into an ion chamber, in the focusing plane of a tandem electron spectrometer consisting of two 180° electrostatic deflectors. This spectrometer works at constant resolution, i.e. at constant pass energy E0. Its energy resolution, as measured by the full width at half maximum (FWHM) of a rare gas
peak, is given by ∆E/E0 = w/4R0 = w/104 where w and R0 are the slit widths (in mm) and radius (in mm) of the
sector field, respectively. In the present case, slits of 1.0 mm and a pass energy E0 = 1.1 V yield a resolution of 6
meV The spectra are normalized to the photon transmission function of the monochromator by measuring the light beam intensity through the photoelectron current of a gold diode inserted in the ion chamber in front of the monochromator exit slit. CIS spectra are recorded with the same instrument and more details on this technique are described elsewhere [25]. In this latter type of measurement the pass energy was set at E0 = 1.9 V providing
2.2. Photoionization mass spectrometry (PIMS)
For these experiments the synchrotron radiation is dispersed by a 1.5 m normal incidence monochromator (1 m NIM-2 beam line) which is a modified M-225 McPherson monochromator equipped with a laminar gold-coated Zeiss grating of 1200 ℓ mm-1. Entrance and exit slit widths of 100 µm provided a 0.1 nm wavelength resolution. Wavelength calibration is performed by recording the Ar+ (2P3/2-2P1/2) ion yield curve and
using the Ar+ ionization energy IE(Ar+ -2P3/2) = 15.759 eV [26]. The light beam focused on the centre of an ion
chamber is detected by a sodium salicylate sensitized photomultiplier positioned in front of the monochromator exit slit. The ions produced in the ion chamber are mass analyzed by a quadrupole mass spectrometer, detected by a channeltron multiplier and recorded by a 100 MHz counter. The ion signal is automatically normalized to the photon flux at all wavelengths.
2.3. Error estimations and data handling
The error estimations on the results presented in this work are the sum of (i) the calibration errors, (ii) the photon energy increments adopted for the signal recording and (iii) the standard deviation obtained from several experiments. The calibration error of 2-3 meV is about the same in all kind of experiments presented in this paper. The energy increments vary from 4 meV (in narrow energy range scans) to 20 meV for broad energy range threshold photoelectron spectra. In the former case the total error should be about 5 meV whereas in the latter a total error of about 15 meV is a realistic estimate. The photoionization efficiency curves were all recorded with photon energy increments of 10 meV and the error is estimated to be 15 meV. In the photoabsorption spectra covering the 6-20 eV range [1] an error of 15 meV has also been adopted. The PAS as presented in this work is in fact the result of a subtraction procedure (designated by ∆-plot in the following sections) used to enhance the low intensity structures superimposed on a strong background signal. For this purpose, the experimental curve is severely smoothed to simulate the underlying continuum which is then subtracted from the original spectrum. The smoothing procedure consists in filtering the experimental curve by fast Fourier transform. This procedure has been described previously [1] and has also been applied to photoionization efficiency curves.
3. Experimental results
3.1. The threshold photoelectron spectrum
At a pass energy E0 = 10 V of the electron energy analyzer the TPES of CH3I has been recorded
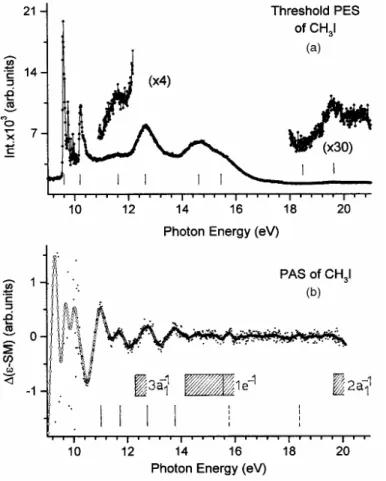
between 9.0 eV and 25 eV photon energy. Figure 1(a) shows the result between 9 and 21 eV.
Besides the crowded fine structure at low photon energy, several wide structureless bands are observed. As indicated by vertical bars the two most intense peaks at low energy are measured at 9.60 eV and 10.24 eV. At higher energies peak maxima are observed at 12.6 eV and at 14.8 eV with a shoulder at about 15.6 eV. An inset clearly shows a maximum at 11.6 eV. Furthermore, when amplified by a factor 30 a very weak signal is observed starting at 18.9 eV and peaking at 19.6 eV. As a support to our forthcoming discussion the ∆-plot of the PAS as handled by the procedure mentioned in section 2.3 is shown in figure 1(b). The maxima of the most significant structures are indicated by vertical bars at 11.0 eV, 11.68 eV, 12.7 eV, 13.8 eV, 15.8 eV and at 18.4 eV [1]. Ionization continua and the involved molecular orbitals are indicated by dashed areas in the same figure.
Using the experimental conditions listed in section 2.1, the TPES of a rare gas (Ar, Kr or Xe) is usually recorded to check (i) the energy discrimination function of the electron energy analyser and (ii) its energy resolution. A typical TPES for Ar has been obtained at E0 = 1.0 V of the analyser and is shown in figure 2. A
FWHM = 6 meV is measured. The nearest autoionizing state at 15.79 eV (generating 30 meV electrons) represents less than 2% of the intensity of the direct ionization peak at 15.763 eV. Under these conditions the TPES of CH3I has been measured between 9.400 eV and 10.500 eV photon energy. The result is shown in figure
3(a). The energy positions of the maxima measured in this spectrum are listed in the first column of table 1. Furthermore, to make the comparison easier, the PAS of CH3I is shown in figure 3(b) in the same photon energy
Figure 1. (a) The threshold photoelectron spectrum of CH3I over the 10-21 eV photon energy range. Vertical
bars locate vertical ionization energies. (b) The difference photoabsorption spectrum of CH3I in the same photon energy range. Vertical bars indicate critical energies.
Figure 2. The threshold photoelectron spectrum of Ar in the 15.7-16.0 eV photon energy range recorded under high-resolution (6 meV) conditions.
Figure 3. Details of (a) the first threshold photoelectron band of CH3I+ recorded at high resolution and (b) the
photoabsorption spectrum (PAS) of CH3I measured between 9.50 and 10.50 eV photon energy.
Figure 4. Constant ion state (CIS) photoelectron spectra recorded at three CH3I+ internal energies, i.e. (1)
9.570 eV, (2) 9.725 eV and (3) 9.804 eV. The ordinate of the latter curve is shifted by -0.1 unit, for clarity. The sum (∑) CIS curve is also displayed.
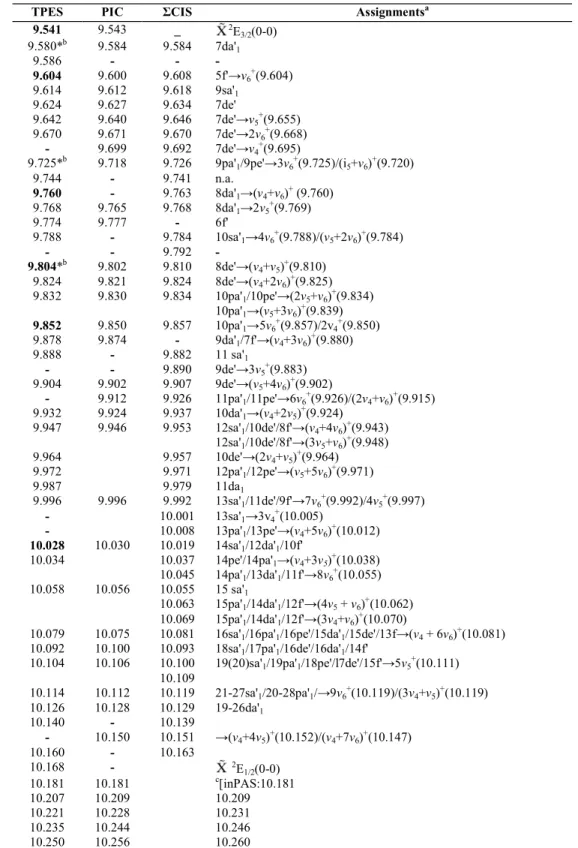
Table 1. Energy positions (eV) of fine structures in the threshold photoelectron (TPES) spectrum, photoionization efficiency curve (PIC) and total constant ion state (ΣCIS) spectrum measured in the present work.
TPES PIC ΣCIS Assignmentsa
9.541 9.543 _ 2 E3/2(0-0) 9.580*b 9.584 9.584 7da'1 9.586 - - - 9.604 9.600 9.608 5f'→v6+(9.604) 9.614 9.612 9.618 9sa'1 9.624 9.627 9.634 7de' 9.642 9.640 9.646 7de'→v5+(9.655) 9.670 9.671 9.670 7de'→2v6+(9.668) - 9.699 9.692 7de'→v4+(9.695)
9.725*b 9.718 9.726 9pa'1/9pe'→3v6+(9.725)/(i5+v6)+(9.720)
9.744 - 9.741 n.a. 9.760 - 9.763 8da'1→(v4+v6)+ (9.760) 9.768 9.765 9.768 8da'1→2v5+(9.769) 9.774 9.777 - 6f' 9.788 - 9.784 10sa'1→4v6+(9.788)/(v5+2v6)+(9.784) - - 9.792 - 9.804*b 9.802 9.810 8de'→(v4+v5)+(9.810) 9.824 9.821 9.824 8de'→(v4+2v6)+(9.825) 9.832 9.830 9.834 10pa'1/10pe'→(2v5+v6)+(9.834) 10pa'1→(v5+3v6)+(9.839) 9.852 9.850 9.857 10pa'1→5v6+(9.857)/2v4+(9.850) 9.878 9.874 - 9da'1/7f'→(v4+3v6)+(9.880) 9.888 - 9.882 11 sa'1 - - 9.890 9de'→3v5+(9.883) 9.904 9.902 9.907 9de'→(v5+4v6)+(9.902) - 9.912 9.926 11pa'1/11pe'→6v6+(9.926)/(2v4+v6)+(9.915) 9.932 9.924 9.937 10da'1→(v4+2v5)+(9.924) 9.947 9.946 9.953 12sa'1/10de'/8f'→(v4+4v6)+(9.943) 12sa'1/10de'/8f'→(3v5+v6)+(9.948) 9.964 9.957 10de'→(2v4+v5)+(9.964) 9.972 9.971 12pa'1/12pe'→(v5+5v6)+(9.971) 9.987 9.979 11da1 9.996 9.996 9.992 13sa'1/11de'/9f'→7v6+(9.992)/4v5+(9.997) - 10.001 13sa'1→3v4+(10.005) - 10.008 13pa'1/13pe'→(v4+5v6)+(10.012) 10.028 10.030 10.019 14sa'1/12da'1/10f' 10.034 10.037 14pe'/14pa'1→(v4+3v5)+(10.038) 10.045 14pa'1/13da'1/11f'→8v6+(10.055) 10.058 10.056 10.055 15 sa'1 10.063 15pa'1/14da'1/12f'→(4v5 + v6)+(10.062) 10.069 15pa'1/14da'1/12f'→(3v4+v6)+(10.070)
10.079 10.075 10.081 16sa'1/16pa'1/16pe'/15da'1/15de'/13f→(v4 + 6v6)+(10.081) 10.092 10.100 10.093 18sa'1/17pa'1/16de'/16da'1/14f'
10.104 10.106 10.100 19(20)sa'1/19pa'1/18pe'/l7de'/15f'→5v5+(10.111) 10.109 10.114 10.112 10.119 21-27sa'1/20-28pa'1/→9v6+(10.119)/(3v4+v5)+(10.119) 10.126 10.128 10.129 19-26da'1 10.140 - 10.139 - 10.150 10.151 →(v4+4v5)+(10.152)/(v4+7v6)+(10.147) 10.160 - 10.163 10.168 - 2 E1/2(0-0) 10.181 10.181 c[inPAS:10.181 10.207 10.209 10.209 10.221 10.228 10.231 10.235 10.244 10.246 10.250 10.256 10.260 10.360 10.356 10.320] a
Energy position of Rydberg transitions from [1]; nℓ(a'1 or e') stays for (2E1/2)ℓ(a1 or e). b
Energy positions for which CIS spectra were recorded.
c
3.2. The constant ion state spectra
CIS spectra of CH3I have been recorded under the same monochromator conditions but with E0 = 1.9 V
for the electron energy analyser, corresponding to about 10 meV threshold electron energy resolution. Figure 4 shows a typical set of three CIS curves recorded at (1) 9.570 eV, (2) 9.725 eV and (3) 9.804 eV photon energy respectively. The CIS-sum curve ∑(1+2+3) is also presented in the same figure. The energy positions of the fine structures observed in the CIS curves are reproduced in the third column of table 1.
3.3. Dissociative photoionization coupled to mass spectrometry
The mass spectrum recorded at 20 eV photon energy shows three groups of masses: (i) around m/e = 140 (CH3I+, CH2I+ and CHI+), (ii) around m/e = 127 (HI+ and I+) and (iii) around m/e = 14 (CH2+ and CH3+).
CHI+ (m/e = 140) and HI+ (m/e = 128) are of too small an intensity to allow us to measure their ionization efficiency curves: the CH3
+
signal dominates the mass spectrum.
The photoionization efficiency curves (PIC) of the molecular ion CH3I +
and the fragment ions CH2 + , CH3 + , I+ and CH2I +
have been recorded between 9.5 eV and 20 eV photon energy with 10-20 meV increments. The operating conditions maintained during these measurements ensured a resolution of about 0.1 nm at 10 eV.
The threshold energy measuring method applied in this section has been described in detail elsewhere [27, 28]. It consists of extrapolating linearly the low energy side of peaks resulting from the numerical differentiation of the PIC. In addition, in order to derive the 0 K appearance energy corresponding to the lowest threshold of each fragmentation, the PICs have been deconvoluted in the threshold region. The width of the rovibrational thermal distribution used in this procedure has been evaluated at 43 meV using standard statistical thermodynamics.
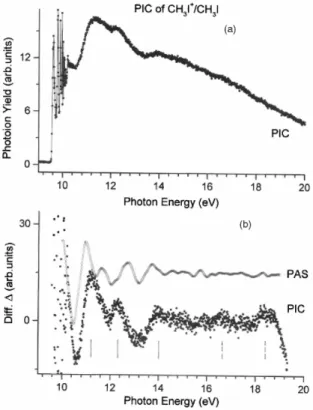
Figure 5. (a) The photoionization efficiency curve (PIC) of CH3I+ as measured between 9 eV and 20 eV photon
energy, (b) The ∆-plot of the PAS (continuous line) and of the photoionization PIC (dots) spectra between 10 eV and 19 eV photon energy. For explanation see the text and [1]. Vertical bars indicate critical energies.
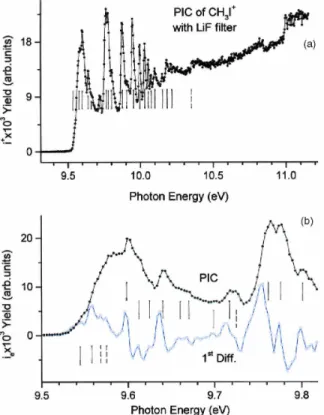
Figure 6. (a) The photoionization efficiency (PIC) curve of CH3I +
recorded with a 3 meV resolution and with the LiF filter in the 9.30-11.2 eV photon energy range and (b) the threshold region of this PIC on an expanded energy scale shown together with its numerical first derivative (1st Diff). Vertical lines locate critical energies.
3.3.1. The CH3I +
molecular ion
The PIC of CH3I+ as observed between 9.0 eV and 20.0 eV is reproduced in figure 5(a). A very compact
fine structured region between 9.5 and 10.5 eV is followed by a long tail consisting of a number of more or less well-defined broad resonance-like structures. To enhance these features the procedure mentioned in section 2.3 has been applied to the CH3I
+
PIC. The result is shown in figure 5(b) together with the ∆-plot of the PAS of CH3I
in the same photon energy range. The critical energies characterizing the maxima are measured at 11.3 eV, 12.2 eV and 13.9 eV and with less certainty at about 16.6 eV and 18.4 eV.
To explore more accurately the threshold region, the CH3I+ ionization efficiency has been measured
with a LiF filter to avoid second-order contribution and with 3 meV energy increments: the result is shown in figure 6(a). Figure 6(b) displays the threshold on an expanded energy scale together with the numerical first differentiated PIC. The vertical bar at the bottom shows the lowest onset to be at IEad = 9.543 ± 0.005 eV.
Several features observed up to about 10.4 eV are listed in column 2 of table 1 and are indicated by vertical bars. 3.3.2. The CH2I
+
fragment ion The PIC of the CH2I
+
fragment ion is reproduced in figure 7(a) as measured between 11 and 20 eV with 10 meV increments. The slightly smoothed numerical first derivative and the ∆-plot of the PAS of CH3I in the
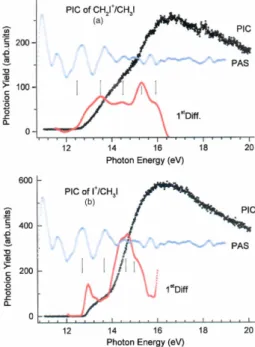
same photon energy range are displayed. Several critical energies are clearly observed in the first differentiated PIC. These are indicated by vertical bars.
At 298 K the lowest threshold for the production of CH2I +
is measured at AE (CH2I +
) = 12.40 ± 0.02 eV by linear extrapolation of the first derivative. Furthermore, maxima are observed at 13.53 eV and 14.5 eV. The last peak starts at about 14.9 eV and shows a maximum at 15.3 eV. The direct PIC likely shows weak resonances at 16.2 eV, 16.6 eV, 17.0 eV, 17.7 eV, 18.1 eV and 18.6 eV successively.
3.3.3. The I+ fragment ion
The I+ photoion yield curve measured between 11 and 20 eV is reproduced in figure 7(b) together with its numerical first derivative slightly smoothed by FFT The ∆-plot of the PAS of CH3I as measured in the same
photon energy range is also displayed.
The PIC of the I+ fragment ion shows two very well defined 'steps' followed by a continuous, smoothly decreasing ion yield. At 298 K the thresholds are measured at AE1 (I
+
) = 12.69 ± 0.02 eV and AE2 (I +
) = 13.87 ± 0.02 eV successively. A shoulder in the first derivative has to be mentioned at about 15.1 eV.
3.3.4. The CH3 +
fragment ion
The ionization efficiency of CH3 +
has been measured between 7 and 20 eV. The CH3 +
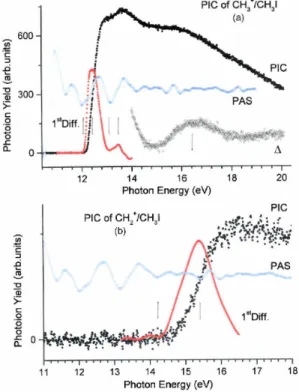
ion yield curve as observed in the 11.0-20.0 eV photon energy range has been reproduced in figure 8(a) together with the first derivative in the threshold region. The latter shows a first broad peak which extrapolates at AE1 (CH3
+
) = 12.17 ± 0.02 eV. The PIC of CH3
+
clearly shows a second step corresponding to a second but small peak in the first derivative. The extrapolation of its low-energy side is at AE2 (CH3
+
) = 13.10 ± 0.05 eV. By applying the subtraction procedure (as described in section 2.3) to the PIC of CH3+ (see the curve designated by ∆ in figure
8(a)) a broad resonance extending from 15 eV to 18 eV is enhanced. Its maximum is at about 16.4 eV. 3.3.5. The CH2
+
fragment ion
Despite its very low intensity (less than 2% of the total ion intensity) the measurement of the CH2 +
ionization efficiency has been attempted. The result is represented in figure 8(b) by a sigmoidal curve without any apparent structure. The FFT smoothed first differentiated ionization efficiency and the ∆-plot of the PAS of CH3I are shown in the same figure. The bell-shaped first derivative extrapolates at AE (CH2
+
) = 14.4 ± 0.1 eV. The large error results from the low S/N level.
As a help in the forthcoming discussion of the experimental results, the above-mentioned determinations of the onsets and energy positions of other features in the dissociative photoionization yield curves of CH2I
+
, I+, CH3 +
and CH2 +
ions are gathered in table 2 including the measurements on the CH3I +
molecular ion.
Figure 7. (a) The photoion yield curve (PIC) of CH2I +
, its first derivative (1st Diff.) and the ∆-plot of the PAS of CH3I in the 11-20 eV photon energy range. (b) The photoion yield curve of I
+
, its first derivative (1st Diff.) and the ∆-plot of the PAS of CH3I in the 11-20 eV photon energy range. Vertical bars locate the threshold and other
Figure 8. (a) The photoion yield curve (PIC) of CH3+, its first derivative (1st Diff.) and the ∆-plot of the PAS of
CH3I between 10 and 20 eV photon energy. The curve marked ∆ represents the high energy part of the ∆-plot of
the CH3 +
ion yield curve to enhance the broad resonance peaking at 16.4 eV. (b) The CH2 +
photofragment yield curve (PIC), its first derivative (1st Diff.) and the ∆-plot of the PAS of CH3I in the 11-18 eVphoton energy range.
Table 2. Summary of IE, AE and peak maxima measured in the photoionization efficiency curves of the parent and fragment ions produced by photoionization of CH3I. Comparison is made with previous measurements [14,
23].
This work [23]a,b [14]
IE/AE (eV)
Ions 298 Kg 0 K Peak Maxima (eV)a 0 K
CH3I + 9.543 ± 0.005d,e 11.3, 12.2 13.9, (16.6-18.3) CH2I+ 12.40 ± 0.07 12.50 ± 0.07 13.5, 14.5, 15.3 14 - 13.3, 14.1, 14.9 I+ 12.69 ± 0.02 12.82 ± 0.02 13.5 - 13.62 ± 0.02 12.96, 14.6, 15.1 (shoulder) CH3 + 12.17 ± 0.02 12.26 ± 0.03 12 12.269 ± 0.003 13.10 ± 0.05 (15.0-18.0) CH2+ 14.4 ± 0.1 14.55 ± 0.10 16 - PASa 11.0, 11.68, 12.69, 13.65, 15.8, 18.4 TPES 9.541 ± 0.005c 11.6, 12.6, 14.8, 15.6, 19.6 HeI [8] 9.540 ± 0.004e 11.949e, 13.9e 10.168 ± 0.004e 12.484f, 14.7f, 15.4f a
PAS [1], TPES (this work) and HeI-PES [8] are reproduced for easiness of the discussion. Only the dissociative ionization results of [23] are reproduced for comparison.
b
Standard error: ±1.0 eV.
c
For more details, see table 1, column 1.
d
For more details, see table 1, column 2.
e
Adiabatic ionization energies.
f
Vertical ionization energies. g
4. Ab initio calculations 4.1. Tools and methods
All calculations described in this work were performed with the GAUSSIAN (G03) program [29]. The electronic configuration of CH3I in the C3v symmetry point group is given by
where the 1a1 and 2a1 are the inner-shell valence orbitals and 1e, 3a1 and 2e are the outer-valence orbitals.
A valence double-zeta basis set was chosen for the calculations. This choice was conditioned by the basis sets available in the GAUSSIAN program for iodine. We chose the basis set labelled by the GAUSSIAN acronym DGDZVP which was optimized [30] for the DGauss program4 working within the density functional (DFT) theoretical approach [31]. It has been augmented with a polarization Gaussian function p for the hydrogen atoms. This basis set will be designated by DGP in the forthcoming sections. It is a contracted Gaussian-type function basis set with the following characteristics: (9s, 5p, 1d/3s, 1d) for the C atom, (5s, 1p/2s, 1p) for the H atoms and (18s, 14p, 9d/6s, 5p, 3d) for the I atom.
Several calculation levels were considered taking into account the dynamic electronic correlation (MP2 [32, 33], QCISD [34], CCSD [35, 36], B3LYP [31, 37] ) or only the static electronic correlation (CASSCF [38-40]). The wavefunction-related methods MP2, QCISD and CCSD were considered within the frozen core approximation, i.e. evaluating the electronic correlation with the valence electrons only.
The dissociation energies were calculated at the CCSD level and the zero-point energy correction (ZPE) was determined at the MP2 level. The CASSCF method was used for the characterization of the electronic excited states in the Franck-Condon region. Either seven or eight molecular orbitals (MO) were considered in the CASSCF calculations [CAS(x,7) or CAS(x,8)] depending on the number of active electrons, 5, 9 or 11 [CAS(5,7), CAS(9,8) or CAS(11,8)] for the cation and either 6, 10 or 12 for the neutral. Therefore, the three active spaces were respectively
and
where 4a1, 5a1 and (3ex, 3ey) are virtual MOs. The 4a1 and 5a1 virtual MOs are energetically important. The
second and third active spaces had to be extended to the 1e and 2a1 MO in order to reach the deeper ionized
states. Consequently, this also increased considerably the number of electronic configurations. To restrict this number one a1 or 3e virtual MOs have been discarded in the second and third active spaces. However, this
simplification will have an impact on the accuracy of the predicted energies. 4.2. Results
The results of the ab initio calculations using different methods applied to CH3I at equilibrium
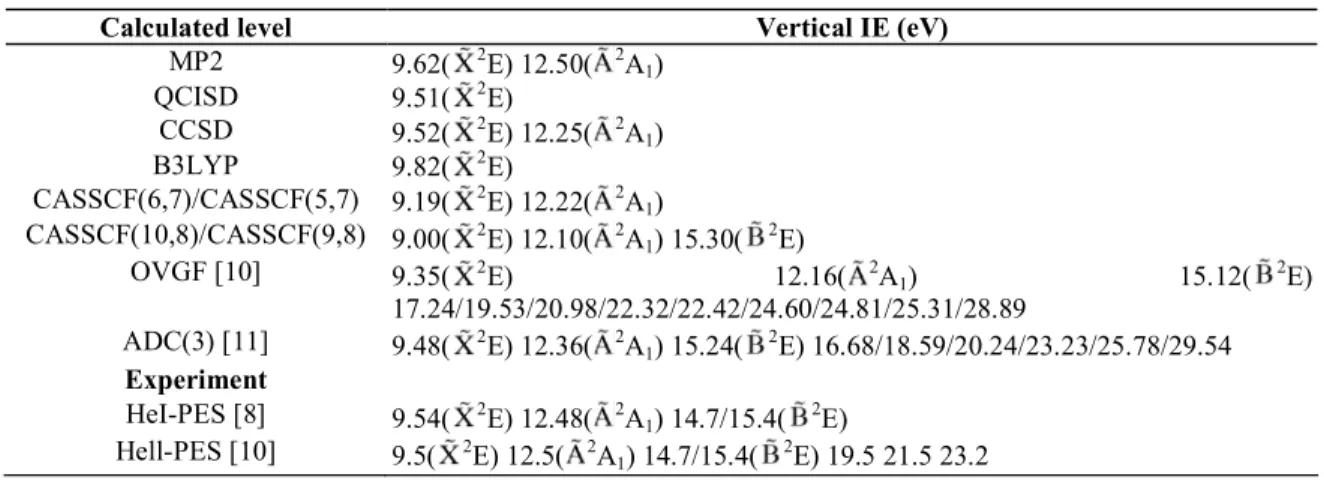
geometry and CH3I+ in the first three ionized states are tabulated in table 3. For the three vertical ionization
energies at the optimized equilibrium geometry of CH3I, the best agreement with experiment is found for CCSD,
MP2 and QCISD calculations. The CASSCF predictions are below the observed ionization energy values. The only known earlier calculations to compare with (see table 3) were reported by von Niessen et al [10] using many-body Green function (OVGF) calculations [41, 42]. Recently, Holland et al [11] reported calculations using the many-body Green function approach in the ADC(3) approximation for the interpretation of the ionization spectra. These results are also listed in table 3.
4
Table 3. Vertical ionization energies at the optimized equilibrium geometry of CH3I as calculated by different
methods. Comparison with OVGF calculations [10] and experiment [8, 10].
Calculated level Vertical IE (eV)
MP2 9.62( 2E) 12.50( 2A1) QCISD 9.51( 2E) CCSD 9.52( 2E) 12.25( 2A1) B3LYP 9.82( 2E) CASSCF(6,7)/CASSCF(5,7) 9.19( 2 E) 12.22( 2A1) CASSCF(10,8)/CASSCF(9,8) 9.00( 2 E) 12.10( 2A1) 15.30( 2 E) OVGF [10] 9.35( 2 E) 12.16( 2A1) 15.12( 2 E) 17.24/19.53/20.98/22.32/22.42/24.60/24.81/25.31/28.89 ADC(3) [11] 9.48( 2 E) 12.36( 2A1) 15.24( 2E) 16.68/18.59/20.24/23.23/25.78/29.54 Experiment HeI-PES [8] 9.54( 2E) 12.48( 2A1) 14.7/15.4( 2E) Hell-PES [10] 9.5( 2E) 12.5( 2A 1) 14.7/15.4( 2E) 19.5 21.5 23.2
Table 4. Vertical ionization energies Eion (eV) for CH3I +
at the CASSCF(11,8) level, obtained at the neutral CASSCF(12,8) optimized geometry in the C3v point group. The symmetry of the states and their description are
included.
Ionization energies (Eion) (eV) a
State Symmetry Description Eion
CAS(11,8) Comments 12E (2a1) 2 (1e)4(3a1) 2 (2ex) 2 (2ey) 9.1 2E (2a1) 2 (1e)4(3a1) 2 (2ex)(2ey) 2 l2A1 (2a1) 2
(1e)4(3a1)(2ex) 2
(2ey) 2
12.13 2
A1
22E (2a1)2(1ex)2(1ey)(3a1)2(2e)4 14.94 2E
(2a1) 2 (1ex)(1ey) 2 (3a1) 2 (2e)4 22A1 (2a1) 2 (1e)4(3a1) 2
(2ex)(2ey)(na1)* 15.22 First excited state of 2E
32E (2a
1)2(1e)4(3a1)2(2e)(2e)(4a1) 15.77 Second excited state of 2E
(2a1) 2 (1e)4(3a1) 2 (2ex) 2 (4a1) 32A1 (2a1) 2 (1e)4(3a1) 2
(2ex)(2ey)(na1)* 16.14 Third excited state of 2E
42E (2a1)
2
(1e)4(3a1)(2ex)(2ey) 2
(na1)* 16.7 First excited state of 2A1
(2a1)2(1e)4(3a1)(2ex)2(2ey)(na1)*
42A
1 (2a1)2(1ex)2(1ey)(3a1)2(2ex)2(2ey)(4a1) 18.44 First excited state of 2E
52E (2a1) 2 (1ex) 2 (1ey)(3a1) 2 (2ex)(2ey) 2
(4a1) 19.06 Second excited state of 2E
(2a1)2(1ex)(1ey)2(3a1)2(2ex)2(2ey)(4a1)
52A1 19.09 Third excited state of 2E
62E 19.31 Fourth excited state of 2
E
62A1 19.31 Fifth excited state of 2E
72A1 19.41 Sixth excited state of 2E
82A1 (2a1)
2
(1e)4(2e)4(na1)* (34%) 20.19 Mixing of 37% of second excited state
(2a1)(1e) 4 (3a1) 2 (2e)4 (27%) of 2A1 and 27% of 2A1 a
The symbol 'na1' is used where the a1 orbital is a mixture of 4a1 and 5a1.
The present calculations including both mono- and doubly excited configurations (DEC) of the molecular ion were performed at different CASSCF levels, i.e. (5, 7), (9, 8) and (11, 8). The results of the CASSCF method at the (11, 8) level for 18 excited states are listed in table 4. For comparison with the experiment, the predicted ionization energies are obtained by adding the excitation energies Eexc to IE = 9.1 eV
calculated for the neutral molecule at the equilibrium geometry using CASSCF(12,8). Furthermore, we focused our attention on the 2A1 state and the Jahn-Teller split
2
E state both of which might be involved in the dissociation of the molecular ion CH3I
+
to be discussed in the next section. The
2
A1 and 2
E become 2A' and 2A'+2A" in the CS symmetry point group. As demonstrated by ab initio
calculations in CH3Br +
2
A1. Owing to this non-adiabatic interaction between both 2
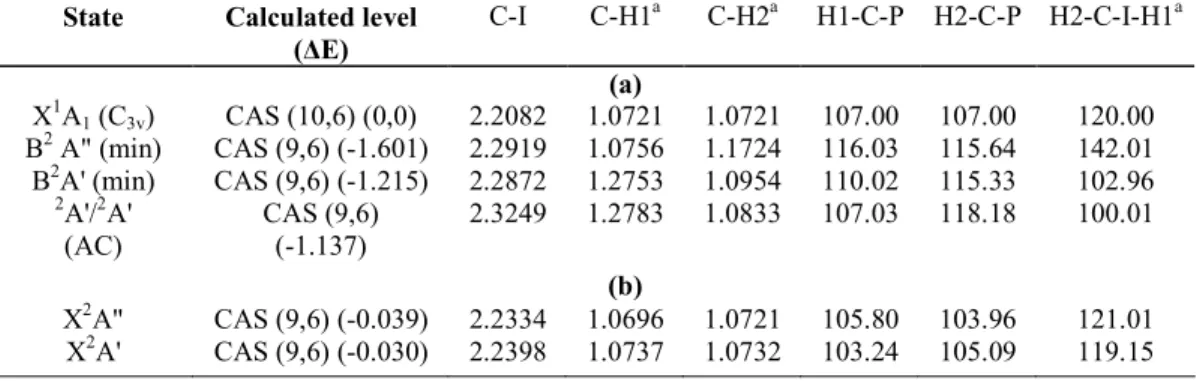
A' states, their geometry could not be optimized. However, the lowest energy point in the non-adiabatic interaction region has been determined at the CASSCF(9,6) level. The geometry parameters at this critical point are presented in the last row of table 5(a). This table also shows the optimized equilibrium geometry of the neutral. Noteworthy are the large energy differences between the apex of the cone of the potential energy surface and the minimum of the 2A" (-1.601 eV) and of the 2A' (-1.215 eV) due to the Jahn-Teller stabilization. For comparison table 5(b) lists the same parameters for the 2E state as calculated at the same level. The Jahn-Teller interaction is found to be about 30 times weaker.
The dissociation energy De for all decay channels leading to the fragment ions considered in the present
work is listed in table 6(b). All tabulated values are calculated with respect to the minimum of the 2A' stateofCH3I+ with (De°) and without (De) zero-point energy (ZPE) correction. The geometry of the polyatomic
fragments, as optimized at the CCSD(FC)/DGP level, is reported in table 6(a). For CH2 +
and CH3 +
this table shows small differences with earlier calculations [43] that have to be ascribed to the calculation level.
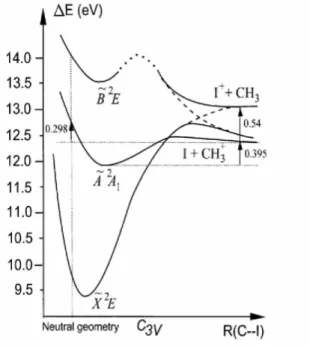
Close examination of the potential energy surface of the 2A1 along the C-I stretching coordinate
revealed the occurrence of a crossing with the 2E as schematically drawn in figure 9. This conical intersection occurs near the position of a reverse dissociation barrier obtained for the 2A1 adiabatic surface. The height of
this barrier was calculated to be 60 meV with respect to the lowest dissociation limit leading to the (I+CH3 +
) fragments and is analogous to our findings for HF+ and 1, 1-C2H2F2+ [44]. It has to be pointed out that the charge
distribution for this state switches from [I+-CH3] at the equilibrium geometry to [I+CH3 +
] at the asymptote. We shall come back to this point in section 5. The diabatic potential energy surface of the 2E state is correlated with the dissociation path leading to the (I++CH3
+
) fragments, calculated at 0.54 eV above the first dissociation limit (see the dashed lines in figure 9).
The 2E potential energy surface displays a minimum but it correlates diabatically to the lowest dissociation asymptote. Consequently, a non-adiabatic interaction with the 2E state occurs on the way to the dissociation as schematically shown in figure 9.
Table 5. Optimized geometries of the neutral, the two components of the 2E and the 2E states of CH3I +
and of the avoided crossing point 2A'/ 2A' (AC). The energy differences (∆E (eV)) refer to (a) the 2E and (b) the
2
E cation at the geometry of the neutral and are given for the CAS (9, 6) results. Interatomic distances are in Å and angles in degrees.
State Calculated level
(∆E)
C-I C-H1a C-H2a H1-C-P H2-C-P H2-C-I-H1a
(a)
X1A1 (C3v) CAS (10,6) (0,0) 2.2082 1.0721 1.0721 107.00 107.00 120.00
B2 A" (min) CAS (9,6) (-1.601) 2.2919 1.0756 1.1724 116.03 115.64 142.01 B2A' (min) CAS (9,6) (-1.215) 2.2872 1.2753 1.0954 110.02 115.33 102.96 2 A'/2A' CAS (9,6) 2.3249 1.2783 1.0833 107.03 118.18 100.01 (AC) (-1.137) (b) X2A" CAS (9,6) (-0.039) 2.2334 1.0696 1.0721 105.80 103.96 121.01 X2A' CAS (9,6) (-0.030) 2.2398 1.0737 1.0732 103.24 105.09 119.15 a
Table 6. (a) Optimized geometry of cationic and neutral radicals and (b) dissociation energy levels De in all the
decay channels considered in this work. The calculations are performed at the CCSD(FC)/DGP level. The zero-point energy (ZPE) correction is performed at the MP2(FC)/DGP level. The internuclear distances and bond angles are in Å and degrees.
(a)
Species (Symm.) C-I C-H H-C-H H-C-I
CH2 + (C2v) 1.0917 138.915 CH3+(D3h) 1.0866 120.0 CHI+(CS) 1.9242 1.0884 133.964 CH2I + (C2v) 1.9663 1.0829 120.612 119.694 CH3(C3v) 1.0793 120.0 (b) Dissociation fragments De (eV) De° = De - ZPE
CH2I+( 1A1) + H(2S) 3.18 2.88 CHI+( 2A') + H2(X 1 ∑g + ) 3.56 3.18 CH3 + ( 1A1') + I( 2 P3/2) 2.45 2.37 CH2 + ( 2A1) +HI(X 1 ∑+) 4.83 4.48 I+(3P2) + CH3( 2 A2") 3.05 2.91
Figure 9. Potential energy curves of the three lowest electronic states of CH3I+ along the C-I internuclear axis
in the C3v point group. Full lines represent the adiabatic states and dashed lines represent diabatic states. The
dotted part of the 2E state relates to a part of the curve that has not been determined. The vertical dotted line represents the Franck-Condon transition.
5. Discussion
5.1. The threshold photoelectron spectrum (figures 1 and 3).
Comparing the main aspect of the TPES and the He (I)-PES considerable differences are observed. In the 10 eV range many intense features are present in the TPES (see figures 1(a) and 3(a)) whereas mainly two peaks respectively at 9.541 eV and at 10.164 eV of equal intensity dominate this energy range in the He (I)-PES
(see figure 8 in [8]). Above 10 eV in both spectra broad peaks are observed but their relative intensities drastically change. Furthermore, a smooth but well-identified feature shows up at 11.6 eV and is absent from the He (I)-PES where no electron signal is detected in the 10.5-12 eV energy range [8]. No signal is measured either between 13 eV and 14 eV in the He (I)-PES [8] whereas the electron current is considerably enhanced in the TPES in this photon energy range.
The energy positions measured at 12.6 eV, 14.8 eV and 15.6 eV agree with those reported at 12.5 eV, 14.7 eV and 15.4 eV in the He (I)-PES [8]. Figure 1 shows the 30 times amplified signal detected between 18 eV and 21 eV photon energy. In this energy region we suspect the presence of several peaks with maxima at 19.5 eV and at 20.6 eV and an adiabatic ionization energy at about 18.9 eV. Von Niessen et al [10] reported a low-resolution He (II)-PES of CH3I at 30.4 nm and mentioned ionization energies at 19.5 eV and 21.5 eV [11]. Using
hv = 85 eV photons, Holland et al [11] reported the photoelectron spectrum of CH3I between 9 eV and 28 eV.
Fairly intense bands are observed at 19.5 eV, 20.9 eV, 21.6 eV, 22.2 eV and 24.6 eV successively.
The high-resolution TPES of CH3I between 9.5 eV and 10.5 eV is displayed in figure 3(a) showing
numerous features listed in table 1, column 1. To help in the interpretation of this spectrum, the PAS [1] of CH3I
in the same photon energy range has been reproduced in figure 3(b). The close correlation between both spectra and the involvement of autoionization of Rydberg states in the production of CH3I
+
is obvious.
Table 7. TPES [16] and the best resolved He(I)-PES [8] spectroscopic data and their assignments as reported in the literature.
TPES [16] He(I)-PES [8]
Energy (eV)a,b Assignmentc Energy (eV)d Assignmentc
9.534(IP) 2 E3/2-0,0 9.540 2 E3/2-0,0 9.560(1) Autoion. 9.605(2) v6 9.601 v6 9.654 v5 9.685(3) v4 9.697 v4 9.733(4) ? 9.760 v4+v6 9.810 v4+v5 9.847(5) 2v4 9.854 2v4 9.912(6) v1, v2 9.919 v2 9.967(7) ? 10.001(8) 3v4 10.02 n.a. 10.060(9) ? 10.151(10) 2 E1/2-0,0 10.168 2E1/2-0,0 10.174(11) Autoion. 10.298(12) v4 10.282 v5 10.322 v4 10.477 n.a. 10.536 v1 a
Energies obtained by the addition of 9.534 ± 0.005 eV to the positions given by [16] in their table 2 and using 1 eV = 8065.545 cm-1
[45].
b
The energy positions are followed by the authors' [16] numbering of the features as designated in their figure 4.
c
Assignments as reported in both works [16] and [8] but using the vibrational modes designation in the CS symmetry point group. d
Energy positions in bold font correspond to the same energy positions determined in the TPES measured in the present work (see table 1, data in bold font).
For comparison table 7 lists the data (and assignments) obtained by TPES as reported by Bear et al [16]. Most of the observed structures were assigned to vibrational excitation of CH3I+. The features at 9.560 eV (1)
and at 10.174 eV (11) were assigned to autoionization: the final ionic state is not specified. On the other hand, the high-resolution He (I)-PES results [8] are also listed in table 7. The best fitting energies in this latter work and those measured in the present TPES study are highlighted in bold font in tables 1 and 7.
All Rydberg states detected between 9.54 eV and 10.18 eV decay by autoionization. Owing to the discriminating properties of the electron energy analyser (see section 3.1), photoelectrons of translational energy Te ≥ 30 meV can be considered as being suppressed. The energy separation between vibronic states of the
molecular ion and the Rydberg autoionizing states observed in the PAS should not exceed this critical energy. The vibrational levels should coincide with autoionizing states which have an appreciable absorption cross section from the ground state. Their corresponding TPES signal could be considerably enhanced even when their Franck-Condon factor for direct PES is very small or even vanishing. Therefore, the most obvious assignment of most of the features observed in the TPES is the resonant or nearly resonant autoionization of the Rydberg states already identified in the PAS of CH3I [1] and listed in the fourth column of table 1. All these Rydberg states
converge to the 2E1/2 ionization limit of CH3I at 10.164 eV.
In the same column assignments are proposed for each feature designated by the intermediate Rydberg state(s) and the final 2E3/2(v) vibronic state(s). The predicted energy levels of these states (in brackets) were
obtained by the addition of the relevant vibrational energy as reported by Karlsson et al [8] to the vibrationless ionization energy of 9.541 eV.
Below 10.164 eV, i.e the onset of the 2E1/2 state of CH3I +
, most of the features could be interpreted in terms of resonant autoionization to the 2E3/2(υνi
+
or (υνi +
+υ'vj) +
) ionic state involving up to high vibrational quantum numbers υ and/or υ' of the three modes v4+, v5+ and v6+ and their combinations. However, several
structures are found to be resonant with the Jahn-Teller active v3+ mode predicted at 1489 cm-1 (0.189 eV), e.g. at
9.760 eV, 9.985 eV and 10.095 eV for which no alternative interpretation could be proposed using the v4 +
, v5 +
and/or v6 +
normal modes and/or their combinations.
As already mentioned, between 10.4 eV and 18 eV the TPES considerably differs from the He (I)-PES in the presence of fairly strong signals peaking at 11.6 eV and between 13 eV and 14 eV in the TPES. In this energy range the ∆-plot of the PAS is reproduced in figure 1(b). It shows several features which have been reported earlier [1] and whose energy positions are listed in table 2.
In the energy range below 12 eV two broad absorption bands were identified at 11.0 eV and 11.68 eV and assigned to Rydberg transitions involving a 3a1 and a 1e electron respectively [1]. These states are expected
to autoionize to vibrationally highly excited 2E1/2 molecular ions. As predicted by ab initio calculations, the
TPES data show that very likely the 2E and the 2A1 states overlap (see figure 9). Autoionization to 2
E should occur above 12 eV and fill almost completely the 2E and 2A1 potential wells. In the He (I)-PES this
latter ionic state exhibits a very long vibrational v6+ progression [8]. A line broadening and intensity decrease is
observed from υ = 9 or 0.305 eV above the adiabatic ionization energy of the 2A1 state. This observation could
be related to the existence of the interaction between the 2A1 state and the 2
E state predicted around 0.395 eV above the 2A1 potential minimum. A non-adiabatic transition would prevent the
2
A1 state to dissociate and
would force the system to follow the 'diabatic' surfaces ( 2A1/ 2
E) corresponding to the conservation of the charge distribution.
Above 18 eV very weak structures are observed in the TPES (see figure 1). Several bands are likely to be observed as for all previously studied methyl halides [43, 46]. The TPES of all these compounds exhibit very weak (about 2-3% of the strongest transition) structures in the 18-22 eV photon energy range. The weakness and the ionization energy range of these states argue for forbidden transitions to doubly excited ionic states (DEIS) [43, 46]. Table 4 shows several single and DEIS configurations, involving the valence orbitals 2a1, 1e, 3a1 and 2e
and the 4a1 (5a1) virtual MOs. Their vertical energy is calculated at the optimized CH3I geometry in the C3v
symmetry point group in the CASSCF(12,8) active space. Several DEIS are predicted between 15.2 and 20.2 eV and should correspond to the most important features observed between 15 eV and 20 eV in the TPES.
5.2. The CIS spectra (figure 4)
In contrast to the TPES the CIS spectrum gives access to both the final ionic states and to the neutral states whose autoionization produces one preselected vibronic state of the molecular ion. Owing to the weakness of the CIS signal, measurements have been restricted to a limited number of vibronic states of CH3I
+
, i.e. at 9.570 eV, 9.725 eV and at 9.804 eV (marked by an asterisk (*) in table 1). The result is shown in tables 8 and 1 for the three individual and the summed CIS (ΣCIS) curves. Each curve represents the relative photoionization cross section of the molecular ion in its preselected vibronic state. The sum over all states of these curves should converge to the total photoionization efficiency curve PIC (see figure 6).
In the present spectra the energy positions of most of the features are directly related to the PAS of CH3I
+
and their assignments are included in table 1. In table 8 the energy positions are listed for the three individual CIS curves. In this table the relative intensities and peak characteristics are included. As shown (in
bold font) many Rydberg states exhibit large relative intensity variations between the different final ionic states. From these measurements the branching ratio for autoionization of the successive Rydberg states to the different final ionic states could be deduced. These data are expected to be useful in comparing theoretical attempts to treat the autoionization problem.
The vibronic state at 9.570 eV corresponds to the (2E1/2)7da1 Rydberg state manifold [1] (see table 1).
The CIS spectrum reported by Carlsson et al [15] for CH3I +
(υ = 1) level is fairly close to the shape of the spectrum displayed in figure 4. Only the relative intensities in the threshold region are larger in the present work. This has to be ascribed to the difference of the preselected final state. In the present case, the Rydberg state has to autoionize to the CH3I
+
( 2E3/2, v = 0) ionic state with increasing electron translational energy. The TPES
clearly shows that the same Rydberg state predominantly autoionizes providing ZEKE electrons, i.e. very likely CH3I+ ( 2E3/2, υ = 0, J) molecular ions where J are resonant rotational levels.
The state at 9.725 eV corresponds to resonant autoionization to CH3I + ( 2E3/2, 3v6 + or (v5+v6) + ) (see table 1). The CIS spectrum is very similar in shape to that measured at 9.580 eV. The intensity is decreased by a factor of about 6 (see table 8). Just above threshold the contributions of the strong (2E1/2)[8da1, 8de and 10 pa1]
are considerably reduced.
The most important changes are observed at 9.804 eV corresponding to CH3I+ ( 2E3/2, (v4+v5)+). The
relative cross section is almost unchanged with respect to the CIS spectrum at 9.725 eV but the main contributions are provided by autoionizing states which are weak to very weak in the two lower lying states (see table 8).
5.3. Photoionization mass spectrometry 5.3.1. The CH3I
+
molecular ion (see figures 5 and 6) The PIC of CH3I
+
(figure 6(a)) roughly shows two quite different parts: (i) a region with narrow structures between 9.5 eV and 10.5 eV and (ii) the 10.5-20 eV region exhibiting only a few weak broad resonances superimposed on a decreasing background.
For the positioning of the features in the latter photon energy range, the subtraction procedure described in section 2.3 has been applied. The result is shown in figure 5(b) together with the ∆-plot of the PAS of CH3I in
the same photon energy range. At least for the major peaks the correlation between both results is obvious and their maxima are measured at 11.3 eV, 12.2 eV and 13.9 eV. These resonances would involve the excitation and autoionization of Rydberg states [1], e.g. (2A1)7s or (2E3/2)6s at 11.3 eV, (2E3/2)6p and (2E1/2)6s at about 12.2 eV
and (2E3/2 or 2
E1/2)6d or 5d at 13.9 eV respectively.
The threshold region of 9.5-11.2 eV photon energy has been examined in detail (figure 6(a)). The energy positions of the structures observed in this energy range are listed in table 1, column 2. For higher accuracy in the determination of the threshold the PIC is first differentiated in the threshold region: the result is shown in figure 6(b). The first onset corresponding to the ionization energy IEad (CH3I) = 9.543 ± 0.005 eV
agrees with the value measured in the present work by TPES at 9.541 ± 0.005 eV and at 9.541 ± 0.004 eV by He (I)-PES [8]. Previous mass spectrometric photoionization works reported 9.533 ± 0.01 eV [13] and 9.550 ± 0.006 eV [3]. By Rydberg series analysis Baig et al [47] determined the lowest ionization energy at 76 930 ± 1 cm-1 (9.5381 ± 0.0001 eV) in very good agreement with the ZEKE-PFI spectroscopic determination of Strobel et al [9] at 76 932 ± 5 cm-1 (9.5385 ± 0.0006 eV). Song et al [14] measured 76 932 cm-1 (9.5381 ± 0.0001 eV) by PFI-PEPICO.
5.3.2. The CH2I+ fragment ion (see figure 7(a))
The PIC of CH2I +
as measured between 11 eV and 20 eV is reproduced in figure 7(a). To the best of our knowledge no photoionization efficiency curve of CH2I
+
/CH3I has been reported earlier. The ∆-plot of the PAS
of CH3I is displayed in the same figure. To allow us to apply the extrapolation method [27, 28] for the threshold
energy determination the slightly FFT-smoothed numerical first derivative is also displayed. The lowest threshold energy measured for CH2I
+
/CH3I at 298 K is AE (CH2I +
) = 12.45 ± 0.07 eV, after deconvolution of the thermal distribution. Using equations (IV) and (VII) of Traeger and McLaughlin [17], the AE (CH2I
+
) at 0 K is estimated to be equal to 12.50 ± 0.07 eV. Besides this fairly well-defined onset, the direct as well as the first differentiated PIC show several other features. Slope changes are measured at about 13.3 eV, near 14.1 eV and 14.9 eV respectively. The first derivative shows maxima at 13.5 eV, 14.4 eV and at 15.3 eV. In the breakdown
diagram obtained by PEPICO [18] an extrapolated threshold near 13.3 eV is estimated. By electron impact appearance energies of CH2I
+
/CH3I at 12.08 ± 0.09 eV [20] and at 12.78 eV [22] have been reported. By dipole
(e, e+-ion) spectroscopy, Olney et al [23] measured an appearance energy at 14 ± 1 eV for the CH2I +
fragment ion.
Table 8. Energy position (eV) of the successive features observed in the CIS spectra measured at 9.570 eV, 9.725 eV and 9.804 eV respectively. Qualitative estimations of the relative intensitya and peak characteristicb are indicated in parentheses.
CIS at 9.570 eVc CIS at 9.725 eVc CIS at 9.804 eVc 9.608 (w) 9.618 (vw) 9.634 (vw) 9.646 (w) 9.670 (vw) 9.692 (vw) 9.725 (vw) 9.741 (vw,sh) 9.767 (vst) 9.784 (vst) 9.780 (w,sh) 9.792 (vst) 9.793 (w) 9.797 (st,sh) 9.810 (st) 9.809 (w) 9.824 (st,sh) 9.819 (w) 9.834 (w,sh) 9.843 (vw,sh) 9.841 (vw) 9.842 (w,sh) 9.857 (vw) 9.865 (vw) 9.866 (w) 9.882 (vst) 9.890 (vst) 9.890 (st) 9.907 (st) 9.905 (st,sh) 9.900 (vw) 9.926 (w) 9.920 (w) 9.920 (vw) 9.937 (vw) 9.937 (w) 9.932 (vst) 9.953 (vst) 9.957 (st,sh) 9.942 (st) 9.957 (st,sh) 9.961 (vst) 9.952 (st,sh) 9.971 (st,sh) 9.971 (st,sh) 9.979 (w,sh) 9.979 (w,sh) 9.984 (vst) 10.001 (st) 9.991 (vw) 9.996 (w,sh) 10.008 (st) 10.008 (vst) 10.010 (w,sh) 10.023 (vw,sh) 10.019 (st) 10.020 (vst) 10.031 (vw,sh) 10.027 (vw) 10.026 (st,sh) 10.037 (st) 10.045 (st) 10.045 (st,sh) 10.046 (vst) 10.051 (st,sh) 10.055 (w,sh) 10.056 (vw) 10.063 (st) 10.061 (w,sh) 10.066 (st) 10.069 (w) 10.073 (st) 10.081 (w) 10.079 (w,sh) 10.078 (st) 10.099 (vw) 10.093 (st) 10.092 (vst) 10.109 (w) 10.109 (w) 10.104 (w) 10.119 (vw) 10.119 (st) 10.114 (vw) 10.127 (w) 10.126 (vw) 10.139 (w) 10.138 (st) 10.151 (vw) 10.146 (st) 10.163 (vw) 10.162 (vw) 10.160 (w) a
Relative intensity: vw: very weak, w: weak, st: strong, vst: very strong.
b
Peak characteristic: no indication: resolved, sh: shoulder.
c
The lowest threshold energy for CH2I+ production as determined in the present work is very close to the
vertical ionization energy of CH3I +
( 2A1), i.e. 12.484 eV [8] (see table 2). As already mentioned the 2
A1 PES
as reported by Karlsson et al [8] shows a perturbed vibrational progression between 12.27 eV and 12.34 eV. A conical intersection (CI) 2E/ 2A1 is predicted by our calculations at 12.344 eV. A second perturbation is
observed [8] near the vertical ionization energy at 12.484 eV: it could be assigned to the avoided crossing which has to occur between the 2E and 2E states. Using the IEad(CH3I
+
( 2E)) = 9.52 eV as predicted at the CCSD level and the calculated dissociation energy for CH2I+( 1A1)+H(2Sg) (see table 6(b)), one obtains the
dissociation level at 12.40 eV in rather good agreement with the experiment [AE0K(CH2I +
) = 12.50 ± 0.07 eV]. Both fragments in their specified spectroscopic term correlate with the 2A' component of the ground electronic state of CH3I
+
( 2E) in the Cs symmetry point group.
The agreement between experimental and theoretical onsets suggests the absence of any substantial kinetic energy released on the fragments. This makes thermochemical determinations possible based on equation (IX) proposed by Traeger and McLoughlin [18]. The latter relates the heat of formation of a given fragment ion at 298 K to its appearance energy at the same temperature, to the heat of formation of the neutral precursor and of the neutral fragment(s) and to the heat capacities of both the ionic fragment of interest and its neutral counterpart. Using the most recent value of ∆fH298K(CH3I) = 15.23 ± 0.05 kJ mol-1 from Bodi et al [48] together
with ∆fH298K(H) = 218 kJ mol-1 [49], the vibrational wave numbers of CH2I+ as obtained by Tao et al [50] and
our present onset determination at 298 K, we calculate ∆fH(CH2I +
)298 = 1009 ± 7 kJ mol -1
. This value is 9 kJ mol
-1
lower than the most recent data reported by Lago et al [51] based on TPEPICO investigation of the dissociative photoionization of CH2I2, i.e. ∆fH298K (CH2I+) = 1 018 ± 4 kJ mol-1. From the adiabatic ionization energy of CH3I
(9.543 eV) and the 0 K appearance energy of CH2I +
(12.50 ± 0.07 eV), a dissociation energy D0 (H - CH2I +
) = 2.96 ± 0.07 eV can be deduced, in satisfactory agreement with the predicted value of 2.88 eV (see table 6b).
The examination of the first derivative of the PIC of CH2I +
reveals several structures between 13 eV and 16 eV. In the difference PAS of CH3I broad resonances are detected at the corresponding photon energies. This
could mean that autoionization of these Rydberg states at least will lead to the CH2I +
I++H dissociation channel. To the best of our knowledge no spectral data are available about this cation. Only recently, Tao et al [50] reported about a laser spectroscopic work on CH2I. They observed a fluorescence excitation spectrum generated
by CH2I+ as a spectral carrier. They measured its origin at about 15180 cm-1 (1.882 eV) and assigned it to the 3
A1→ 1
A1 transition. Using this excitation energy, an appearance energy of 12.50 + 1.88 = 14.4 eV would be
expected. This dissociation limit correlates with 4A' and 2A' states. The 2A' should be involved in the present observations.
Moreover, direct dissociative ionization will also contribute through the Jahn-Teller split 2E ionic state which could lead to the CH2I
+*
+H exit channel(s). The 2E state is subject to a non-adiabatic interaction with the 2E state. The contribution of the 2E ionic state to this fragmentation is confirmed by PEPICO experiments [18] where coincidences are only measured between 14 eV and 16 eV, i.e. the 2E Franck-Condon region. In addition the absence of coincidences below 14 eV would point to dissociative autoionization as the most probable mechanism.
5.3.3. The I+ fragment ion (see figure 7(b))
The PIC of I+is shown in figure 7(b) together with the ∆-plot of the PAS of CH3I in the 11-20 eV
photon energy range. A slightly FFT-smoothed first derivative of the PIC is shown in the same figure. By linear extrapolation of the first derivative two well-defined threshold energies are observed at AE1 (I+) = 12.69 ± 0.02
eV and AE2 (I+) = 13.62 ± 0.02 eV. The corresponding maxima are measured at 12.96 eV, 14.6 eV and a
shoulder at about 15.1 eV. After deconvolution of the thermal distribution and the correction using equations (IV) and (VII) of [17], a OK appearance energy AE1 (I
+
) = 12.82 ±0.02 eV is obtained. The present results could only be compared with electroionization data. Using the RPD method for monochromatizing the electron beam, besides an onset near 11.8 eV, Tsuda et al [19] reported thresholds at AE1 (I+) = 12.9 eV, AE2 (I+) = 13.6 eV
and at AE3 (I +
) = 14.4 eV successively. Olney et al [23] measured the onset for I+/CH3I at 13.5 ± 1.0 eV.
The lowest onset energy of I+ formation at 12.82 eV is close to the threshold measured for CH2I +
(see the previous section). Similarly, it lies in the Franck-Condon region leading to the vertical ionization of the CH3I
+
( 2A1) state. The adiabatic dissociation pathways from the 2
E and the 2A1 states lead to the I+CH3 +
lowest energy fragments (see figure 9) but non-adiabatic interaction regions are predicted by the present ab initio calculations (see section 4.2), i.e. in the C3v symmetry point group between the 2E state and the 2A1 (conical
intersection) and between the 2E and the
B
~
2calculated to be D0° (I+ - CH3) = 2.91 eV and D0° (CH3+ - I) = 2.37 eV (see table 6). Through direct ionization
the 2A1 state is vibrationally excited up to 13.0 eV and involves the v6 +
C-I stretching vibration only [8]. By PEPICO experiments [18] the breakdown diagram shows a threshold energy of I+ near 12.6 eV. The branching ratio of I+ increases to a maximum near 14.2 eV and decreases steadily from 14 eV to 17 eV, i.e. in the CH3I
+
( 2E) energy range. In addition, the intensity decrease of CH3I +
is balanced by the I+ ion intensity increase in the vicinity of the vertical ionization energy of the 2A1 state. On the other hand, figure 7(b) shows
that autoionization of CH3I through the ( 2
E3/2)6p Rydberg state at 12.69 eV (absorption maximum) will very
likely play a considerable role.
For the lowest threshold at 12.69 eV, the previous considerations all together would point to a dissociative autoionization and predissociation mechanism of the 2A1 state. In the present resonant photoionization
experiment the 2A1 population via autoionization has to be considered and dissociative autoionization could be
involved as a competitive mechanism. A support to this hypothesis is the large enhancement of the intensity of the 2A1 and 2E states in the TPES of CH3I (see figure 1(a)).
Besides the PEPICO onset for I+ [18] the only experimental value of the AE (I+) to compare with is measured by electroionization at 11.8 eV or 12.9 eV [19]. It would be difficult to account for the discrepancy of 0.8 eV even if the ion-pair I++CH3
is invoked for this onset: the electron affinity EA (CH3) = 0.080 ± 0.030 eV
[52]. The critical energy at 12.9 eV is comparable to the energy at 12.69 eV determined in the present work. A discrepancy of 0.2 eV between electron impact and photoionization onset determinations is common. By our own quantum mechanical calculations the dissociation asymptote corresponding to I+(3P2) + CH3( 2A2") is
predicted at 9.54 + 2.91 = 12.45 eV (see table 6) in fairly good agreement with, though lower than, the present experimental determination.
The I+ ion formation PIC (see figure 7(b)) clearly shows a second onset at AE2 (I +
) = 13.62 ± 0.02 eV, i.e. 0.96 eV above the lowest threshold. By electroionization [19] a critical energy at 13.6 eV has been reported. This onset lies between the Franck-Condon region for direct ionization of the 2A1 and of the
2
E states of CH3I
+
[8]. The TPES unambiguously shows a considerable ZEKE-electron signal between 13 eV and 14 eV. In the difference PAS an absorption maximum is observed at 13.65 eV (see figure 7(b) and table 2) which has been assigned to (2E3/2)6d or (2E3/2)5d Rydberg states which could autoionize.
The energy difference of ∆E = 0.96 ± 0.04 eV has to be ascribed to the excitation energy of one or both dissociation moieties. For the CH3 radical no spectroscopic data are available for electronic excited states
between the ground state and the first excited Ryberg state at 5.729 eV (46205 cm-1) [53]. The I+ atomic ion shows a 3P1 excited level at 0.879 eV [26] and a 3P0 level is determined at 0.799 eV above the 3P2 ground level
[26]. The excitation energies involved would place the onset energies at 12.69 + 0.88(or 0.80) = 13.57(or 13.49) eV respectively for the 3P1 and
3
P0 spectroscopic terms of I +
. Presumably an excess energy of 0.050 (or 0.130) eV could be involved in the dissociation.
5.3.4. The CH3+ fragment ion (see figure 8(a))
The PIC corresponding to the appearance of CH3 +
as measured between 11 eV and 20 eV is reproduced in figure 8(a). Actually, the photon energy range of 7-11 eV has been scanned carefully to search for evidence for CH3
+
by ion-pair formation. In all methyl halides investigated previously [43, 46, 54] the production of CH3 +
through the ion-pair CH3+ + X- process has been detected. It could be pointed out here that the relative cross
section for this process decreases steadily in the order F ≥ Cl > Br iodine having an even lower electronaffinity [55], we expect a small ion-pair formation cross section for CH3I. The work of Shaw et al [56] clearly showed
this trend for ion-pair formation cross section in CH3Cl and CH3Br. At normal ion source pressure of CH3I no
CH3 +
signal has been observed. At higher pressures a very weak ion signal starts at 9.5 eV (i.e. the ionization energy of CH3I) and the yield is about 4 × 10³ times smaller than the signal measured at 13 eV. It is very likely
produced by secondary processes and it has, therefore, not been considered further. Above 11 eV the first appearance energy measured for CH3
+
is AE1 (CH3 +
) = 12.17 ± 0.02 eV as derived from the extrapolation method applied to the first derivative of the PIC (see figure 8(a)). After deconvolution of the thermal distribution and correction using equations (IV) and (VII) of [17] a 0 K appearance energy of 12.26 ± 0.03 eV is obtained. At higher energies this curve as well as the direct PIC clearly shows a second onset at AE2 (CH3
+
) = 13.10 ± 0.05 eV. Above 14 eV the photoion yield decreases regularly and shows a broad resonance which is highlighted by the subtraction method (see section 2.3) and denoted as ∆ in figure 8(a).
This resonance has a maximum at 16.4 eV and spreads from 15 eV to 18 eV. The difference PAS of CH3I as
measured in the 11-19 eV is displayed in the same figure. The dissociative photoionization of CH3I along the CH3
+
+ I channel has been investigated by several techniques. By electroionization only Tsuda et al [19] reported about the CH3+ + I- ion-pair formation at 9.1 eV,
10.1 eV, 11.8 eV and 12.6 eV successively. Their lowest onset assigned to CH3+ + I is measured at 12.2 eV. By
dissociative photoionization mass spectrometry appearance energies at 12.25 ± 0.03 eV [13] and 12.18 ± 0.01 eV have been reported. By TPEPICO Mintz and Baer [57] measured the onset at 12.24 ± 0.01 eV at 0 K. By PFI-PEPICO [14], Song et al located the 0 K threshold at 12.269 ± 0.003 eV at 0 K. Using a new imaging PFI-PEPICO technique, Bodi et al [48] determined very recently with high accuracy a 0 K onset at 12.248 ± 0.003 eV. The onset measured in the present study is in good agreement with these two most recent results.
The first onset at 12.17 ± 0.02 eV corresponds to the energy range of the CH3I +
( 2A1) state.
Noteworthy is that the first peak in the first derivative shows the same parameters as the He I-PES peak related to the 2A1 state of CH3I
+
[8]: a maximum at 12.45 eV and spreading from 12.0 eV to 13.0 eV. The He I-PES band corresponding to this ionic state consists of a long C-I stretching vibrational progression starting at 11.949 eV and extending up to 13.05 eV [8]. The vertical ionization energy of the 2A1 is observed at 12.484 eV [8]. As
mentioned earlier, the regular progression is perturbed at two levels, i.e. at about 12.254 eV and 12.43 eV. By quantum mechanical calculations / and / non-adiabatic interactions are predicted in the present work (see section 4.2). All interactions lead to the adiabatic correlation of the 2E state with the CH3
+
+ I dissociation limit which is predicted to be at 9.54 + 2.37 = 11.91 eV (see table 6), i.e. about 0.3 eV lower than the experimental value.
By He I-PEPICO experiments [18] the breakdown diagram shows a broad peak between 12 eV and 13 eV indicating the production of CH3+ ions in coincidence with photoelectrons corresponding to the 2A1 state
over its entire energy range. This observation would indicate a strong interaction of the ionic state with the 2E state. This process should be characterized by a sufficient lifetime, to allow several vibrations to occur because they are observed in the PES [8]. By resonant photoionization autoionization of the (2E3/2)6p Rydberg state is
superimposed to this process enhancing the population of the 2A1 state as observed in the TPES (see figure
1(a)). In addition, a TPEPICO study indicates that at threshold the dissociation rate of CH3I +
in the CH3 +
+ I channel is of 107 s-1 [57]. This slow reaction rate constant is also compatible with a non-adiabatic interaction.
In the direct CH3 +
photoion yield and in the first derivative of the PIC a second threshold is unambiguously identified at 13.10 ± 0.05 eV. The energy difference with the first onset is 0.93 ± 0.07 eV. This amount could be assigned to the excitation energy of one or of both dissociation partners. The most probable assignment to this excess energy is the excitation of the I atom in its 2P1/2 level at 7 603.5 cm
-1
(0.942 eV) [26] above the ground 2P3/2 level.
This reaction path should run over Rydberg series autoionization. No direct ionization cross section is observed in the He I-PES between 13 eV and 14 eV. Only the TPES shows a photoelectron signal in the high energy range (see figure 1(a)). The ∆-plot of the PAS of CH3I shows very clearly a broad absorption band with a
maximum at 13.71 eV (see table 2). The shape of this band is very close to that of the first derivative peak and both are very likely closely correlated.
5.3.5. The CH2 +
fragment ion (see figure 8(b))
The relative intensity of the CH2+ fragment ion in the CH3I mass spectrum is less than 2%. To the best
of our knowledge, the dissociative ionization of CH3I in this particular channel has never been reported, neither
by electron impact nor by photoionization. The PIC measured for this ion is reproduced in figure 8(b) together with its FFT-smoothed first derivative. This curve is a fairly smooth bell-shaped curve spreading from 14.2 eV to 16.4 eV. The threshold obtained by linear extrapolation of the first derivative is 14.4 ± 0.1 eV. The ∆-plot of the PAS of CH3I is represented in the same figure. After deconvolution of the thermal distribution and correction
using equations (IV) and (VII) of [17] a 0 K appearance energy of 14.55 ± 0.10 eV is derived.
The broad peak of the first derivative of the CH2+ PIC fits rather well the He I-PES peak of the 2E
state of CH3I +
[8]. On the other hand, it spreads also over a photon energy range where weak absorption bands have been identified [1], e.g. the (2A1)6s Rydberg state at 15.8 eV.
The dissociation level for CH2 +